Platinum Price Analysis: Potential Bottom Formation Inside a DowPlatinum (XPT/USD) | 4H Technical & Fundamental Analysis
Hello everyone, and welcome back to all my fellow TradingView followers! 🌹📊
I hope your trading journey is going well and your decisions are always backed by proper risk management.
Today, we’re taking a closer look at Platinum (XPT/USD) on the 4-hour timeframe. 🔎
🏦 Fundamental Perspective
Platinum is both a precious metal and an important industrial commodity. 🪙⚙️
Beyond its value as a precious metal, platinum has a wide range of industrial applications, including:
🚗 Automotive catalytic converters and emissions-control systems
🧪 Chemical and petrochemical industries
💎 Jewelry
⚡ Hydrogen technologies and clean energy
🏭 Various industrial and electronic applications
Because of this dual role, platinum is influenced not only by the broader precious-metals market, but also by industrial demand, global economic conditions, production cycles, and supply constraints.
In an environment of economic and geopolitical uncertainty, precious metals can attract increased investor attention. However, platinum can behave differently from gold because of its significant industrial component. 🌍📈
📉 Technical Picture — Strong Decline, But Important Support Ahead
From a technical perspective, the chart clearly shows that platinum has experienced a significant correction and decline, and the broader structure has not yet turned fully bullish. 📉
However, the interesting part is that price has now reached an important support area while simultaneously forming a compression/consolidation pattern. 🔻➡️🔺
This compression suggests that the trading range is gradually becoming tighter, potentially indicating that the market is preparing for a stronger move.
Therefore, the current area could potentially become a candidate for a medium-term bottom. But it is still too early to confidently say that a confirmed bottom is already in place. ⚠️
🔍 Could This Be a Market Bottom?
This is exactly where patience becomes important. 🧠
If price breaks above the current compression structure, followed by a breakout of the key resistance levels shown on the chart and a successful retest, we could gradually start considering a potential bottom formation and the beginning of a medium-term bullish move. 🚀📈
On the other hand, if the compression breaks to the downside and the major support area fails, the bearish structure remains valid and the possibility of further downside increases. 🔻
For now, rather than making a definitive prediction, it may be better to wait for a confirmed breakout in either direction.
📊 Possible Scenarios
🟡 Range Scenario:
In the short term, price may continue ranging between the marked support and resistance zones while the compression structure develops.
🟢 Bullish Scenario:
Breakout above the upper boundary + confirmation + successful retest → could be the first meaningful sign of improving momentum and a potential medium-term upside move. 📈🚀
🔴 Bearish Scenario:
Breakdown below the key support → increases the probability of trend continuation to the downside and potentially lower prices. 📉
The key point:
The chart is still bearish from a broader structural perspective. So even though the current area looks technically interesting, we cannot confidently say that the downtrend has ended. A confirmed structural shift remains important. ⚠️
🗳️ What Do You Think?
Do you think this compression could be the beginning of a bottom formation and a medium-term bullish trend? 🤔
🟢 Yes — high probability of a bottom
🟡 For now, I expect more range-bound price action
🔴 No — further downside is more likely
Share your view in the comments! 👇💬
⚠️ Disclaimer
This analysis is provided for educational purposes and as a personal technical-market view only. It does not constitute financial or investment advice, nor is it a recommendation to buy or sell.
Financial markets — particularly leveraged instruments and commodities — involve substantial risk. Always conduct your own research, use appropriate risk management, and consider your individual circumstances before making any trading decision. 📚🛡️
🏷️ Tags
#Platinum #XPTUSD #PlatinumTrading #PreciousMetals #Metals #Commodities #Forex #ForexTrading #TechnicalAnalysis #PriceAction #TradingView #4H #Support #Resistance #Breakout #Compression #MarketAnalysis #RiskManagement #Trading
CFDs on Platinum (US$ / OZ)
No trades
No trades
In-depth trading ideas
Platinum Wave Analysis – 4 August 2026
– Platinum broke resistance level 1680.00
– Likely to rise to resistance level 1835.00
Platinum recently broke the resistance level 1680.00 (which is the upper border of the narrow sideways price range inside which the price has been moving from the end of June).
The breakout of the resistance level 1680.00 coincided with the breakout of the 38.2% Fibonacci correction of the downward impulse from the start of June.
Platinum can be expected to rise further to the next resistance level 1835.00 (top of wave 4 from the start of June).
Platinum — the record is behind it, now a long stallPlatinum spent 2025 in one of its strongest runs in years, and 2026 has been about digesting it.
Late 2024 into January 2026 : a sustained climb to a record above $2,900 an ounce — the bundle runs beneath price the whole way up, structure and direction agreeing.
January to May 2026 : the unwind. Price gives back a large share of the rally, breaking down through the same structure that had carried it.
Since May : a long stall, holding in the $1,600 area. Whether this is the base the next leg builds from, or just a pause before more downside, is open — the structure shows a stall, not a verdict.
Method: tendency planimetry (Insen / OpenTraders) — families of moving averages whose convergence zones act as dynamic support and resistance with direction.
Not financial advice. For analysis and education only.
Platinum update....Short played out well !!!Platinum Significant move — spot dropped from 1649.92 to 1567.30, a break of every level I flagged. Rejection at the PWH/PDH shelf played out (scenario #1 from last update), and it didn't just fade to PWPOC — it drove straight through PWPOC 1623.65, through PDL 1607.82, through PWL 1553.50 is not yet touched but 1567.30 is now below the entire prior weekly range and inside the discount zone toward PML 1537.95. Note also the Weekly POC has shifted to 1623.65 (merging with the prior week's POC — the value area printed one level and held). Spot: 1567.30 — down from 1649.92, a ~5% drop that cleared PWPOC, PDL, and is now testing the lower boundary of the prior weekly range (PWL 1553.50), closing in on PML 1537.95. DXY firmed back to 100.82 (from 100.57) while real yield eased slightly to 2.297% (from 2.341%) — a mixed macro signal, meaning this move looks more like a positioning/liquidation break than a clean macro-driven repricing. The magnitude of the drop relative to modest DXY/yield shifts suggests stops were run through PDL/PWPOC, likely compounded by the prior 4H FOMO exhaustion finally resolving downward hard. Below: 1553.50 PWL → 1537.95 PML — this is the last major liquidity shelf before open air on the chart down toward the Weekly 200 EMA (1326.58) / the marked "Strong Low" discount zone
This is now a liquidity-void trade: spot has broken clean through a full daily and partial weekly range with no intermediate structure until 1553.50/1537.95.
Trade Location & Invalidation Levels
Short (trend continuation — now the higher-probability side):
Entry zone: 1567–1608 (current price / retest of broken PDL as resistance)
Invalidation: above 1653.72 PWH
Target 1: 1553.50 PWL
Target 2: 1537.95 PML
Long (counter-trend bounce / value hunt — lower probability, requires confirmation):
Entry zone: 1537.95–1553.50 (PML/PWL confluence)
Invalidation: below 1537.95 PML on a confirmed close, not just a wick
Target 1: 1623.65 PWPOC/WPOC
Target 2: 1653.72 PWH
Given Daily regime is still Neutral/Balanced but 4H remains FOMO/Overheated (likely now reflecting overheated downside velocity rather than the prior upside reading, this is a momentum-continuation environment, not a fade environment, until 1537.95 is tested.
XPTUSD Range Trap: 29-Retest Ceiling in Play, Stacked Liquidity▪️ XPTUSD H1 SNAPSHOT — EXECUTIVE SUMMARY
▪️Platinum is trading near 1,568.44, pressing into the lower demand cluster after leaking away from resistance. Structure is consolidating just above stacked support.
▪️ Primary outlook is cautious — the reaction at 1,554.00 is the key tell. A hold sets up a mean-reversion bounce; a loss opens the liquidity pocket below.
▪️ Key resistance zone: 1,584.50, where sellers have defended 12 times. Above that, 1,608.50 and 1,653.50 stack as the extended ceiling.
▪️ Major defense line: 1,608.50 — a strong level at 29 retests, the anchor of the demand stack.
▪️ Primary downside targets: 1,554.00, where liquidity is heavily stacked.
▪️ Major liquidity magnet below: 1,584.50–1,554.00 — this zone is anchored by strong demand and could spark a sharp bounce once tested.
▪️ Bullish scenario: A daily close back above 1,584.50 flips the tape and targets 1,608.50, then 1,682.00.
▪️ KEY LEVELS
▪️ Current Price: 1,568.44
RESISTANCEs
▪️ 1,682.00 — ★★★ 7.2 Strong · 8 retests
▪️ 1,653.50 — ★★★ 7.9 Strong · 11 retests
▪️ 1,608.50 — ★★★ 7.7 Strong · 29 retests
▪️ 1,584.50 — ★★ 6.4 Moderate · 12 retests
SUPPORTs
▪️ 1,554.00 — ★★ 6.1 Moderate · 6 retests
▪️ ProjectSyndicate Levels Desk — Overview of key S/R zones for metals, indices, NVDA, NQ, ES & GC traders every week. Subscribe to stay up to date with the latest levels.
Platinum XPT/USD ....PLATINUM (XPT/USD) — SPOT UPDATE: 1649.92
Immediate implication: price has reclaimed 1623.65 PWPOC and is now trading just below PWH 1653.72 and PDH 1682.67 — essentially knocking on the same supply zone that rejected it before (the "shooting-star" high at 1682.67). Combined with the 4H FOMO/Overheated regime tag, this is the second approach into that resistance shelf, which raises the stakes on whether it holds or breaks.
Updated Liquidity Map
Above: 1653.72 PWH (right overhead) → 1682.67 PDH → 1720 SP → 1815.30 PH/L
Spot 1649.92 — now inside the 1623.65–1653.72 pocket, effectively pinned under PWH
Below: 1623.65 PWPOC (now first support, ~26 handles away) → 1605.37 PDL → 1593.54 WPOC Trade Location
Short (fade PWH/PDH supply, unchanged thesis, tighter trigger now):
Entry zone: 1650–1683 — price is now already inside this zone
Invalidation: above 1720 SP
Target 1: 1623.65 PWPOC
Target 2: 1593.54 WPOC
Long (breakout continuation):
Entry: confirmed close/hold above 1653.72 PWH
Invalidation: back below 1623.65 PWPOC
Target 1: 1682.67 PDH
Target 2: 1720 SP
Wyckoff / Candlestick read, updated
Price grinding back up into the same supply shelf that produced the prior rejection (1682.67 high, fade to 1629) is classic retest-of-upthrust behavior — the market is probing to see if that was a clean UT (reject again) or a UTAD that eventually resolves higher on a second attempt. The 4H FOMO tag reinforces caution: this is not a low-risk chase point. A rejection candle forming into 1653–1683 here would confirm the supply hold; a clean push through 1683 that stays offered would flip the near-term structure bullish.
Probability Ranking :
1) Rejection at PWH/PDH shelf (1653–1683), fade back to PWPOC 1623.65 Second test of same supply zone, 4H overheated, no fresh macro catalyst yet 2) Break and hold above 1683 → run at 1720 SP35%Momentum already carried price back to the shelf; softer DXY (100.57) supportive 3) Sharp reversal through PWPOC to WPOC 1593.5420%Would need fresh hawkish catalyst (Hormuz escalation, hot CPI) to override current bid
Given the 4H FOMO tag and price sitting directly under a level that already rejected once, the highest-quality trade location right now is still the short-side fade at current spot (1650) with invalidation at 1720, not chasing further upside into unconfirmed resistance.
Platinium / Potential Long Option This moment now, seems to be right for closing the short and opening a long position. Our main target of 1565 has been reached and therefore all our short positions have already been closed. Confirmation of the new uptrend will be received upon a breakthrough of 1700-1720 key level.
The Second Main target, on this frame is 2130$.
I wish you success!
XPTUSD (Platinum) BUY Setup | Bullish RSI Divergence & Trend RevXPTUSD (Platinum) is showing a potential bullish reversal on the 4H timeframe after forming a clear bullish RSI divergence at a strong support zone, indicating that bearish momentum may be fading. Price has started to form a higher low, increasing the probability of an upside continuation if buyers maintain control above the entry level. My trade plan is Buy at 1643.80, with a Stop Loss at 1529.19, Take Profit 1 at 1745.41, and Take Profit 2 at 1862.12. As always, this is my personal technical analysis, not financial advice—wait for confirmation and apply proper risk management before entering any trade.
Platinum about to drop like a rockAfter a rebounding upon the release of the non-farm payrolls data, platinum seems to have formed an ascending channel which is about to break to the downside.
Considering that the rate hike scenario for 2026 is still into play, only delayed a bit for now, I am prone to believe that the macro-scenario is still bearish for precious metals.
XPTUSD (Platinum Spot) LONG — 1W ALMA Setup (WR 82%)█ SETUP
Platinum spot · CAPITALCOM:XPTUSD · 1W · long only.
ALMA Averaging Strategy: ALMA 3 / σ2, SD band 2, min diff 1 bar to add / 1 bar to exit, 25% per bar, up to 4 adds, hard stop −10% from average entry.
Strategy Tester (platinum 1W, matched alert):
Win rate 82% · profit factor 3.1 · max drawdown 26%
Typical hold ~21 bars on winners · long-only weekly sleeve on spot CFD
═
█ WHY NOW
The metals complex sold off into May CPI week; spot platinum is being worked on a slower clock than the 3D perp book.
Two weekly ALMA long adds are live on the same 1W template — first fill 07 Jun, fresh add 14 Jun on the weekly bar. This is averaging a correction inside an 82% WR backtest sleeve, not a breakout chase.
═
█ MACRO
Headwinds: CPI / higher-for-longer rate bets hit non-yielding hedges — gold and BINANCE:BTCUSDT fell together into the print. Industrial metals stay sensitive to USD and growth scares.
Offsetting: China’s extended official gold-buying streak supports the broader precious-metals bid. Weekend geopolitical headline relief helped risk assets bounce — platinum often lags gold on the way down and catches up on mean-reversion legs.
Platinum = precious + industrial hybrid — auto/catalyst demand matters alongside the safe-haven tape.
═
█ OUTLOOK
Positive factors
- 82% WR / PF 3.1 on the 1W ALMA template for this symbol
- Fresh weekly add on 14 Jun — signal still inside the 24h publication window
- Metals complex stabilizing after CPI shock; spot 1D leg already green in the live book
Negative factors
- Weekly bars = slow feedback; macro gap risk can overshoot a %-based stop
- Past backtest ≠ live fills on CFD spot (spread, roll, session gaps)
Base case: weekly mean-reversion inside the ALMA add zone if the metals complex holds post-CPI.
Bear case: USD strength + growth scare extends the slide · −10% stop from working average on each lot.
Educational idea. Live position — past backtest ≠ future results. NFA.
Platinum: Bears Remain in Full Control📊 Platinum: Bears Remain in Full Control ⚠️
🔍 The Pulse:
Platinum continues to trade in a strong bearish trend. 📉
Price has broken a major confluence zone at 1,910, confirming a significant loss of support. ⚠️
This level combined the main support, the 200 day moving average, the Fibonacci 38.2% retracement, and a triangle pattern. 🎯
After the breakdown, price also lost a key liquidity grab level, retested it, and continued lower. 🔻
The current reaction from an important order block is encouraging but not enough to signal a bullish reversal. 🔎
🧱 The Key Structural Boundaries
🛡️ Current Support, Order Block.
The market is reacting from this demand zone, but confirmation is still missing.
🚀 Bullish Confirmation, 1,910.
Price must reclaim this major confluence level to restore a positive outlook.
📊 Major Confluence, 1,910.
This level includes the main support, the 200 day moving average, the Fibonacci 38.2% level, and the triangle breakout zone.
🎯 The Verdict
The technical trend remains decisively bearish.
The current order block is producing a reaction, but the structure has not changed.
A move back above 1,910 is required before turning bullish.
Until then, sellers remain firmly in control.
---
If you like my insights, follow and boost! 🙌💙🚀
🎁 $15 TradingView Discount:
🔗 www.tradingview.com ✨💸🤑
Breaks out of falling wedgeAs I posted previously, PLATINUM has been moving in a falling wedge, after hitting a high 2914. With a recent bounce from 1745, it broke out of the wedge. Now it is staying side-ways for a while, respecting the ascending channel it broke previously.
I would expect it to come to the buying area marked (1880-1990 range) and then start its journey towards the wedge target marked.
Some intermediate levels to look for 2240,2430.
Final target 2800.
XPTUSD Daily — Watching for a Reversal SetupAccording to my technical analysis, platinum (XPTUSD) is currently forming a falling wedge on the Daily timeframe. There is also a weekly Fibonacci structure supporting this scenario.
Most likely, price may still move lower toward the 1.2 Fib level, where a bounce could happen. If bearish momentum continues, the next area to watch is the 1.6 Fib level, which could also become a potential reversal zone.
🎯 Long-term target after reversal:
• 2993
For now, I’m monitoring the situation closely, as the structure looks quite similar to what we are currently seeing on gold and silver.
More details on the chart.
Good luck and trade safe! 🍀
⚠️ This is only my technical analysis — always do your own research and follow your own strategy.
❤️ If this analysis helps your trading day, please support it with a like or comment
Platinum Wave Analysis – 9 June 2026 - Platinum broke key support level 1835.00
- Likely to fall to support level 1660.00
Platinum recently broke the support zone between the key support level 1835.00 (which has been reversing the price from the start of February) and the 61.8% Fibonacci correction of the upward impulse from last August.
The breakout of this support zone accelerated the impulse wave 3 of the medium-term impulse wave (C) from May.
Platinum can be expected to fall to the next support level 1660.00 – target price for the completion of the active impulse wave (C).
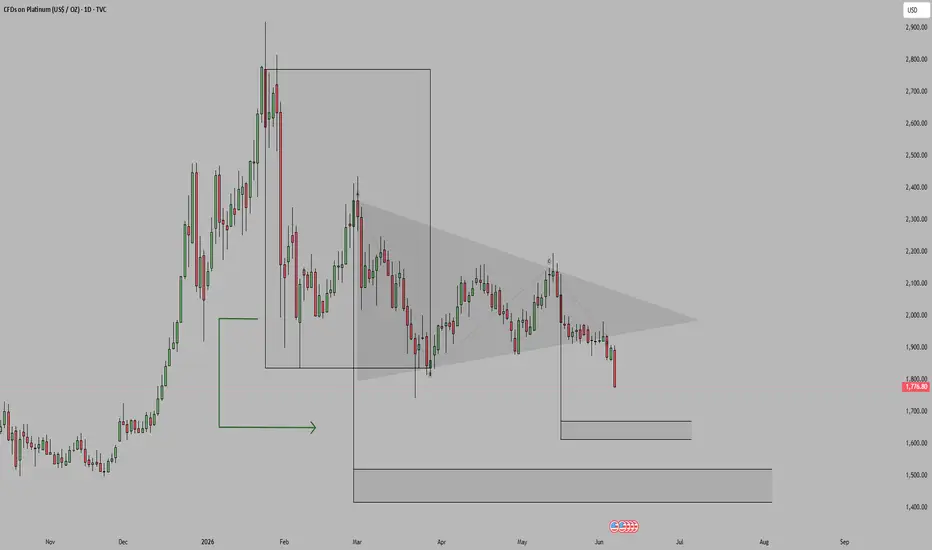
Platinum 1D Breakdown Targets Key Demand ZonePlatinum on the 1D timeframe is currently showing a bearish structural breakdown after failing to sustain price inside a prolonged compression structure and now delivering downside displacement toward a major reaction area.
What stands out here is the way price transitioned from a strong bullish expansion into a broad distribution phase. After reaching the premium extreme, the market failed to continue higher and started rotating within a wide range, showing that bullish momentum was gradually weakening.
The highlighted compression / triangle structure shows how price continued making weaker reactions while sellers defended the upper boundary. Instead of producing a clean bullish continuation, the market kept accepting lower prices and eventually broke beneath the internal support area.
Another important observation is the current bearish displacement. Price is not slowly drifting lower; it is moving aggressively away from the broken structure. This suggests that sellers are currently in control, and the market is now approaching the first highlighted demand zone around 1650–1600.
This demand zone becomes the key decision point. If buyers defend this area and create a strong reaction, Platinum could produce a corrective bounce back toward the broken structure and internal liquidity. However, one reaction candle alone would not be enough to confirm a full reversal. Price would need to reclaim the broken support area and start accepting back inside the previous range.
If the current demand zone fails to hold, the next major area of interest becomes the deeper highlighted demand region around 1500–1400, where price previously created a strong base before the larger bullish expansion.
Speculative Outlook:
If buyers successfully defend the current demand zone and begin reclaiming the broken range, Platinum could develop a relief rally toward the 1850–1950 region before the next directional move forms.
However, if sellers maintain pressure and price continues accepting below the current demand zone, Platinum could rotate lower toward the deeper demand area around 1500–1400, extending the bearish structure further.
For now, Platinum remains structurally weak after breaking down from compression, while the current demand zone acts as the key decision point for whether this move becomes a temporary reaction or deeper downside continuation.
Educational idea only, not financial advice.