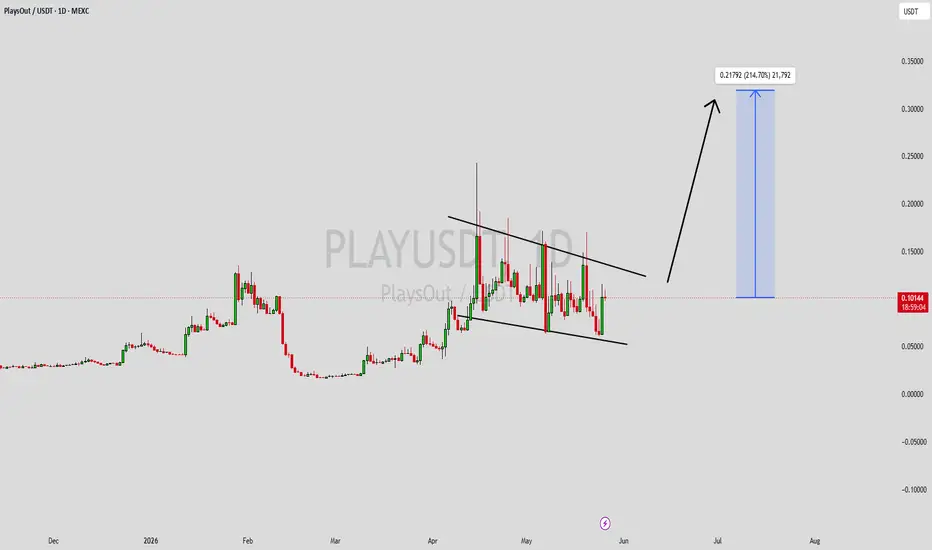
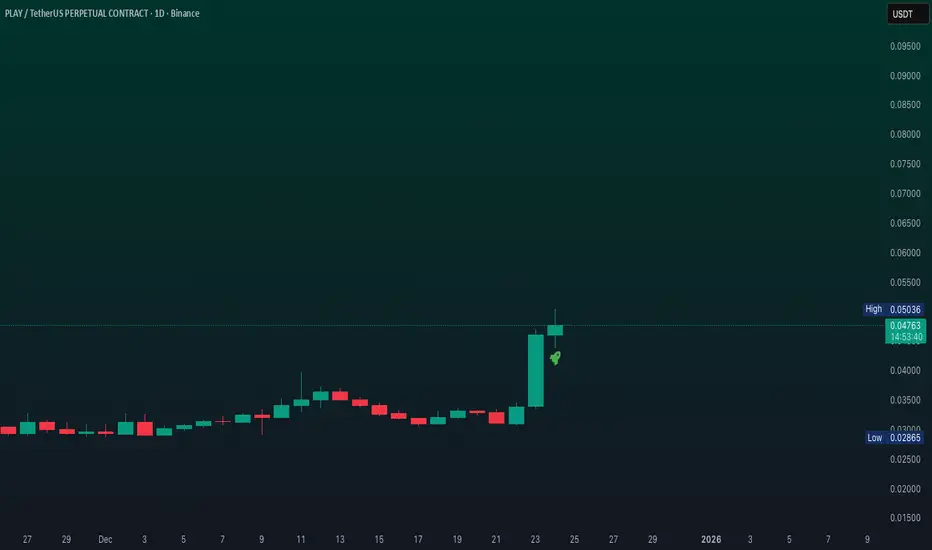
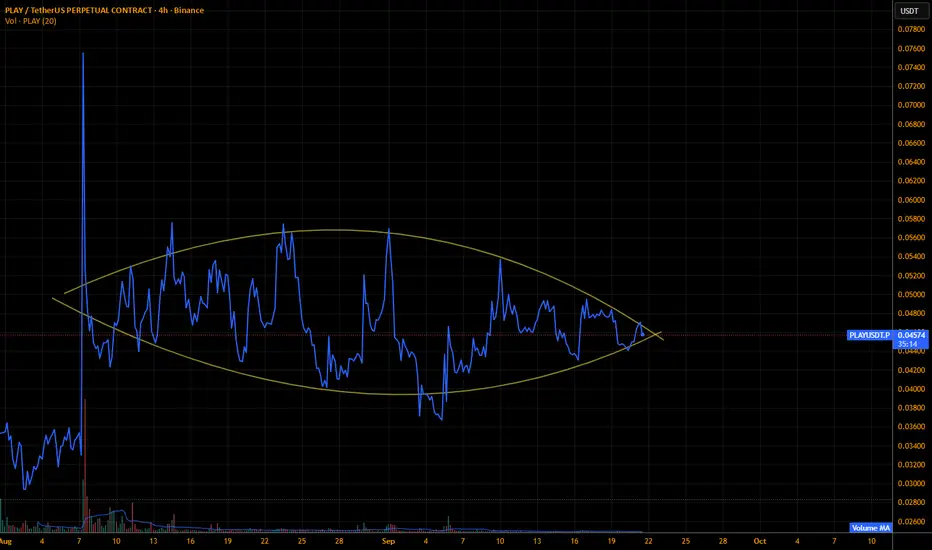
PLAYUSDT Forming Bullish MomentumPLAYUSDT is forming a clear bullish momentum pattern, a classic bullish wave signal that often indicates an upcoming breakout. The price has been consolidating within a narrowing range, suggesting that selling pressure is weakening while buyers are beginning to regain control. With consistent volume confirming accumulation at lower levels, the setup hints at a potential bullish breakout soon. The projected move could lead to an impressive gain of around 140% to 150% once the price breaks above t
PLAYSOUT/USD TETHER PERPETUAL SWAP CONTRACT
No trades
No trades
In-depth trading ideas
PLAYUSDT Breaking Out of a Tight Triangle Formation
📈 NASDAQ:PLAY is showing strong bullish momentum on the 15-minute timeframe after consolidating inside a symmetrical triangle. Price is holding above key support while buyers continue to defend higher lows.
🔍 What I’m Watching:
✅ Triangle breakout confirmation
✅ Volume increasing near resistance
✅ Strong support around 0.0353
✅ Potential move toward 0.0385 and beyond if momentum continues
🎯 Bullish Targets:
* TP1: 0.0385
* TP2: 0.0430
* TP3: 0.0480
🛑 Risk Management:
A close below 0.0350 w
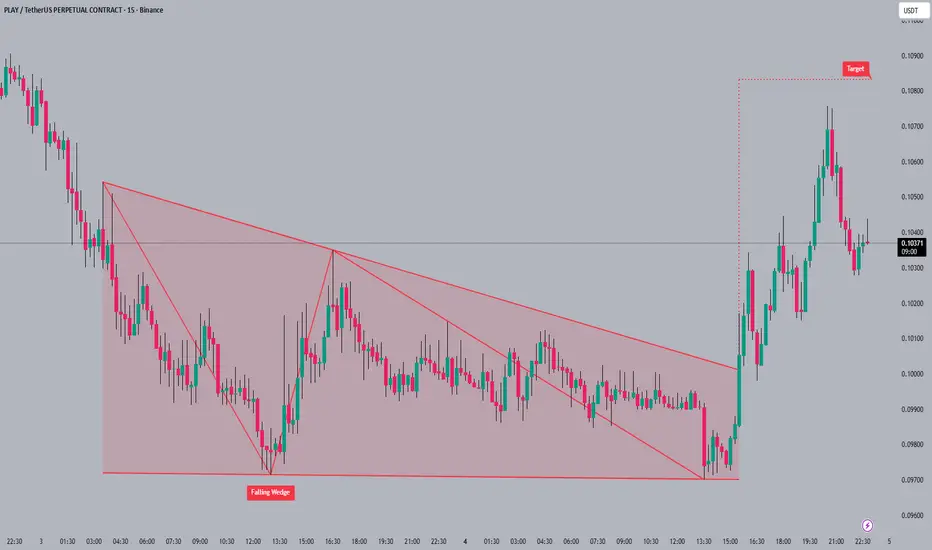
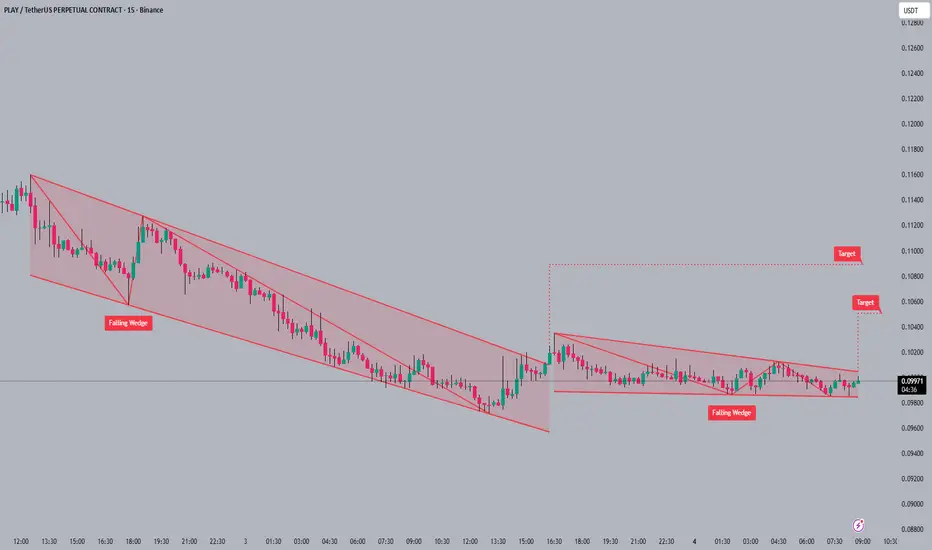
PLAYUSDT Forming Falling WedgePLAYUSDT is forming a clear falling wedge pattern, a classic bullish wave signal that often indicates an upcoming breakout. The price has been consolidating within a narrowing range, suggesting that selling pressure is weakening while buyers are beginning to regain control. With consistent volume confirming accumulation at lower levels, the setup hints at a potential bullish breakout soon. The projected move could lead to an impressive gain of around 190% to 200% once the price breaks above the
PLAY: Broadening-Wedge-Formation, Breakout Confirmation!Hello There,
welcome to my new analysis about PLAY from the weekly timeframe perspective. In recent times, I detected interesting altcoins in the market that are likely to transform into great trading opportunities. PLAY is one of them. As the altcoin has already increased volatility in recent times, I now detect all the further signs, which are highly important to consider here.
When looking at my chart now, we can watch there how PLAY formed this gigantic broadening wedge formation. Such a
Massive Buy opportunity in PLAYusdtHello Traders!
PlayUSDt is at the perfect position to go for a long. In previous patterns it failed to complete the target so same patterns will now kick in and will push it up to our target.
Stoploss 0.02849(-8%)
Target 0.03869(+24%)
My aim is to achieve highest win rate in tradingview trading community :) and we will definitely do that.
Trade Analysis Based On:
• A1000x Master Reversal Strategy
• A1000x Secret S/R Strategy
• Candlestick Patterns
• A1000x Stop Loss & Target Strategy
We t
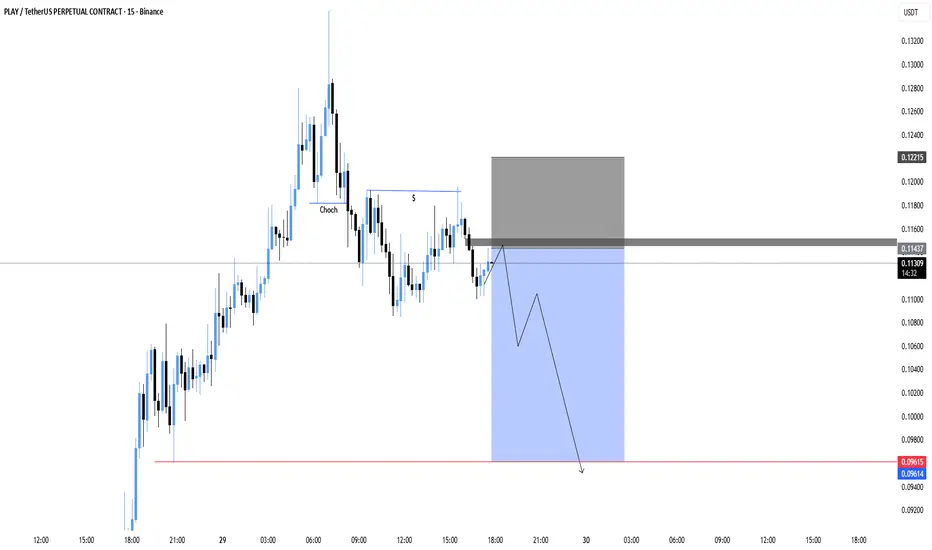
PLAYUSDT – Short-Term Pullback SetupPLAY has completed a strong upside move and is now showing signs of weakness after failing to hold above the recent high. Price is reacting from a supply area, indicating potential for a short-term pullback.
As long as price remains below this resistance zone, sellers may continue to pressure the market, opening room for a retracement toward the lower support area.
Entry: 0.1130 - 0.114
Stoploss: 0.1221
Targets:
0.1050
0.0960
If price breaks and holds above the supply zone, this pullback sce
Play - Beautiful setup🐻 SHORT – PLAY
A strong bearish divergence is confirmed on the 1H timeframe, while extreme overbought conditions persist on both the 4H and Daily charts. Price has expanded excessively, signaling momentum exhaustion. This unhealthy structure typically precedes distribution and a sharp sell-off. I am confident a downside move is imminent.
🎯 TP: 0.034
🛡️ SL: 0.05488
📊 RR: 1 : 3.84
A clean short setup: multi-timeframe overbought + bearish divergence → high probability of a strong correction.
PLAY Analysis (4H)Before anything else you should know that this coin is highly volatile and considered risky so make sure to manage leverage and position size properly.
PLAY has hit a strong supply zone and then formed a bearish CH and is now pulling back into the previous wave supply.
There is also a large amount of liquidity below the chart which is why we are looking for sell short positions.
If price reaches the supply zone you can take a sell position with confirmation.
targets : 0.03203$ _ 0.03021$ _ 0
PLAY/USDT — Tight Ascending Structure Pressing Into Major ResistHey there!
December 10, 2025
PLAY has been coiling inside a very tight ascending structure, gradually pushing into its main resistance zone.
This type of price action is a classic sign of pressure building before a potential breakout.
The chart is showing one of the strongest bullish setups it has formed in weeks.
🔍 Technical Overview
Current price: ~$0.0336
4EMA: ~$0.0309 → price is consistently holding above it.
Volume has increased during the recent push upward, confirming genuine inter
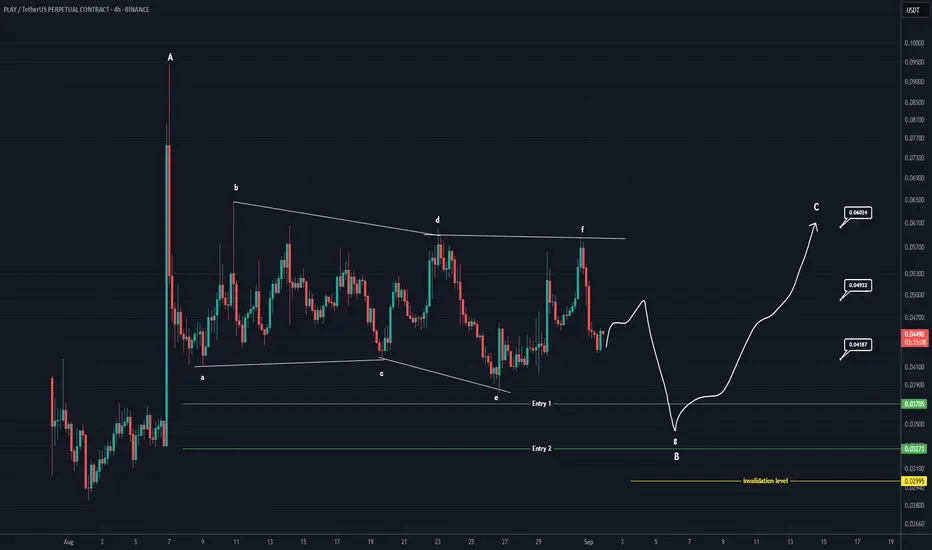
PLAY Analysis (4H)It seems that the price is currently completing wave g of B. After this wave is completed, we can expect an upward move. The best area for wave g to complete is around the green lines marked on the chart, which represent our entry zones.
Please note that due to the high volatility of this coin, this setup is suitable for the spot market only, not futures
The targets are marked on the chart. A daily candle close below the invalidation level will invalidate this analysis.
For risk management, p