PLUME Ready for a 65% Pump?PLUME is starting to look interesting as momentum builds around the RWA narrative. Recent ecosystem developments, growing exchange visibility, and institutional-focused updates are putting Plume back on traders' radar.
Price is still near lower levels, while volume and sentiment are improving. If PLUME can break key resistance and hold momentum, a 65% upside move could be on the table.
In-depth trading ideas
all signs point to .02 being the next targetDecided to do an inverted look at Plume to see if I was bullish or bearish on it. well, everything Im seeing is pointing to a sharp "drop" to around 2 cents as being one of the more likely scenarios for how this plays out next.
ive been long for a while dca spot and leverage on the lows a few weeks back. will keep it open for now, especially if we break out soon and move for .02 for a test.
btc doing something incredibly bearish may drag it down but seems like its gaining strength vs btc recently so im hoping for a move soon.
PLUMEUSDT 1D#PLUME is trading within a descending triangle pattern on the daily timeframe and is currently testing the 100-day SMA. Consider accumulating a small position at the current level and adding near the key support zone. A confirmed breakout above both the 100-day SMA and the triangle resistance could open the way toward the following upside targets:
🎯 $0.01295
🎯 $0.01419
🎯 $0.01543
🎯 $0.01719
🎯 $0.01943
⚠️ Always use a tight stop-loss and apply proper risk management.
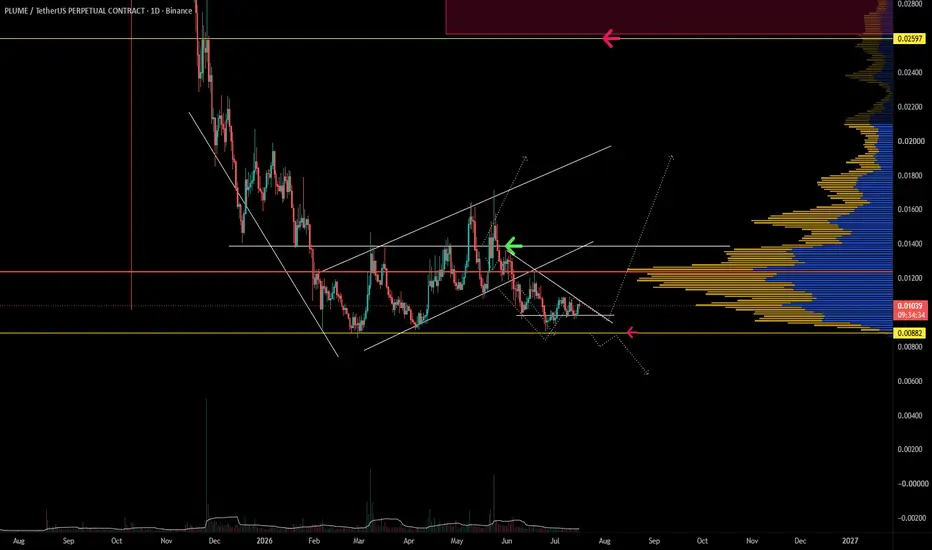
PLUME Technical AnalysisPLUME remains in a broader corrective structure, but price is now compressing above a major daily support zone. The recent decline has formed a descending wedge, with lower highs pressing price into an area that has already produced several strong reactions.
The volume profile shows heavy participation above the current range. The first meaningful confirmation would be a breakout from descending resistance, followed by a reclaim of the red high-volume level. Above that, the white horizontal resistance becomes the next major test and could open the door for a larger trend reversal.
The Synergy Signal is showing improving momentum and a potential bullish divergence while price holds support. This suggests sellers may be losing strength, but confirmation is still required.
The setup is straightforward: hold the yellow support and reclaim resistance for a bullish reversal. A daily breakdown below support would invalidate the structure and likely extend the correction.
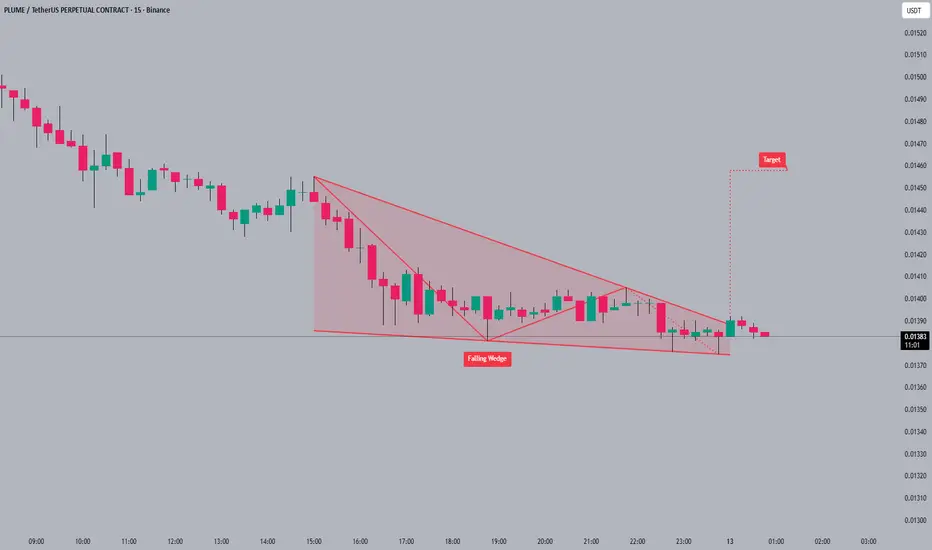
PLUMEUSDT Forming Bullish MomentumPLUMEUSDT is forming a clear bullish momentum pattern, a classic bullish wave signal that often indicates an upcoming breakout. The price has been consolidating within a narrowing range, suggesting that selling pressure is weakening while buyers are beginning to regain control. With consistent volume confirming accumulation at lower levels, the setup hints at a potential bullish breakout soon.
The projected move could lead to an impressive gain of around 60% to 70% once the price breaks above the wedge resistance. This bullish momentum pattern is typically seen at the end of downtrends or corrective phases, and it represents a potential shift in market sentiment from bearish to bullish.
Traders closely watching PLUMEUSDT are noting the strengthening momentum as it approaches a breakout zone. The strong trading volume adds confidence to this setup, showing that market participants may already be positioning early in anticipation of a bullish reversal.
Investors’ growing interest in PLUMEUSDT reflects rising confidence in the project’s long-term fundamentals and current technical strength. If the breakout confirms with sustained volume, this could mark the beginning of a fresh bullish leg. Traders may find this setup attractive for medium-term gains as the momentum pattern nears completion and buying pressure continues to build.
✅ Show your support by hitting the like button
✅ Leaving a comment below! (What is your opinion about this coin?)
Your feedback and engagement keep me inspired to share more insightful market analysis with you!
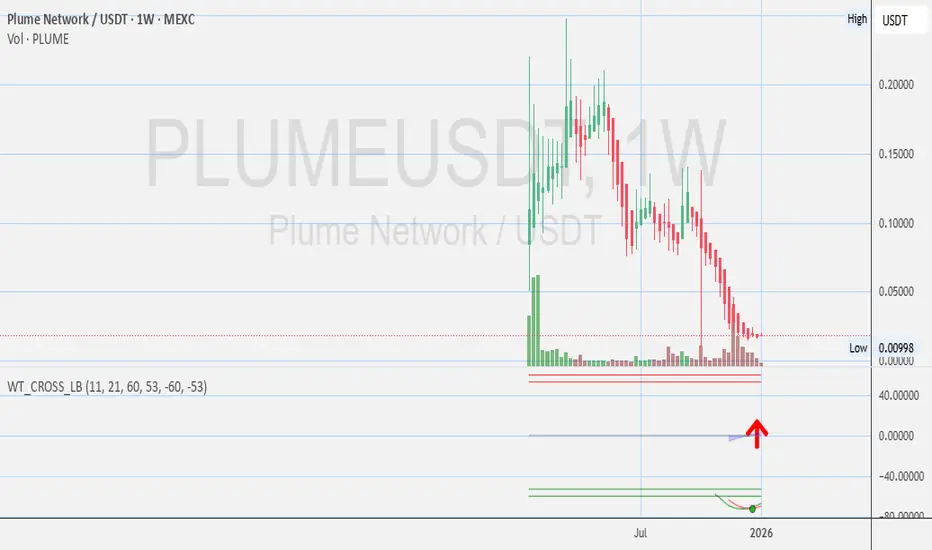
PLUME - Weekly Chart🧠 Keep it on watch. Momentum shifting.
PLUME RWA - Is it finally time for some WEEKLY GREEN candles? Opinions?
Lets share any opinions
⚠️ Disclosures:
This analysis is for informational purposes only and is not financial advice. It does not constitute a recommendation to buy, sell, or trade any securities, cryptocurrencies, or stocks. Trading involves significant risk, and you should consult with a qualified financial advisor before making any investment decisions. Past performance is not indicative of future results.
PLUMEUSDT 1D#PLUME is moving inside a symmetrical triangle on the daily chart. It has broken above the daily EMA100 and is now heading toward the triangle resistance. In case of a breakout above it, the potential upside targets are:
🎯 $0.01777
🎯 $0.02332
🎯 $0.02781
🎯 $0.03230
🎯 $0.03868
🎯 $0.04682
⚠️ Always use a tight stop-loss and maintain proper risk management.
$PLUME loading at support… next move decides everythingBINANCE:PLUMEUSDT is currently retraceing to a well-defined support zone ($0.01147 – $0.01111) after a corrective move from recent highs.
Price now is attempting to reclaim short-term momentum after tapping lower Bollinger Band support.
Key Observations:
• Strong demand zone holding multiple times
• Price attempting bounce from support
• Volatility contraction after pullback (potential expansion coming)
• EMA acting as dynamic resistance for now
📍 Trade Levels:
Entry: $0.01148
Target 1: $0.01269
Target 2: $0.01398
Stop Loss: $0.01098
Bullish Scenario:
If support holds and price reclaims the mid-BB/EMA zone, expect continuation toward $0.01269, with further expansion toward $0.01398.
🧠 Bias:
Bullish while holding demand zone — looking for a bounce + momentum shift.
Plume Network · Dumb bears vs the Altcoins Master (Guru Ananda) You know, it doesn't really matter if 100% of the futures accounts are bearish, it doesn't mean anything to me and to you. It doesn't mean the market will crash for sure.
If the majority of traders are bearish and piling up billions of dollars worth of shorts, knowing what we know, it simply reveals that all these people are about to incur a huge loss.
It doesn't really matter what the majority has to say. Technical analysis is not about a majority, being right is not about following the herd, the crowd—Crypto is going up.
It is unavoidable because it is already happening.
I have all these people arguing with me, telling me that I am wrong. I cannot be wrong, I am the Master of the charts.
Right or wrong is not decided by you, your thinking, your comments or your believes. It is decided by the market, I share what I see.
You have your point of view and I have mine. You say what you think and I continue to translate the charts—the market will take care of the rest.
You can be 100% bearish and trust me, I do not care. Crypto is going up. Bitcoin has been growing for months.
My analysis says the market will continue rising. You? You are trading based on emotions. You are making predictions based on assumptions. You are wrong.
Bitcoin is going up. As Bitcoin continues to rise, it will lift PLUMEUSDT higher and all the other altcoins. It is not hard to see and predict because it has been happening for months, many months.
Three months already the crash ended, it is not hard.
So, are you going to show up right now, in this present moment in time, in late April 2026 and join the bullish train?
Are you going to remain stuck in a bearish wave that ended so long ago?
Why would you argue with me?
Why would you read this post?
If you cannot see what I see, you are just dumb.
I am sorry, this is not an insult, it is a statement of facts. Each post, each publication comes with a chart. My analysis cannot be invalidated, it is already too late.
Either you accept what I am saying and join reality, or you are going to lose once more, you will lose again.
We are LONG. The market is going up.
Would you like to bet?
Hahahahahah!
Thank you for reading.
Your continued support is highly appreciated.
Namaste.
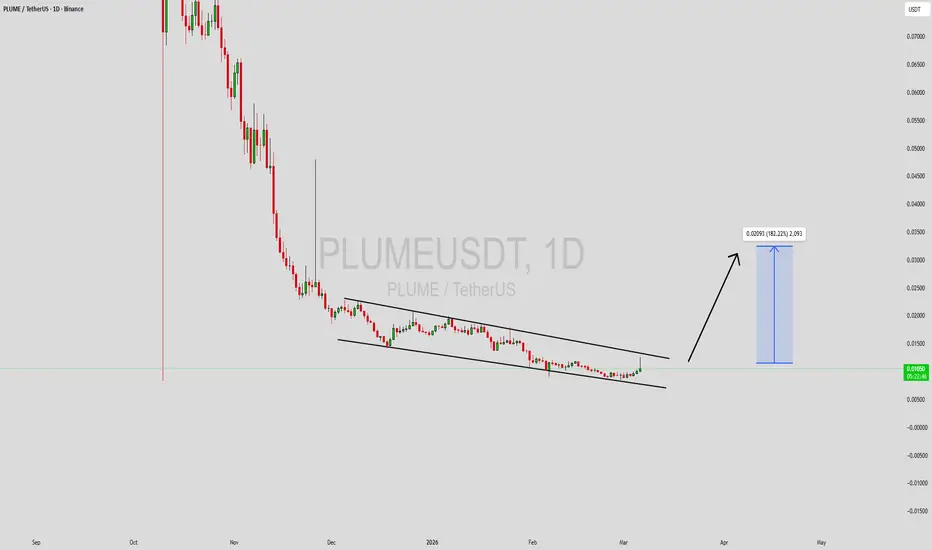
PLUMEUSDT Forming Falling WedgePLUMEUSDT is forming a clear falling wedge pattern, a classic bullish reversal signal that often indicates an upcoming breakout. The price has been consolidating within a narrowing range, suggesting that selling pressure is weakening while buyers are beginning to regain control. With consistent volume confirming accumulation at lower levels, the setup hints at a potential bullish breakout soon. The projected move could lead to an impressive gain of around 190% to 200% once the price breaks above the wedge resistance.
This falling wedge pattern is typically seen at the end of downtrends or corrective phases, and it represents a potential shift in market sentiment from bearish to bullish. Traders closely watching PLUMEUSDT are noting the strengthening momentum as it nears a breakout zone. The good trading volume adds confidence to this pattern, showing that market participants are positioning early in anticipation of a reversal.
Investors’ growing interest in PLUMEUSDT reflects rising confidence in the project’s long-term fundamentals and current technical strength. If the breakout confirms with sustained volume, this could mark the start of a fresh bullish leg. Traders might find this a valuable setup for medium-term gains, especially as the wedge pattern completes and buying momentum accelerates.
✅ Show your support by hitting the like button and
✅ Leaving a comment below! (What is your opinion about this Coin?)
Your feedback and engagement keep me inspired to share more insightful market analysis with you!
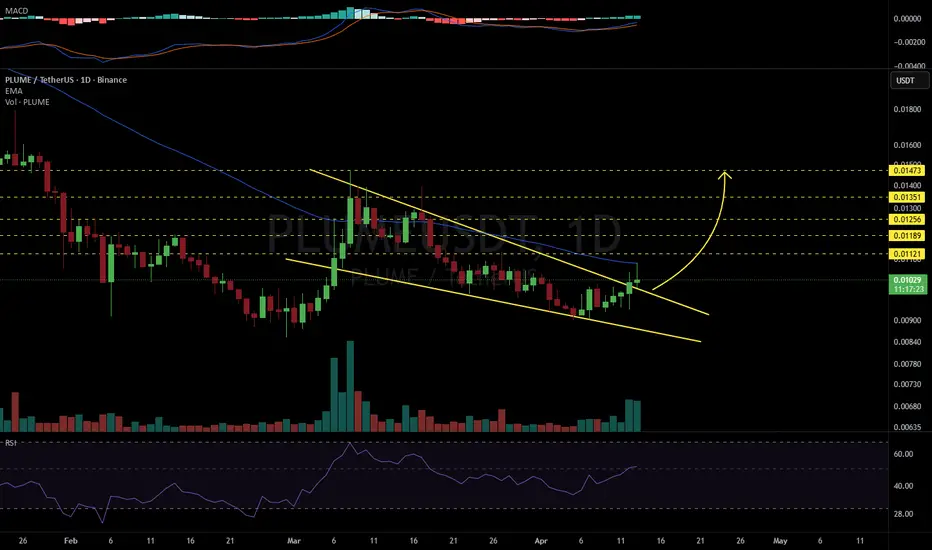
PLUMEUSDT 1D#PLUME has broken above the falling wedge pattern on the daily chart and was rejected from the EMA50. A retest is currently in progress; in case of a successful bounce, the potential targets are:
🎯 $0.01121
🎯 $0.01189
🎯 $0.01256
🎯 $0.01351
🎯 $0.01473
⚠️ Always remember to use a tight stop-loss and maintain proper risk management.
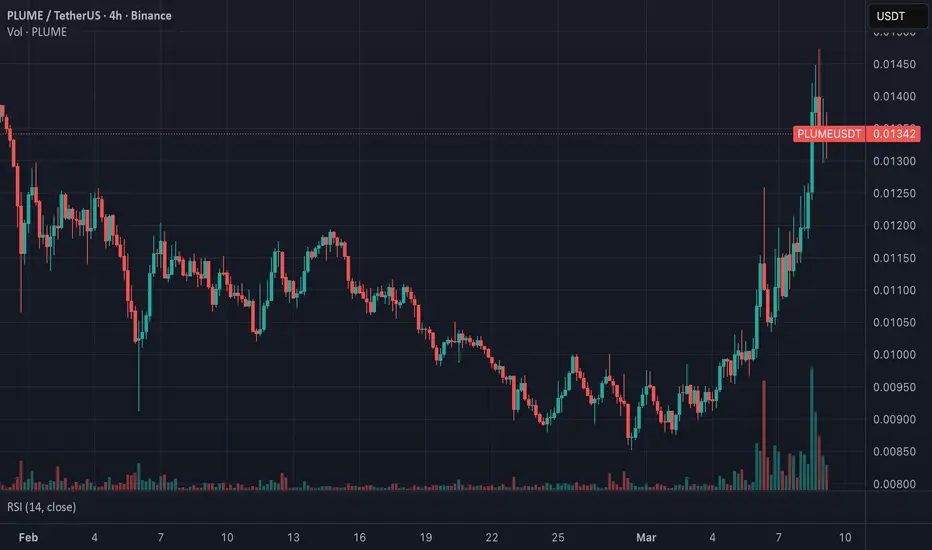
PLUME/USDTPLUME approaching a fragile structure zone
Most traders try to predict the next move.
But the real edge often comes from recognizing when the market has not decided yet.
Right now PLUME is trading near 0.0134 in what can be described as a mixed structural regime.
The broader bias still leans upward, but the alignment across timeframes is not fully confirmed.
Current structure shows:
• 1H structure remains intact
• 4H structure is still unclear
• Price is holding above MA200 on 1H and 4H
• Higher timeframe trend (1D) has not fully aligned yet
This usually signals a borderline environment, where continuation is possible but confirmation becomes critical.
What the market is deciding now
Markets in this state typically resolve in one of two ways:
• Structure stabilizes above support → continuation becomes more probable
• Loss of support or repeated closes below MA200 → deeper rotation
Neither scenario is confirmed yet.
Which means risk management matters more than prediction.
Practical approach for traders
Instead of forcing a trade, focus on confirmation.
Two practical options:
Conservative approach
Wait for the market to show stability above support and maintain structure on the 4H timeframe.
This increases the probability that the bullish bias will continue.
Active approach
If you participate here, position sizing should remain small until structure becomes clearer.
Risk trigger to watch
If PLUME prints 2–3 consecutive 4H closes below MA200
or breaks the current support structure,
the bullish scenario weakens significantly.
The key takeaway
Not every market condition is a trading opportunity.
Sometimes the best decision is waiting for the structure to confirm.
Patience around structure often protects capital better than trying to anticipate the move.
PLUMEUSDT Forming Falling WedgePLUMEUSDT is forming a clear falling wedge pattern, a classic bullish reversal signal that often indicates an upcoming breakout. The price has been consolidating within a narrowing range, suggesting that selling pressure is weakening while buyers are beginning to regain control. With consistent volume confirming accumulation at lower levels, the setup hints at a potential bullish breakout soon. The projected move could lead to an impressive gain of around 140% to 150% once the price breaks above the wedge resistance.
This falling wedge pattern is typically seen at the end of downtrends or corrective phases, and it represents a potential shift in market sentiment from bearish to bullish. Traders closely watching PLUMEUSDT are noting the strengthening momentum as it nears a breakout zone. The good trading volume adds confidence to this pattern, showing that market participants are positioning early in anticipation of a reversal.
Investors’ growing interest in PLUMEUSDT reflects rising confidence in the project’s long-term fundamentals and current technical strength. If the breakout confirms with sustained volume, this could mark the start of a fresh bullish leg. Traders might find this a valuable setup for medium-term gains, especially as the wedge pattern completes and buying momentum accelerates.
✅ Show your support by hitting the like button and
✅ Leaving a comment below! (What is your opinion about this Coin?)
Your feedback and engagement keep me inspired to share more insightful market analysis with you!
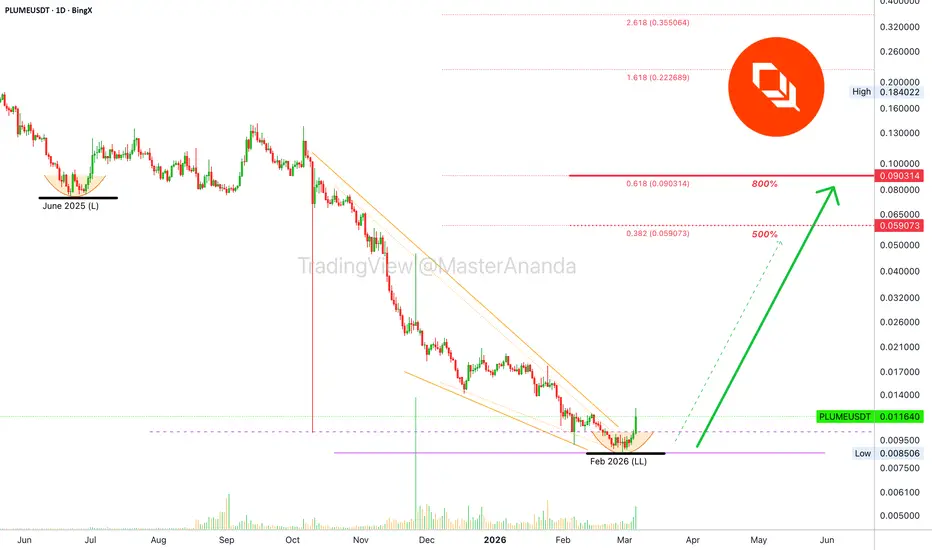
Plume: Simple vs powerful chart setupHere is simplicity at its best. PLUMEUSDT was moving within an ending diagonal, produced a rounded bottom and now a full bullish breakout to start a change of trend.
A bullish bias is fully confirmed as the breakout is a recovery above the October 2025 low. This is a powerful combination of signals.
Let me show you how a strong double bullish divergence works to predict an upcoming change of trend.
PLUMEUSDT going bullish at this juncture supports the rest of the market, and a continuation for Bitcoin.
PLUME daily RSI
›› Notice how the RSI first produces a double-bottom, then a very strong bullish divergence and finally an entrance within the bullish zone (above 50).
›› The RSI hit bottom in June 2025. PLUME continued lower, much lower. This is the divergence. Higher low on the RSI (June 2025 vs Feb 2026) vs lower low on PLUME (Feb 2026 vs June 2025).
PLUME daily MACD
›› Notice how the MACD hits bottom June 2025, a long time ago. The higher low came in November last year and now it continues to rise higher. (Bullish divergence.)
›› Notice how the MACD is still within the bearish zone but trending up for more than half a year. When it looks like this, I read it as: There is plenty of room left available for additional growth.
Conclusion
Here we have a very strong combination of bullish signals. A bullish divergence with the MACD as the RSI becomes super strong. A bullish breakout happening after an all-time low. Recovery above the October 2025 low and the same bearish chart from which many pairs are starting to grow.
We can also appreciate how the 6-February low isn't the true bottom, PLUME went even lower and this is true for many other trading pairs. The conclusion to take home is the fact that this lower low in late February doesn't change the chart structure, it is equivalent to a double-bottom based on a simple liquidity hunt event.
This chart supports a bullish market. A volume breakout is also happening today. Today's session is likely to end with the highest volume since late November 2025 and this will support the bullish wave that follows.
Bitcoin will also grow. And many projects with a similar chart will wake up.
Namaste.
PLUME is down 85% over the last three months.🧠 Keep it on watch. Momentum shifting.
PLUME RWA - Is it finally time for some GREEN candles? Opinions?
Lets share any opinions
⚠️ Disclosures:
This analysis is for informational purposes only and is not financial advice. It does not constitute a recommendation to buy, sell, or trade any securities, cryptocurrencies, or stocks. Trading involves significant risk, and you should consult with a qualified financial advisor before making any investment decisions. Past performance is not indicative of future results.
PLUME RWA - Daily Chart Opinions?🧠 Keep it on watch. Momentum shifting.
PLUME RWA - Is it finally time for some GREEN candles? Opinions?
Lets share any opinions
⚠️ Disclosures :
This analysis is for informational purposes only and is not financial advice. It does not constitute a recommendation to buy, sell, or trade any securities, cryptocurrencies, or stocks. Trading involves significant risk, and you should consult with a qualified financial advisor before making any investment decisions. Past performance is not indicative of future results.
PLUME RWA - Is it finally time for some GREEN candles? Opinions?🧠 Keep it on watch. Momentum shifting.
PLUME RWA - Is it finally time for some GREEN candles? Opinions?
Lets share any opinions
⚠️ Disclosures :
This analysis is for informational purposes only and is not financial advice. It does not constitute a recommendation to buy, sell, or trade any securities, cryptocurrencies, or stocks. Trading involves significant risk, and you should consult with a qualified financial advisor before making any investment decisions. Past performance is not indicative of future results.
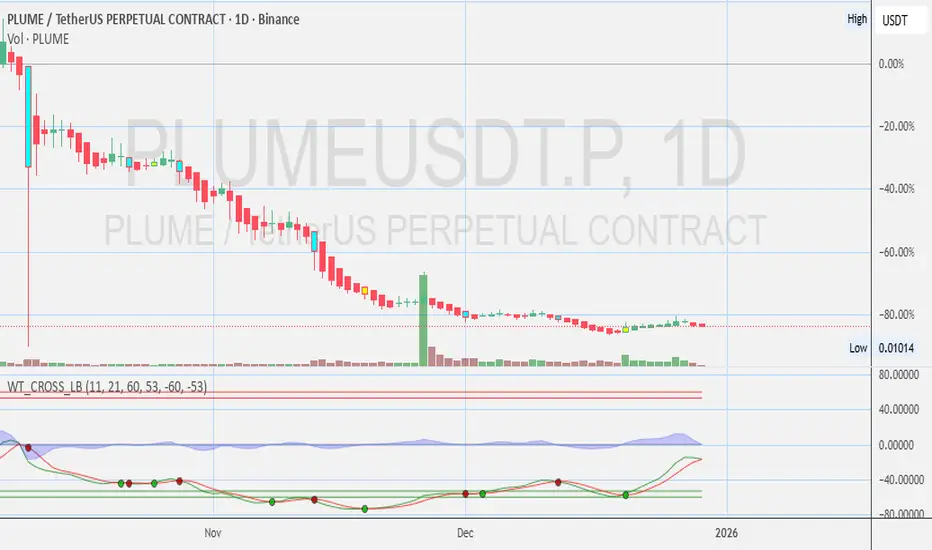
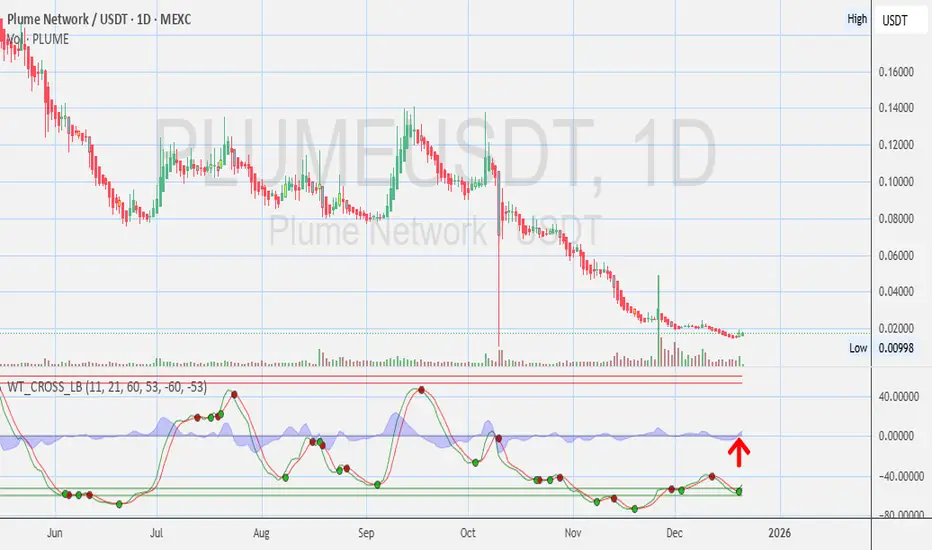
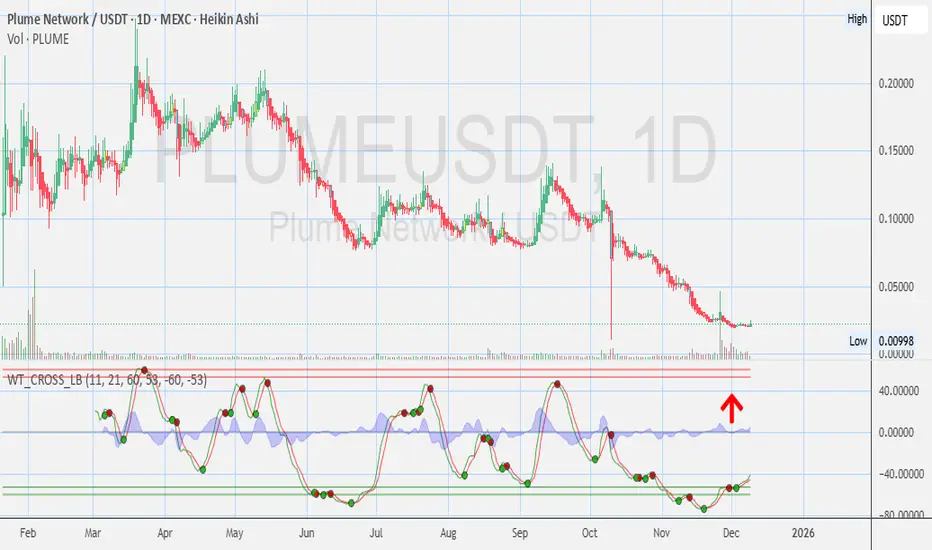
PLUME - WT Cross Signal on Daily Chart - Opinions?🧠 Keep it on watch. Momentum shifting.
Time to see some green candles? Uptrend? or? Opinions?
Lets share any opinions
⚠️ Disclosures :
This analysis is for informational purposes only and is not financial advice. It does not constitute a recommendation to buy, sell, or trade any securities, cryptocurrencies, or stocks. Trading involves significant risk, and you should consult with a qualified financial advisor before making any investment decisions. Past performance is not indicative of future results.
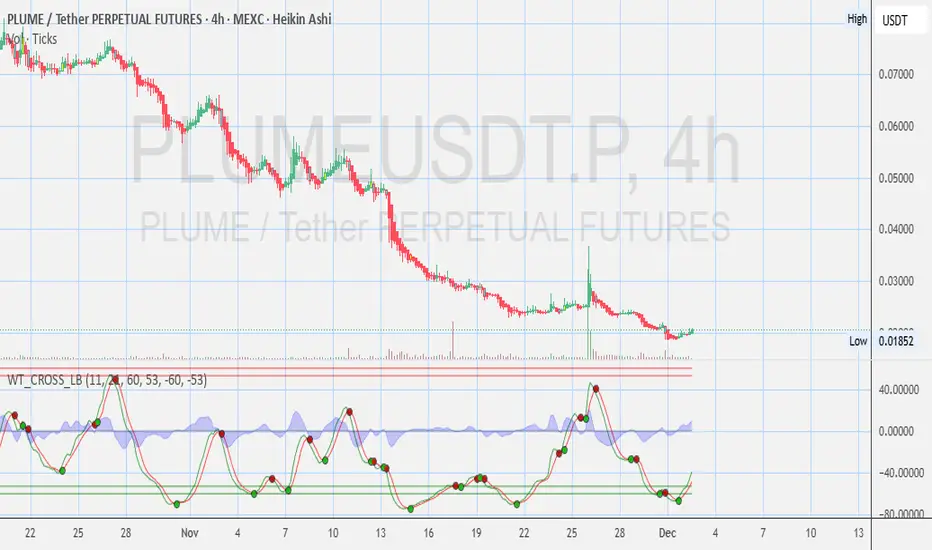
PLUME - 4 Hours Chart Update - CyberMonday Sales ENDED 🧠 Keep it on watch. Momentum shifting.
Time to see some green candles? Uptrend? or? Opinions?
Lets share any opinions
⚠️ Disclosures :
This analysis is for informational purposes only and is not financial advice. It does not constitute a recommendation to buy, sell, or trade any securities, cryptocurrencies, or stocks. Trading involves significant risk, and you should consult with a qualified financial advisor before making any investment decisions. Past performance is not indicative of future results.
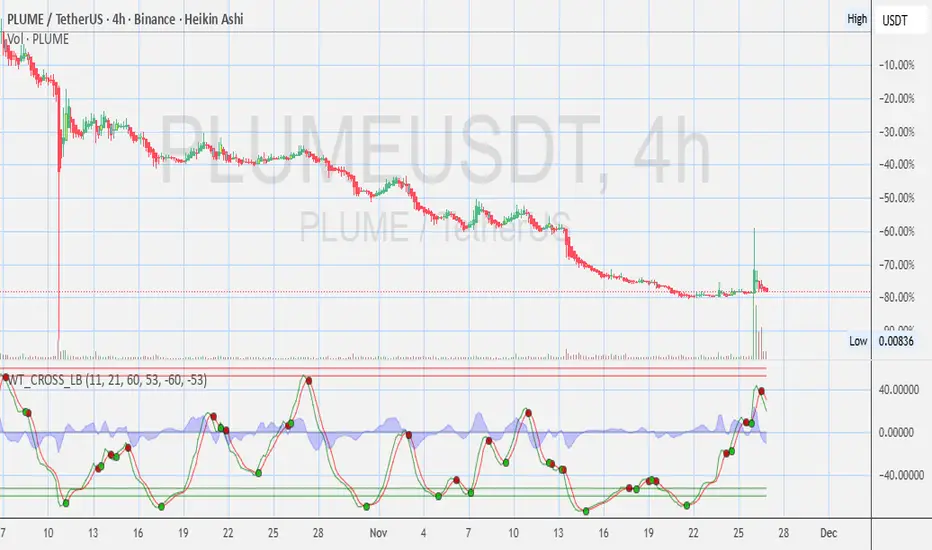
PLUME - 4 Hours Chart --> 80% Down in the last 2 Months 🧠 Keep it on watch. Momentum shifting.
Any Opinions on HUGE VOLUME Yesterday? Time for see some green candles? Uptrend? or?
Lets share any opinions
⚠️ Disclosures :
This analysis is for informational purposes only and is not financial advice. It does not constitute a recommendation to buy, sell, or trade any securities, cryptocurrencies, or stocks. Trading involves significant risk, and you should consult with a qualified financial advisor before making any investment decisions. Past performance is not indicative of future results.
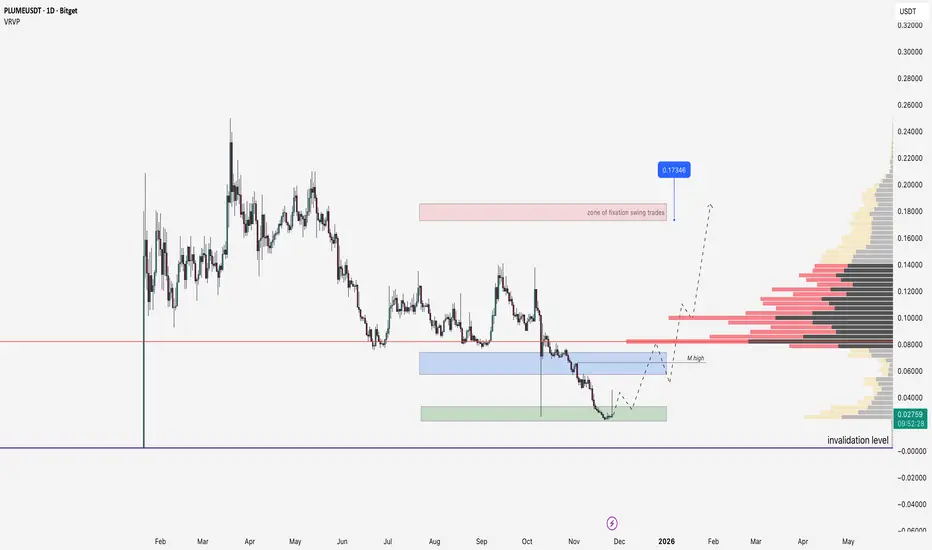
Plume realistic targets! What you should know nowFor BITGET:PLUMEUSDT Im like for all tokens after listing use simple IAP model!
We came to the last zone of interest! If we will not hold now next zone its an invalidation of idea under listing price!
After invalidation all marked boxes will be like resistance!
For now after major today listing price going down because of sellers pressure!
First trouble area and short liquidations will be M high level + around same level we can see the biggest volume!
Swing trade fixation should be based on iap model in swing zones rectangle!
We always move from liquidity to another liquidity! Work with proper money management!
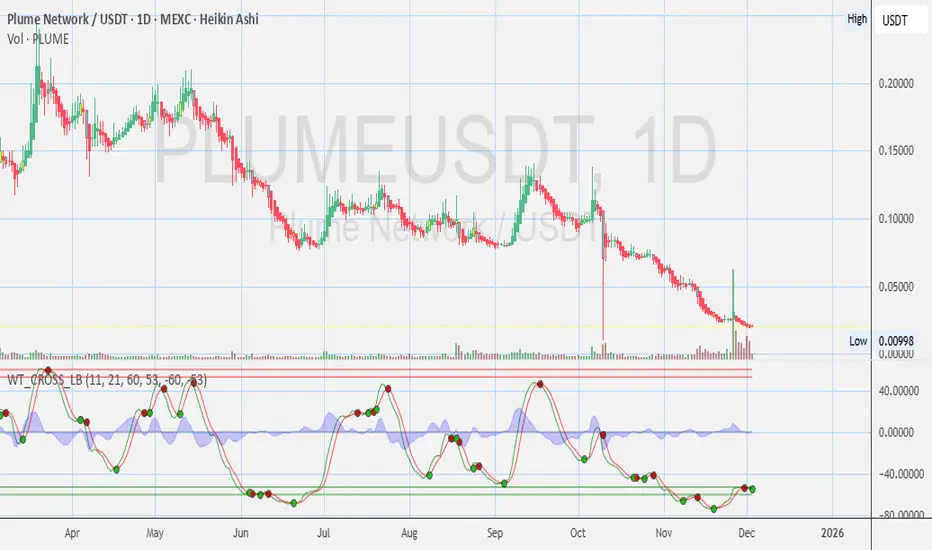
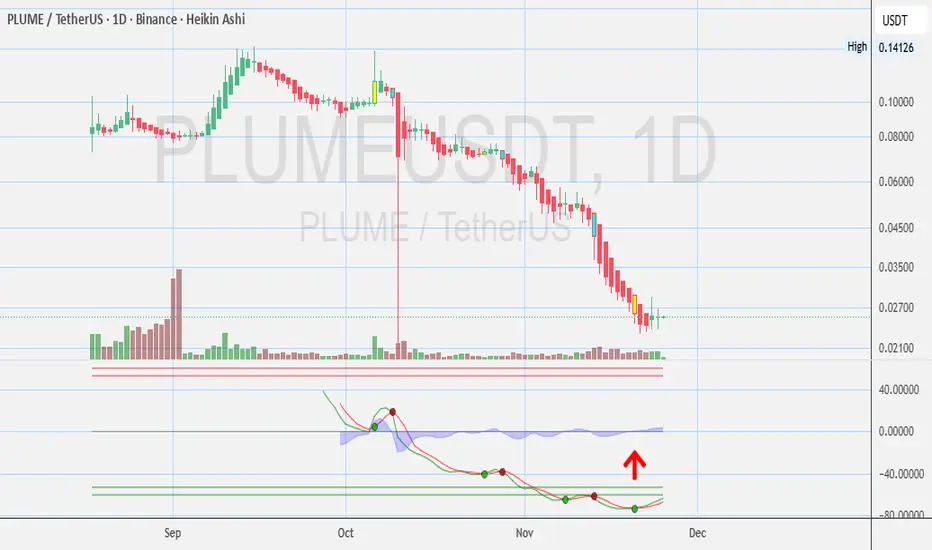
PLUME - Plume Network Daily Chart Update🧠 Keep it on watch. Momentum shifting.
🔥 WT Cross Signal Turning
⚠️ Disclosures :
This analysis is for informational purposes only and is not financial advice. It does not constitute a recommendation to buy, sell, or trade any securities, cryptocurrencies, or stocks. Trading involves significant risk, and you should consult with a qualified financial advisor before making any investment decisions. Past performance is not indicative of future results.