POL IS READY TO EXPLODE…!Yello Paradisers! Are you prepared for a potential sharp move on #POL, or are you still underestimating what’s quietly building behind the scenes? At first glance, this structure might seem like a simple and healthy pullback. But when we strip away emotions and analyse the chart objectively, a completely different narrative emerges. This is not random price action — this is a high-risk, high-opportunity zone where discipline matters far more than opinions.
💎#POL has recently printed a classic selling climax, followed by a climactic action candle supported by ultra-high volume. This is a textbook indication of accumulation. Historically, this exact behaviour appears when smart money begins positioning ahead of a larger move. While subtle to the untrained eye, this probability carries significant weight for experienced traders.
💎#POL has swept the lower trigger line of the selling climax and followed it with a strong momentum candle closing back within that trigger zone. It suggests that weak hands are being forced out, while stronger participants are stepping in with conviction. we have also seen a two-bar reversal forming near the bottom after the selling climax, adding another layer of bullish confluence. The most important level to watch now is just above the high of the climactic action candle. A confirmed breakout, supported by strong momentum, could open the path toward 10500, which stands as a major structural resistance level.
💎#POL continues to respect its descending support trend-line and market momentum is shifting to the bullish side gradually. The recent price action has also formed a potential inverse head-and-shoulders pattern, while the RSI is showing a clear divergence. Together, these confirmations strengthen the probability of bullish scenario, as long as prices maintains momentum inside the order block zone, the structure remains constructive. The first minor resistance level to monitor is 9500.
💎If #POL fails to hold bullish momentum and a momentum candle closes below 6280, the current bullish probability becomes invalid. In that case, we could see further downside pressure.
That is why Paradisers, we are playing it safe right now. If you want to be consistently profitable, you need to be extremely patient and always wait only for the best, highest probability trading opportunities only on confirmations.
MyCryptoParadise
iFeel the success🌴
In-depth trading ideas
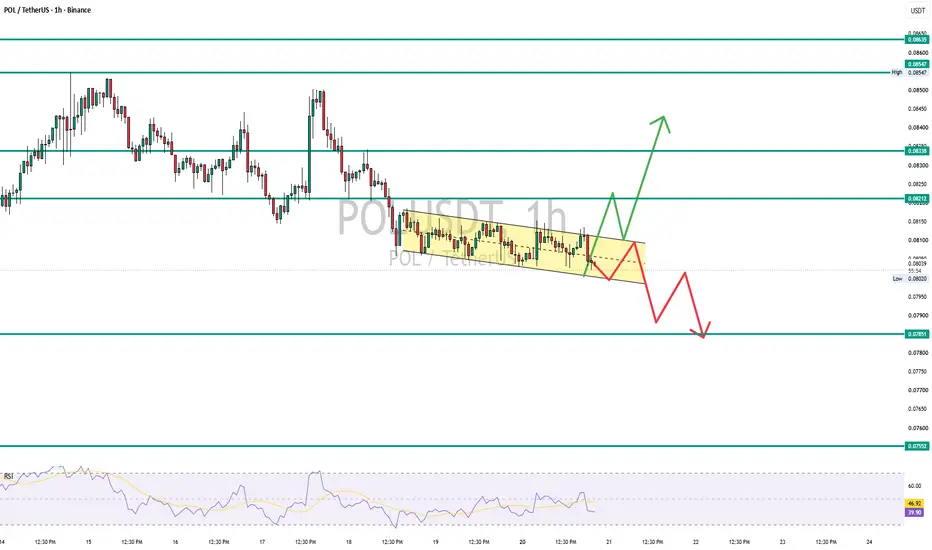
Polygon Price Prediction: POL Near Channel BreakoutPolygon ( BINANCE:POLUSDT ) is trading inside a well-defined descending channel on the 1H timeframe, with price compressing near the lower half of the range. After the recent pullback, volatility has contracted, suggesting a decisive move may be approaching.
The next breakout from this channel is likely to determine the short-term trend.
📊 Market Overview
Asset: Polygon ( PSX:POL )
Pair: POL/USDT
Timeframe: 1H
Current Price: ~$0.08035
Market Structure: Descending Channel (Neutral to Bearish)
RSI: ~39 (Weak Momentum)
24H Change: -0.9%
🔍 Technical Analysis
POL continues respecting both boundaries of the descending channel, showing lower highs while buyers defend the lower trendline.
Although momentum has weakened, price remains above the major support zone, leaving room for either a bullish breakout or another downside leg.
A confirmed breakout with volume could shift market sentiment quickly.
📈 Bullish Scenario
A successful breakout above the descending channel would invalidate the short-term bearish structure.
Bullish Targets
🎯 $0.08212
🎯 $0.08338
🎯 $0.08547
🎯 $0.08635
📉 Bearish Scenario
Failure to hold the lower boundary may accelerate selling pressure.
Bearish Targets
🎯 $0.07851
🎯 $0.07552
🔑 Key Levels
Resistance
$0.08212
$0.08338
$0.08547
$0.08635
Support
$0.07851
$0.07552
💡 Trading Insight
POL is approaching a decision zone where patience is likely to be rewarded. Instead of anticipating direction, traders should wait for confirmation.
Bullish Confirmation: Hourly close above the descending channel and $0.08212.
Bearish Confirmation: Breakdown below $0.07851.
Until then, the market remains range-bound inside the channel.
This analysis is for educational purposes only and should not be considered financial advice.
POL USDT LONG SIGNAL# 71 . POL/USDT – Trade Setup (LONG)
📈 Position Type: LONG
🕒 Timeframe: 1 H
📊 Market: Futures
💰 Entry Zone:
0.08445
0.08288
🛑 Stop-Loss:
0.08080
🎯 Take-Profit Targets:
• TP1: 0.08613
• TP2: 0.08796
• TP3: 0.08984
• TP4:
TP5:
TP6:
⚙️ Leverage:
5- 10
⚠️ After reaching TP1, move Stop-Loss to Entry Price.
📌 Risk Management:
Risk only 1–2% of your capital per trade.
Always confirm the setup on your chart before entry
Polygon (POL) to print Green Quarter 1, 2026 - February 26The above 3 day chart identifies a number of resistances, the first two are expected to be tested before mid-April 2026.
Following the 50% correction from early January, price action now finds itself on past support, 10 cents. Isn’t it fascinating sellers selling into support after a 50% correction? That’s emotion for you.
The 2nd resistance shall be the most challenging. If it breaks and confirms support, expect the full Elliott wave structure to print by July.
The resistances are a combination of market structures as identified from higher timeframes and significant Fibonacci levels. Confluence is the super power of TA, rather than an influencer on Youtube blurbing the next FED meeting dates.
Is it possible price action continues to correct? Sure.
Is it probable? To be technical, 10% at this time.
Ww
=====================================
Disclaimer
You know what’s coming. This isn't advice. I'm not your financial advisor, just some idiot who drew a line on a screen. Cryptocurrency is a famously sensible and stable marketplace for wise, stable people. Obviously.
Polygon could moon. It could also become a digital ghost town where your money haunts a blockchain graveyard. I don't know. I'm just here for the colourful squiggles. If you bet your rent on this and lose it, that's your tragic sitcom. I won't be playing the laugh track.
Do your own research. Don't be a plum.
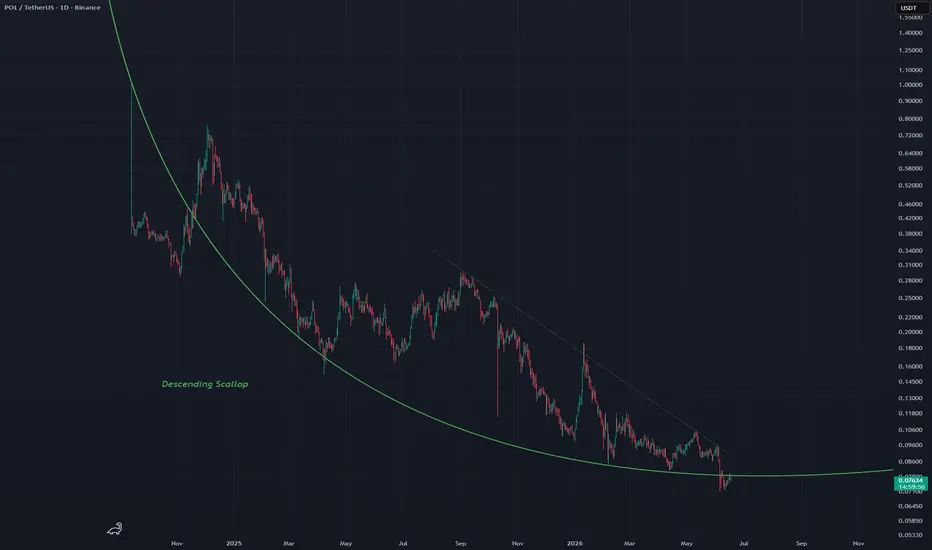
POLUSDT 1D#POL is moving inside a falling wedge pattern on the daily chart.
In case of a breakout above the wedge resistance and the daily EMA50, the potential upside targets are:
🎯 $0.07929
🎯 $0.08594
🎯 $0.09132
🎯 $0.09670
🎯 $0.10435
🎯 $0.11410
⚠️ Always remember to use a tight stop-loss and maintain proper risk management.
POLUSDT Approaching a Key Support ZonePOLUSDT is currently approaching a key support area identified from recent price structure.
Key observations:
• Price is testing an important support zone
• Market participants are watching this area closely
• Confirmation is required before any directional bias
Possible scenarios:
1. Support holds and price rebounds
2. Support breaks and downside continuation follows
This analysis is shared for educational purposes only.
Not financial advice.
Follow for more market analysis.
POL/USDT – Descending Trendline, Breakout or Rejection?On the 3-Day timeframe (3D), POL/USDT remains within a medium-to-long-term downtrend structure, highlighted by a well-defined Descending Trendline originating from the previous peak around $0.27 – $0.29. 📊
📉 This descending trendline has acted as a dynamic resistance multiple times, indicating that sellers have remained in control of price action for several months.
⚡ However, price is now approaching the final stage of the trendline while volatility continues to contract. Conditions like these often signal an accumulation phase before a significant market move.
---
📐 Pattern Formation: Descending Trendline
🧐 What is a Descending Trendline?
A Descending Trendline is a downward-sloping resistance line connecting a series of lower highs.
📌 Pattern Characteristics:
✅ Indicates that selling pressure remains dominant.
✅ Every rally continues to be rejected by sellers.
✅ The closer price gets to the end of the trendline, the greater the potential for a breakout.
✅ A valid breakout is usually confirmed by a candle close above the trendline accompanied by increasing volume.
📍 In this chart, price is testing a lower support zone while approaching the end of the trendline, creating the potential for a breakout within the coming weeks.
---
🟢 Bullish Scenario
✅ Bullish Confirmation Requirements:
🔹 Price successfully breaks and closes above the Descending Trendline.
🔹 Horizontal resistance levels are reclaimed.
🔹 Buying volume increases during the breakout.
🎯 Bullish Targets:
🥇 Target 1: $0.09020
🥈 Target 2: $0.09500
🥉 Target 3: $0.10150
🏆 Target 4: $0.11050
🚀 Major Target: $0.15600
If the breakout is confirmed, the long-standing lower high structure could finally be invalidated, opening the door for a new bullish trend. 📈
💰 A move toward $0.15600 would represent a significant upside opportunity from current price levels.
---
🔴 Bearish Scenario
⚠️ Risks to Watch:
❌ Price fails to break above the trendline.
❌ Strong rejection occurs at trendline resistance.
❌ Selling pressure returns to the market.
🛑 Key Support Levels:
🔸 Minor Support: $0.07960
🔸 Major Support: $0.07091
If $0.07091 is broken to the downside, the bearish structure remains intact and POL may continue searching for lower demand zones. 📉
📌 As long as price remains below the Descending Trendline, buyers have not fully regained control of the market.
---
📊 Conclusion
POL/USDT is currently at a very interesting stage as price approaches the apex of the Descending Trendline that has capped price action since September 2025. ⏳
📌 A breakout above the trendline would be the first signal of a potential market structure shift.
📌 The $0.09020 – $0.11050 area represents a critical resistance zone that must be reclaimed to confirm bullish momentum.
📌 The medium-term target remains around $0.15600 if the breakout is successfully validated.
📌 Conversely, a failed breakout followed by a breakdown below $0.07091 would maintain bearish dominance.
🎯 POL is currently approaching a key decision point that could determine its next major trend direction.
---
⚠️ Disclaimer
📚 This analysis is for educational purposes only and should not be considered financial advice.
💼 Always apply proper risk management before making any trading or investment decisions.
🔎 Do your own research and ensure that your strategy aligns with your personal risk tolerance.
#POLUSDT #POL #Polygon #MATIC #Crypto #Cryptocurrency #TechnicalAnalysis #Altcoins #PriceAction #DescendingTrendline #TrendlineBreakout #BullishSetup #BearishScenario #SupportAndResistance #CryptoTrading #SwingTrading #MarketStructure #BreakoutTrading #AltcoinSeason
POL & the lower low: vs TON, DOGS, NEAR, WLD & BTCThis is one of the projects that stayed behind. In the previous wave, between February and May, I chose several projects for us to trade. Some grew nicely while others did nothing while still others moved lower. There is a huge difference though between those breaking down and those breaking up. Let's compare some of these.
While POLUSDT did very little between Feb-May, BTCUSDT grew 38%—Bitcoin is big. We saw how TON, DOGS, NEAR and WLD grew somewhere between 200-300%, then a correction resulted in a higher low.
While POLUSDT here is showing a lower low, notice the volume and the size of the drop. Here we can see the development of a stop-loss hunt event rather than a bearish impulse, a new correction or downtrend. And this is what confirms a marketwide bullish bias.
While POLUSDT can still move lower (this is all part of the accumulation phase—consolidation at bottom prices), the next major move is a bullish wave, we know this based on the other projects that are moving first. The market is big so not everything can move at the same time. Some tend to lag behind. And that's it.
This is why diversifying is key and another reason why we need to be wise when choosing. Not all chart setups will win, some will miss and that's ok with me.
While a losing trade is always capped at 100%, a winning trade can result in unlimited profits. Some can yield 300% while others can grow 500% or more in a matter of weeks or months. We just need to develop a strategy that works. It takes time and practice but it is worth the effort.
Thanks a lot for your continued support.
Namaste.
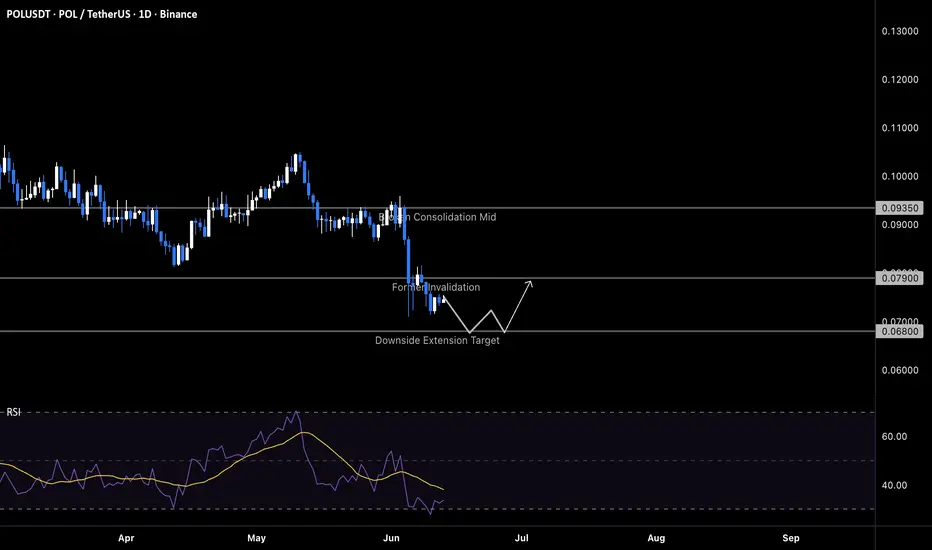
POL: liquidity sweep before bullish reversalThe Macro Picture 🗺️
The June 5 reclaim thesis didn't survive — POL closed below the $0.0790 invalidation, sliced straight through the $0.0750 downside magnet, and printed a capitulation wick into $0.0710 over the past week. What looks like terminal weakness on the surface is structurally the deepest oversold print of the entire 2026 range, with RSI flushed below 30 and price now compressing into a tight band above the swing low. The chart points to one more leg lower — a final flush into the $0.0680 liquidity pocket — as the structural reset that exhausts the move, rather than continuation toward fresh macro lows.
The Setup ⚙️
The Capitulation: The cascade from the $0.0820 floor break through the $0.0790 invalidation and into the $0.0710 wick low is now complete — a full multi-leg unwind that cleared out over-leveraged longs accumulated across the prior range.
The Deeper Sweep: One more flush into the $0.0680 zone would grab the last remaining stop cluster sitting below the swing low and complete the structural reset — the kind of move that punishes late shorts and hands the next leg to patient buyers.
The Reversal Trigger: Reclaiming $0.0790 — the former invalidation level — would flip the bearish narrative, confirm the sweep as a structural low, and trigger buy stops resting above the breakdown candle.
The Roadmap: Primary target sits at $0.0820 — the former macro floor, now the first high-confluence supply test — with extension toward $0.0935 if the broken structure flips back into support. Invalidation: a sustained daily close below $0.0680 would invalidate this reversal thesis and reopen the path toward broader macro lows.
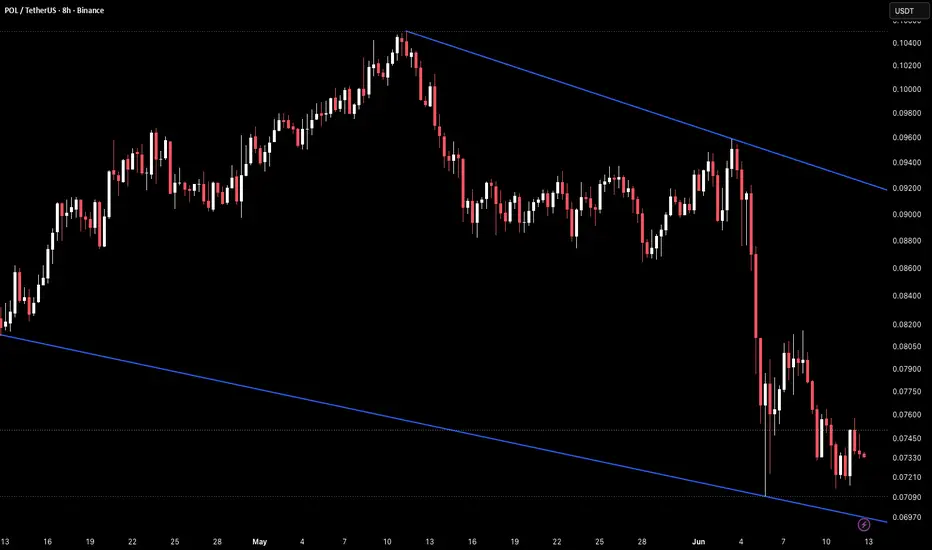
POL 8H – Triangle Breakdown at Lower TrendlinePOL on the 8H timeframe is currently trading around 0.07357 after breaking down sharply through the symmetrical triangle structure that had been compressing price since mid-April, with a descending resistance trendline from the May highs near 0.1040 and a rising support trendline from the April lows near 0.0813.
The breakdown from the triangle in early June was aggressive, dropping price from 0.0940 all the way to a wick low near 0.0709 before a partial recovery brought it back to current levels.
Price is now sitting directly above the lower rising trendline near 0.0697–0.0709, which is the last visible structural support on this chart.
All prior support levels inside the triangle are now overhead resistance.
Key Levels To Watch
0.1040 → Prior spike high, major resistance above
0.0920–0.0960 → Descending resistance trendline, major overhead ceiling
0.0880–0.0900 → Prior range support, now resistance
0.0820–0.0840 → Prior support zone, now resistance
0.0756–0.0760 → Horizontal support, now resistance
0.0709–0.0736 → Current area, above lower trendline
0.0697 → Lower trendline support, final structural floor
Below 0.0697 → Full breakdown, no visible support below
The symmetrical triangle breakdown was a decisive structural event. The lower rising trendline near 0.0697 is now the only remaining structural reference and price is sitting just above it.
A hold above the lower trendline near 0.0697 and a recovery back above 0.0756–0.0760 would be the first sign of stabilization and the minimum requirement for any structural shift.
A confirmed close below 0.0697 and loss of the lower trendline would push price into new low territory with no visible support below 0.0697.
This is the last structural support on this chart.
Hold 0.0697 trendline → stabilization possible, recovery needs reclaim of 0.0756.
Lose 0.0697 → full breakdown, new lows with no structure below.
Structure fully bearish below broken triangle.
Recovery only on confirmed reclaim of 0.0756+.
POL at macro floor: sweep reclaim before bullish pushThe Macro Picture 🗺️
Three weeks after POL set up the bullish thesis above the $0.0820 macro floor, the structure has been tested in textbook fashion: today's vertical wick down to $0.0790 swept the three-month base that held twice since February. This is the kind of liquidity hunt that exhausts late sellers and traps fresh shorts at the worst possible level — a sharp move below an obvious support, followed by the immediate question of whether bulls will defend the reclaim. RSI has flushed toward 30, the deepest oversold print of the entire range, while the broader $0.0820–$0.1050 structure remains intact above today's wick.
The Setup ⚙️
The Sweep: Today's spike to $0.0790 cleared the stop-loss cluster that had built underneath the $0.0820 floor across two prior defenses — a clean liquidity grab that hands accumulating bulls the inventory shorts just released.
The Reclaim: A daily close back above $0.0820 would confirm the fakeout breakdown and flip the structural narrative from continuation to trap-and-reverse, with $0.0790 becoming the new line in the sand.
The Trigger: Reclaiming $0.0935 — the recent consolidation mid — would trigger buy stops above the breakdown candle, shift momentum back toward the range ceiling, and confirm the sweep was structural rather than directional.
The Roadmap: Primary target sits at $0.0935 as the first high-confluence zone, with extension toward $0.1050 if the equilibrium flips into support. Invalidation: a clean daily close below $0.0790 would invalidate this bullish thesis and open the path toward the $0.0750 downside magnet.
$POL Long - Time for RecoverySignal: Long
Price: 0.07916
Technical Analysis
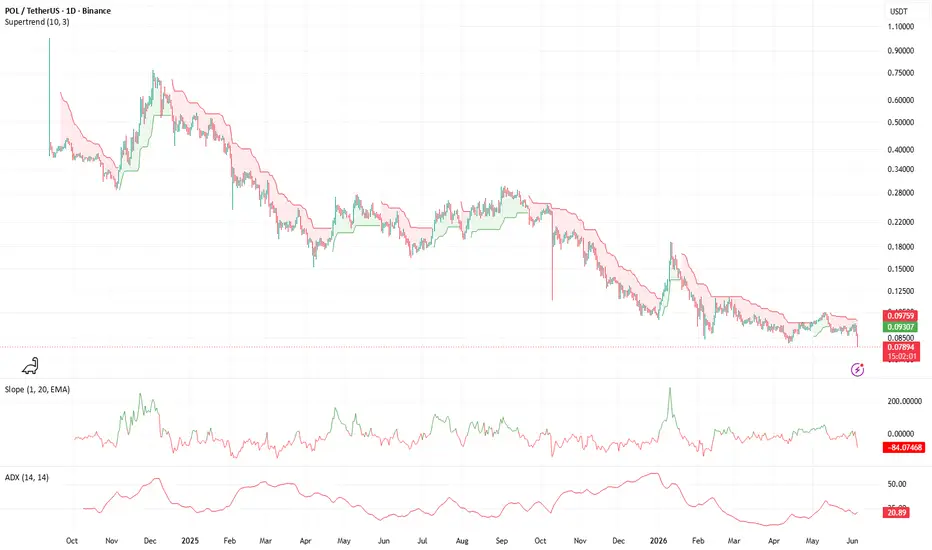
POL is attempting to stabilize after a long downtrend, and the current setup supports a cautious bullish thesis as long as price can defend the recent base. Price is trading near 0.07916 after a sharp red daily candle, but it remains close to the recent support area around the 0.078–0.080 zone, where buyers have previously stepped in. The Supertrend level sits above price near 0.09759, meaning the broader trend has not fully flipped bullish yet, but the market is compressed near lows and may be forming a base. The 20 EMA slope is still negative around -82.61, which shows that momentum remains weak, while ADX near 20.89 suggests trend strength is not extremely dominant. For the bullish thesis to strengthen, POL needs to reclaim the Supertrend and improve the EMA slope; until then, this is a speculative bullish recovery setup rather than a confirmed trend reversal.
Fundamental Analysis
Polygon (POL) continues to stand out as a leading blockchain infrastructure play for global payments, supported by strong network-scale metrics and accelerating stablecoin activity: cumulative transfer volume has reached roughly $2.4 trillion, stablecoin supply has nearly doubled to over $3.4 billion, and the chain has processed more than 7 billion transactions while sustaining 99.99% uptime across five-plus years. Adoption remains a key signal, with a broad ecosystem of 19,000+ dApps, full EVM compatibility that leverages Ethereum’s developer base, and consistently sub-$0.01 fees, alongside notable enterprise usage from major consumer and fintech brands and substantial institutional funding. Near-term focus is on execution of major strategic initiatives—Open Money Stack to streamline fiat-to-onchain rails, AggLayer to unify cross-chain liquidity, and the Gigagas roadmap targeting 100,000+ TPS, building on upgrades already enabling 2,800+ TPS—while POL’s expanding role in staking, governance, and value accrual positions it to benefit as stablecoins, real-world assets, and everyday payments continue moving onchain.
Polygon (POL) Trading at Support: Should I Buy Here?It is not the highest ever nor the highest in a long while. The action is not happening at resistance. POLUSDT is trading at bottom prices while establishing a new support zone. The current range has been active for more than five months, since mid-December 2025.
This is a good spot to buy but there is always risk. Many projects are breaking bullish now, today and in the last few days. Many others are doing nothing and continue sideways. Polygon is no different yet this is a good chart setup for buyers. Accumulation is always possible at support.
There can be another shakeout, one final stop-loss hunt event. A new uptrend is very close though, the next market cycle on Polygon is a bullish one. This project has been bearish for years on end. Once it turns bullish, it can go for a long time. This is a neutral chart with high bullish potential. We buy at support.
Thank you for reading.
Namaste.
Satoshi Frame | Polygon Facing Breakdown RiskWelcome to Satoshi Frame channel.
Polygon has broken its ascending trendline and got rejected from the $0.10456 resistance level before entering a 4-hour range box. A breakout from this box could determine Polygon’s next major move.
If Polygon manages to break above the top of the box, the price could rally toward the 61.8% Fibonacci retracement level. However, if you plan to enter a trade, use only 0.25% risk management since buying volume has dropped significantly and the breakout could be fake.
Losing the bottom of the box at the $0.08912 support level could trigger further downside toward the weekly support at $0.08166.
The DMI indicator suggests that a strong move may be approaching. Meanwhile, the RSI overbought level stands at 60.34, while the oversold level is at 32.68.
Risk management and capital management are essential in trading. Always trade based on your own strategy and risk tolerance. Every trading decision and its outcome are entirely your own responsibility.
May 4, 2026 POL. The time to go long has come.- Exchange: Bitget
- Instrument: BITGET:POLUSDT
- Timeframe: Weekly
- Trade type: Buy stop order
- Price: 0.0980
- Take Profit: Open
- Stop Loss: 0.0897 (-8.40 %)
Idea: Long on a breakout above last week's high — bullish momentum continuation.
Entry: Buy stop above last week’s high.
Stop-loss: Below the low of the same candle. A pullback below this level invalidates the trade.
Take Profit: Trailing stop following the lows of new weekly candles.
This is not an individual investment recommendation.
POL 6H – Sharp Pullback Into Trendline & Horizontal SupportPOL on the 6H timeframe is currently trading around 0.0917 after a sharp sell-off from the high near 0.1040 that broke through multiple support levels and brought price all the way back toward the rising trendline from the late April lows and a horizontal support zone near 0.0910–0.0917.
The sell-off was aggressive and fast, with very little recovery during the move down. Price briefly undercut the rising trendline near 0.0885 before recovering back above it, leaving a wick below and suggesting buyers stepped in at the trendline.
Key Levels To Watch
0.1040 → Prior high, major resistance above
0.1000–0.1020 → Prior support zone, now resistance
0.0960–0.0980 → Prior consolidation zone, now resistance
0.0910–0.0917 → Horizontal support, current zone
0.0885 → Rising trendline support (dynamic, declining slightly)
Below 0.0845 → Full structure breakdown
The trendline wick recovery is an early sign that buyers are defending the level, but price needs to hold above 0.0910 on a closing basis to confirm stabilization.
A hold above 0.0910 and a recovery back above 0.0960 would suggest the sell-off is exhausted and open room toward 0.1000–0.1020.
A break below 0.0910 and a confirmed close under the trendline near 0.0885 would invalidate the recovery and open room toward 0.0845 and below.
This is a post-selloff stabilization test.
Hold 0.0910 and trendline → recovery possible, eyes on 0.0960–0.1000.
Lose 0.0885 trendline → breakdown confirmed, deeper downside opens.
Neutral at current levels.
Bias only on confirmed hold or trendline breakdown.
POL: liquidity sweep before bullish moveThe Macro Picture 🗺️
After January's vertical spike to $0.1900 absorbed late sellers and unwound in textbook fashion, POL settled into a 3.5-month accumulation range between $0.0820 and $0.1080. The structural detail that matters: April's low at $0.0820 marginally swept the February low at $0.0850 before reversing decisively — a clean liquidity grab that handed accumulating bulls the inventory they were waiting for. The kind of structural reset that sparks powerful reversals. Current price near $0.0950 sits in the upper half of the range with RSI cooling from a push toward 70, releasing momentum without breaking structure.
The Setup ⚙️
The Floor: The $0.0820 macro support is now a confirmed high-confluence zone — defended once in February, swept and reclaimed in April — and every retest has produced a stronger reaction, suggesting patient capital is the marginal buyer here.
The Accumulation Zone: The $0.0820–$0.1080 range has hosted consistent rotation between boundaries with visible buyer footprint near the lows, pointing to accumulation rather than late-cycle distribution.
The Trigger: A clean daily break and hold above the $0.1080 local high would confirm the range resolution, trigger buy stops resting above the multi-month ceiling, and shift the structure from horizontal compression to vertical expansion.
The Roadmap: Primary target sits at $0.1200 — the next high-confluence zone into the prior breakdown shelf, where sellers will likely defend before any deeper recovery toward $0.1400. Invalidation: a clean daily close below $0.0820 would invalidate this bullish thesis and reopen the path toward fresh macro lows.
POL 4H – Riding Rising Trendline to New HighsPOL on the 4H timeframe is currently trading around 0.1017 after a strong and consistent rally that has been guided by a rising trendline from the April 12 lows, pushing price to a new high near 0.1040+ on this chart.
The trendline has been respected on every pullback throughout April and into May, producing higher lows consistently and accelerating price higher. The structure is clean with no significant breakdowns along the way.
Price is now pulling back slightly from the recent high and sitting just above the 0.1000–0.1017 zone, which is the first key horizontal level on this chart.
Key Levels To Watch
0.1040+ → New high, no visible resistance above on this chart
0.1017 → Current price, key psychological and horizontal level
0.1000 → Psychological support, prior reaction zone
0.0980–0.0990 → Rising trendline support (dynamic, climbing)
0.0940–0.0960 → Prior consolidation zone, stronger support below
Below 0.0813 → Full structure breakdown
The rising trendline has been the backbone of this entire move and has not been seriously threatened at any point. Every dip toward the trendline has been quickly absorbed and followed by a continuation higher.
A hold above 0.1000 and the trendline near 0.0980–0.0990 would keep the structure intact and set up a continuation toward new highs above 0.1040.
A break below the trendline near 0.0980 would be the first sign of structural weakness and shift focus toward 0.0940–0.0960 as the next support.
Structure fully bullish above rising trendline.
Hold 0.1000 and trendline → continuation toward 0.1040+.
Lose trendline at 0.0980 → first structural warning, eyes on 0.0940–0.0960.
Bullish structure intact above rising trendline.
Bias shifts only on confirmed trendline breakdown.
Is it time to break out the bearish channel?We are approaching a important support and resistance zone of $0.1050 cents to $0.1150 cents. Breaking above this zone and closing daily and weekly candles will confirm a break out the bearish channel which is good news for the longterm and then our next target will be 29 cents.
Will we break out the de-cending channel?In my opinion we are approaching a major resistance zone making $0.1050 and $11.50 region very important to break and close above which will also confirm a break out of the bearish channel for the next target of 29 cents. But ether way breaking out the channel is good
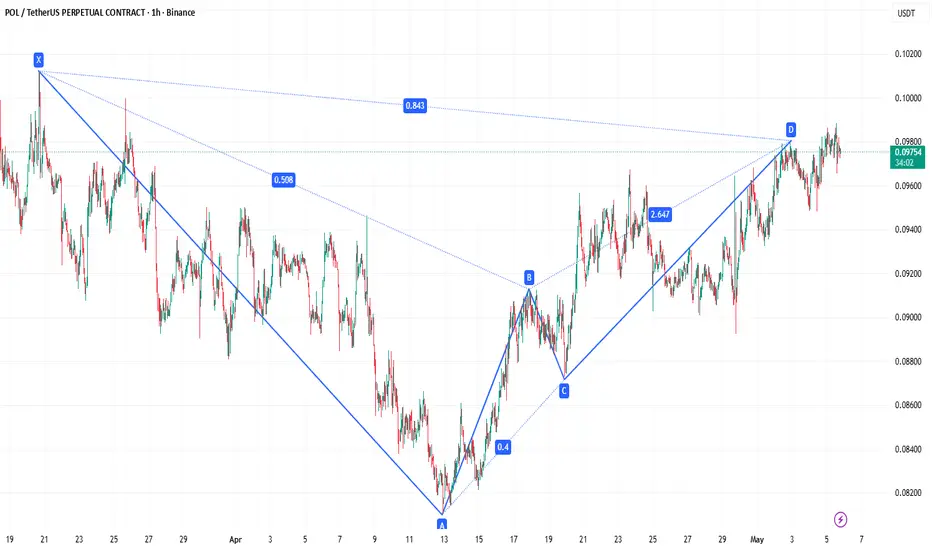
POLUSDT – Bullish Bat Pattern (1H)Structure:
X → A: 0.08600 → 0.10200 (impulse leg)
A → B: Retrace to ~0.09250–0.09400 (0.382–0.500 of XA)
B → C: Retrace to ~0.09780–0.09820 (0.382–0.886 of AB)
C → D (PRZ): 0.886 retrace of XA → 0.08800–0.08900
Current Status:
Price is at 0.09754, still above PRZ. Pattern not yet completed.
Why this is a valid Bat (not another harmonic):
B is within 0.382–0.500 of XA → eliminates Gartley (requires 0.618)
D targets 0.886 of XA → eliminates Butterfly (requires 1.27–1.618)
0.886 retrace is the defining ratio of a Bat per Carney's definition
PRZ is tight → reduces false signal risk
Confirmation needed:
Price to enter 0.08800–0.08900
Bullish reversal signal (hammer, engulfing, or RSI divergence)