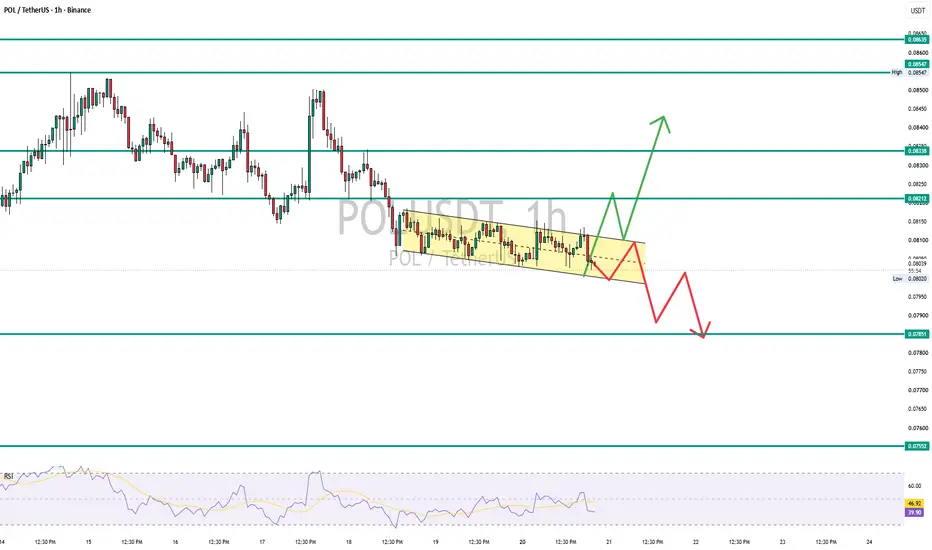
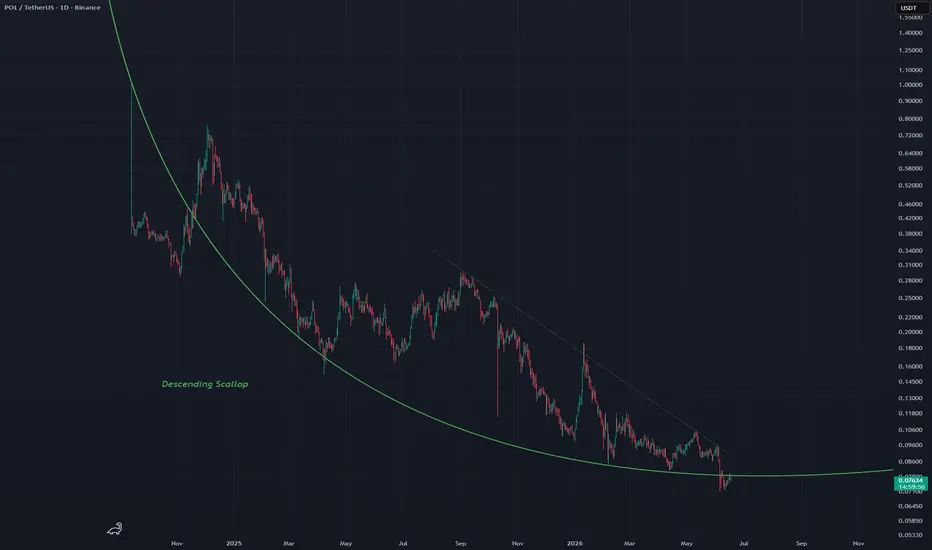
POL IS READY TO EXPLODE…!Yello Paradisers! Are you prepared for a potential sharp move on #POL, or are you still underestimating what’s quietly building behind the scenes? At first glance, this structure might seem like a simple and healthy pullback. But when we strip away emotions and analyse the chart objectively, a compl
Compare with POL/USDT
Polygon Price Prediction: POL Near Channel BreakoutPolygon ( BINANCE:POLUSDT ) is trading inside a well-defined descending channel on the 1H timeframe, with price compressing near the lower half of the range. After the recent pullback, volatility has contracted, suggesting a decisive move may be approaching.
The next breakout from this channel is l
Polygon (POL) to print Green Quarter 1, 2026 - February 26The above 3 day chart identifies a number of resistances, the first two are expected to be tested before mid-April 2026.
Following the 50% correction from early January, price action now finds itself on past support, 10 cents. Isn’t it fascinating sellers selling into support after a 50% correction
POLUSDT 1D#POL is moving inside a falling wedge pattern on the daily chart.
In case of a breakout above the wedge resistance and the daily EMA50, the potential upside targets are:
🎯 $0.07929
🎯 $0.08594
🎯 $0.09132
🎯 $0.09670
🎯 $0.10435
🎯 $0.11410
⚠️ Always remember to use a tight stop-loss and maintain prop
POLUSDT Approaching a Key Support ZonePOLUSDT is currently approaching a key support area identified from recent price structure.
Key observations:
• Price is testing an important support zone
• Market participants are watching this area closely
• Confirmation is required before any directional bias
Possible scenarios:
1. Support hold
POL/USDT – Descending Trendline, Breakout or Rejection?On the 3-Day timeframe (3D), POL/USDT remains within a medium-to-long-term downtrend structure, highlighted by a well-defined Descending Trendline originating from the previous peak around $0.27 – $0.29. 📊
📉 This descending trendline has acted as a dynamic resistance multiple times, indicating that
POL & the lower low: vs TON, DOGS, NEAR, WLD & BTCThis is one of the projects that stayed behind. In the previous wave, between February and May, I chose several projects for us to trade. Some grew nicely while others did nothing while still others moved lower. There is a huge difference though between those breaking down and those breaking up. Let
See all ideas
Summarizing what the indicators are suggesting.
Oscillators
Neutral
SellBuy
Strong sellStrong buy
Strong sellSellNeutralBuyStrong buy
Oscillators
Neutral
SellBuy
Strong sellStrong buy
Strong sellSellNeutralBuyStrong buy
Summary
Neutral
SellBuy
Strong sellStrong buy
Strong sellSellNeutralBuyStrong buy
Summary
Neutral
SellBuy
Strong sellStrong buy
Strong sellSellNeutralBuyStrong buy
Summary
Neutral
SellBuy
Strong sellStrong buy
Strong sellSellNeutralBuyStrong buy
Moving Averages
Neutral
SellBuy
Strong sellStrong buy
Strong sellSellNeutralBuyStrong buy
Moving Averages
Neutral
SellBuy
Strong sellStrong buy
Strong sellSellNeutralBuyStrong buy
Displays a symbol's price movements over previous years to identify recurring trends.
Frequently asked questions
The current price of POLYGON (PREV. MATIC)/TETHERUS (POL) is 0.07351 USDT — it has fallen −0.57% in the past 24 hours. Try placing this info into the context by checking out what coins are also gaining and losing at the moment and seeing POL price chart.
POLYGON (PREV. MATIC)/TETHERUS price has fallen by −3.32% over the last week, its month performance shows a −0.22% decrease, and as for the last year, POLYGON (PREV. MATIC)/TETHERUS has decreased by −63.48%. See more dynamics on POL price chart.
Keep track of coins' changes with our Crypto Coins Heatmap.
POLYGON (PREV. MATIC)/TETHERUS (POL) reached its highest price on Dec 3, 2024 — it amounted to 0.76810 USDT. Find more insights on the POL price chart.
See the list of crypto gainers and choose what best fits your strategy.
POLYGON (PREV. MATIC)/TETHERUS (POL) reached the lowest price of 0.07000 USDT on Jun 29, 2026. View more POLYGON (PREV. MATIC)/TETHERUS dynamics on the price chart.
See the list of crypto losers to find unexpected opportunities.
The safest choice when buying POL is to go to a well-known crypto exchange. Some of the popular names are Binance, Coinbase, Kraken. But you'll have to find a reliable broker and create an account first. You can trade POL right from TradingView charts — just choose a broker and connect to your account.
Crypto markets are famous for their volatility, so one should study all the available stats before adding crypto assets to their portfolio. Very often it's technical analysis that comes in handy. We prepared technical ratings for POLYGON (PREV. MATIC)/TETHERUS (POL): today its technical analysis shows the sell signal, and according to the 1 week rating POL shows the sell signal. And you'd better dig deeper and study 1 month rating too — it's sell. Find inspiration in POLYGON (PREV. MATIC)/TETHERUS trading ideas and keep track of what's moving crypto markets with our crypto news feed.
POLYGON (PREV. MATIC)/TETHERUS (POL) is just as reliable as any other crypto asset — this corner of the world market is highly volatile. Today, for instance, POLYGON (PREV. MATIC)/TETHERUS is estimated as 1.91% volatile. The only thing it means is that you must prepare and examine all available information before making a decision.
You can discuss POLYGON (PREV. MATIC)/TETHERUS (POL) with other users in our public chats, Minds or in the comments to Ideas.