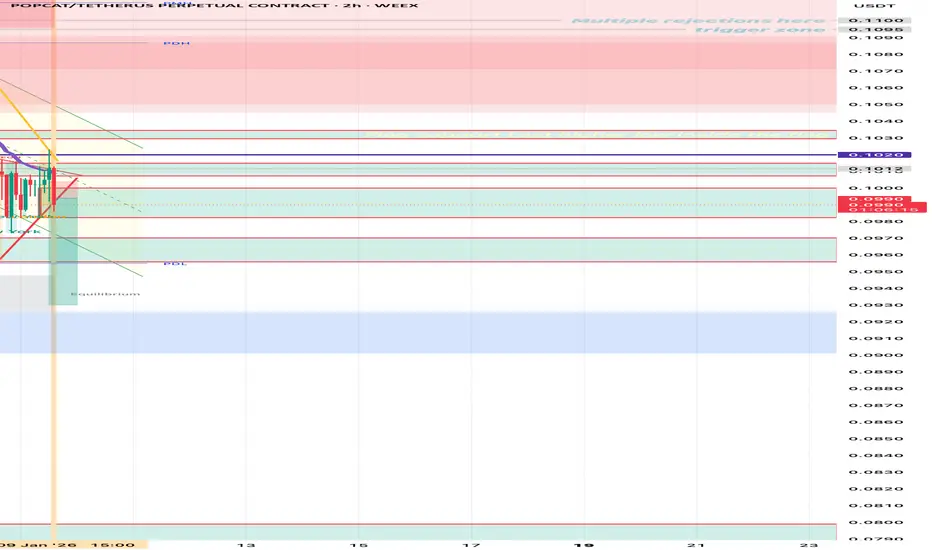
POPCATUSDTPrice is currently in a bearish trend; however, a bullish divergence has formed on the 4H timeframe with the Bullish reversal pattern that is FALLING WEDGE, which could indicate a potential trend reversal.
Confirmation of the reversal would be provided by a breakout above the most recent Lower High (LH).
A Buy Stop order has been placed above the LH to enter the trade upon confirmed breakout.
Further, to keep an eye on the high impact news of USD Funding rate on 16.09.2026
In-depth trading ideas
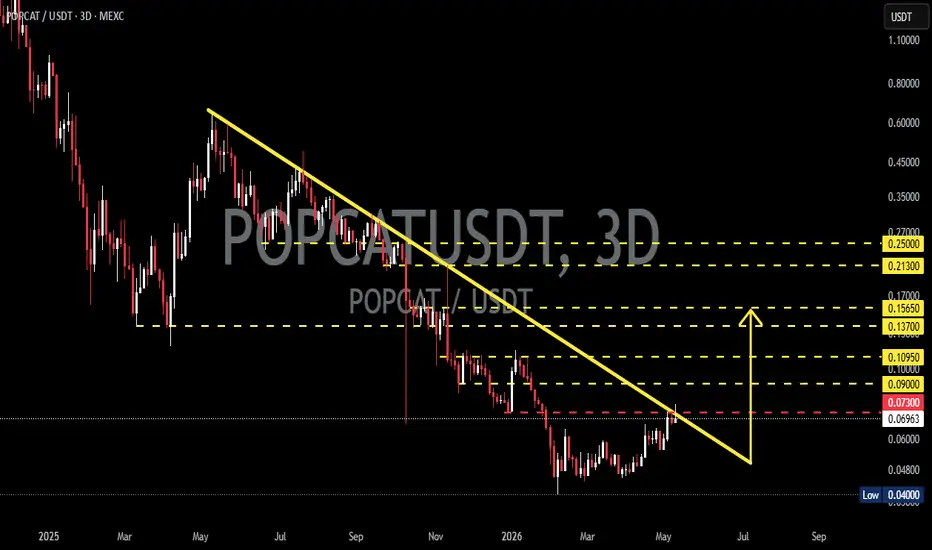
POPCATUSDT - Descending Trendline, Breakout or Another Breakdown📊 Technical Analysis
💵 Coin: $POPCAT #POPCAT
⏳ Time Frame: 3D
📉 Pattern: Descending Trendline
🎯 Bias: Waiting for Breakout Confirmation
---
📌 Pattern Overview – Descending Trendline
🔻 POPCAT is still trading below a long-term Descending Trendline, which has acted as strong resistance for several months. This trendline indicates that sellers remain in control, with every rally continuing to face selling pressure.
⚠️ Price is now approaching the apex of the trendline, a zone that often lea
POPCATUSDT — Breakout from the Base [Quantum Algo]POPCAT sold off from the 0.052 highs down into a multi-day consolidation around 0.045, coiling tight through the range. Price just broke up out of that base with a strong impulse candle, firing the Buy at 0.04590. This is a breakout-continuation long: the coil resolved to the upside, momentum is expanding, and the play is to ride the resumption back toward the prior highs with the base defended below.
Why this setup works — three confluences:
Impulsive break from consolidation. After days of ti
POPCAT Could Explode Above This Resistance$POPCAT is pushing back into a key resistance zone after a strong recovery from recent lows. Buyers are maintaining momentum, but this supply area remains the next major hurdle.
A clean breakout and successful retest above this zone could open the door for a stronger move higher. Until then, watch for price reaction around resistance.
DYOR, NFA
POPCATUSDT - Bear Flag, Major Breakdown or Strong Rebound?On the 8H timeframe, POPCATUSDT remains in an overall bearish trend. After experiencing a sharp decline (Flagpole), the price has been moving gradually higher, forming a Bear Flag—a classic bearish continuation pattern developing inside an ascending parallel channel. 📉
At the moment, the price has returned to test the lower trendline of the channel. This area represents a critical decision zone that will determine whether the Bear Flag confirms or fails. ⚠️
As long as the price remains below t
POPCAT USDT SHORT SIGNALPOPCAT/USDT – Trade Setup (SHORT)
📈 Position Type: SHORT
🕒 Timeframe: 15M
📊 Market: Futures
💰 Entry Zone:
0.04720
🛑 Stop-Loss:
0=04850
🎯 Take-Profit Targets:
• TP1: 0.04618
• TP2: 0.04484
• TP3: 0.04360
• TP4: 0.04194
TP5:
⚙️ Leverage:
5–10
⚠️ After reaching TP1, move Stop-Loss to Entry Price.
📌 Risk Management:
Risk only 1–2% of your capital per trade.
Always confirm the setup on your chart before entry
POPCAT/USDT — Massive Breakout Loading?On this 3D timeframe chart, POPCAT appears to be recovering after experiencing a long-term downtrend from its previous peak levels. 📉➡️📈
Interestingly, price is now approaching a major descending trendline resistance that has been suppressing bullish momentum for several months. ⚠️🟡
This yellow descending trendline is the key level that could determine the next major market direction. If a breakout happens with strong volume confirmation, the potential for a medium-to-long-term trend reversal
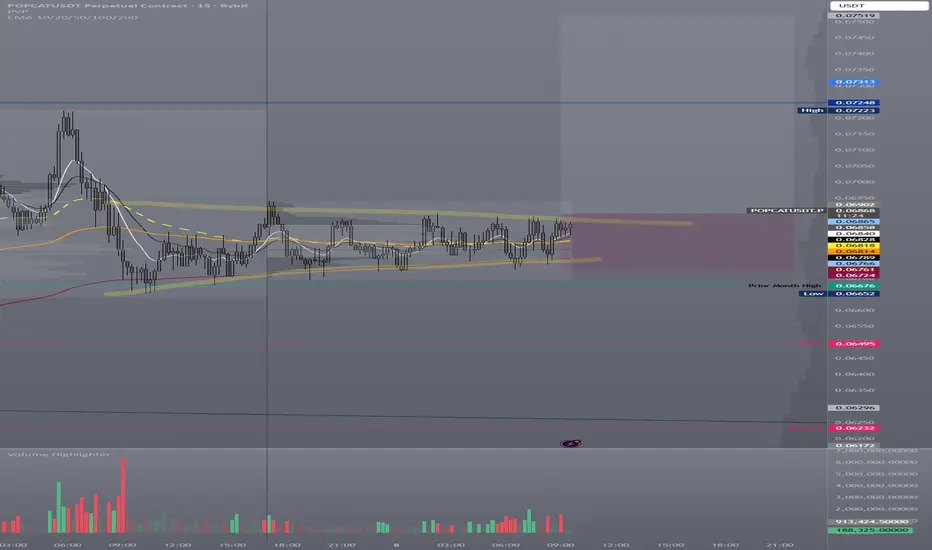
POPCAT Compression After Reclaim — Continuation or Failure?
Intro:
POPCAT is in an important location here. After reclaiming prior month high and prior month value, price has started to compress above those levels instead of fully rejecting back into the prior range.
The question now is simple: does this compression turn into expansion, or does acceptance fail?
HTF Context:
On the daily, POPCAT has reclaimed the prior month high and pushed back into a stronger structure zone after a long corrective phase.
The move off the lows was not just a rand
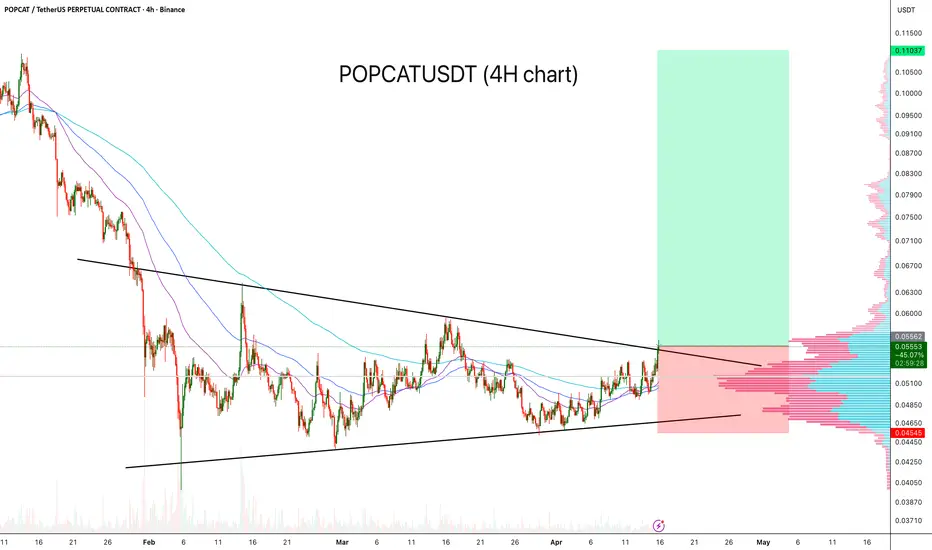
POPCATUSDT: Symmetrical Triangle formation — Reversal Incoming?POPCAT is currently forming a symmetrical triangle on the 4H timeframe after a prolonged downtrend, indicating a phase of price compression and equilibrium between buyers and sellers.
Key points:
- Converging trendlines forming a clear symmetrical triangle
- Price making higher lows and lower highs, signaling tightening volatility
- Structure forming after a strong downtrend (potential accumulation zone)
- Price interacting with key value area on the volume profile
Trade idea:
- Bullish
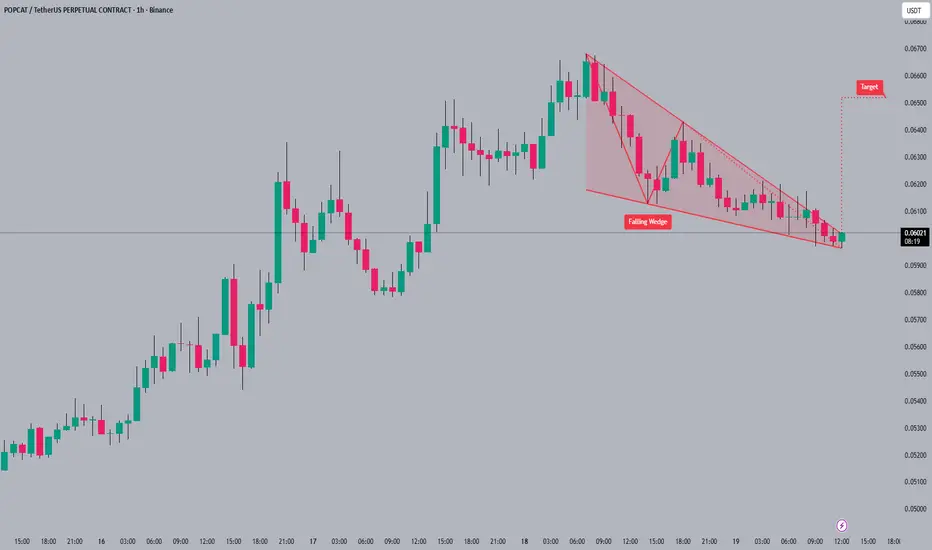
#POPCAT#POPCAT is currently consolidating within a falling wedge 📐 pattern, suggesting a potential breakout. The falling wedge pattern often indicates a bullish reversal 🐂 as the price compresses. If #POPCAT breaks upwards, the target is around 0.06600 🎯.
A breakout from a falling wedge can be a strong signal to enter a long position 🤑.
#POPCAT #memecoin #altcoin #crypto
POPCAT is one of the bullish meme coins (4H)One of the bullish meme coins these days is POPCAT. It seems whales are paying special attention to this meme coin.
From the point where we placed the green arrow on the chart, POPCAT has entered a bullish phase. Waves A and B are complete, with Wave A forming a zigzag and Wave B forming a diamond-shaped diagonal (diamentric).
Wave C appears to be either a zigzag or an expanding pattern, and we are currently in the third part of Wave C, which is a bullish wave.
During pullbacks, we try to ent
Short POPCATUSDT 🔴 POPCATUSDT — 30M SHORT PLAN (STRUCTURE-BASED)
1️⃣ Exact SHORT Entry / SL / TP (30M)
📍 Short entry (confirmation-based — recommended)
Enter SHORT only if price shows rejection from resistance
Entry zone:
👉 0.1025 – 0.1035
(Previous support → resistance + flag underside)
This is the optimal short zone you marked on the chart.
⸻
🛑 Stop Loss (structure invalidation)
SL:
👉 0.1065
Why:
• Above 30M supply / OB
• Above multiple rejections
• Break above = short idea invalid
🎯 Take Profit l
POPCATUSDT BULLISH FLAG Yes — this qualifies as a valid bullish flag, with conditions.
Why it IS a bullish flag
1. Flagpole present
• Strong impulsive move from ~0.075 → 0.11
• Clean expansion candles = institutional impulse
2. Consolidation / flag
• Price is moving sideways to slightly down
• Tight range, overlapping candles
• No deep retracement (holding above ~50% of the pole)
3. Structure
• Higher low already formed after the pullback
• Compression under resistance (good for breakout)
⚠️ The flag is not
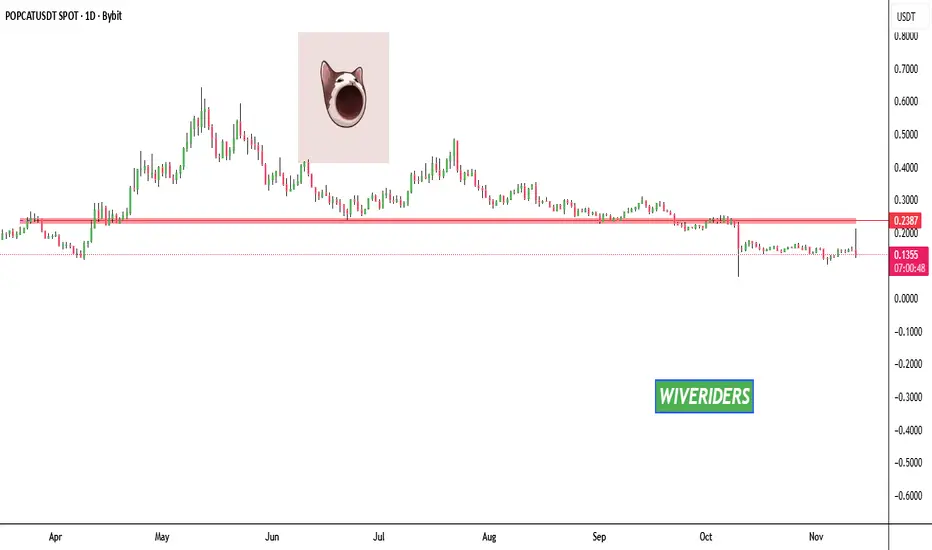
PopCat (POPCAT) Update — Downtrend Pressures Yearly LowPopCat has been in a persistent downtrend since April, with price now drifting toward the yearly low. This level is a weak low, and if it holds, a short-term rally toward the higher time-frame resistance at $0.13 may unfold.
However, the dynamic resistance overhead continues to cap upward movement. Until this trendline is broken, the bearish market structure remains dominant, and downside continuation is more likely.
Key Points
- Price approaching a weak yearly low on sustained downtrend
- Pot
POPCAT/USDT Setup IdeaCurrent Market View
Price appears to be attempting a breakout of the channel into a new upward trend channel (marked in white/grey).
On the hourly chart, momentum oscillators (RSI, MACD) show early signs of shift: RSI is climbing from oversold/neutral area; MACD lines are converging.
The 4-hour and daily charts suggest the downtrend is still in place, but the breakout attempt may signal a reversal if sustained.
Proposed Entry & Exit Levels
Entry Zone (Buy Setup)
Entry: around $0.102 – $
POPCAT ready to jump?Is the cat preparing to jump?
Divergences have started forming right on a strong support level — a clear hint that the asset may be getting ready for a reversal.
Based on the bid/ask ratio, the coin is currently among the top ones: demand is dominating, and market sentiment is positive. Right now it looks like the market sees further upside as a realistic scenario.
Watching closely. If it “jumps,” the move could be strong.