#PORTALUSDT Medium-term Bullish potential !#PORTAL
The price is moving within a descending channel on the 1-hour timeframe and has reached the lower boundary. It is now poised for a bounce and is expected to retest this boundary.
The Relative Strength Index (RSI) indicates a downward trend, which is likely to continue given the overbought conditions.
There is a key support zone in green at 0.00975. The price has bounced off this zone several times, making it a strong support level.
The price is trending towards the 100-period moving average, which we are approaching. This trend supports an upward move.
Entry Price: 0.01015
Target 1: 0.01030
Target 2: 0.01048
Target 3: 0.01066
Stop Loss: At the resistance zone in green
Remember this simple rule: Money management.
Any questions? Please leave a comment.
Thank you.
In-depth trading ideas
#PORTALUSDT Medium-term Bullish potential !#PORTAL
The price is moving within a descending channel on the 1-hour timeframe and has reached the lower boundary. It is now poised for a bounce and is expected to retest this boundary.
The Relative Strength Index (RSI) indicates a downward trend, which is likely to continue given the overbought conditions.
There is a key support zone in green at 0.01000. The price has bounced off this zone several times, making it a strong support level.
The price is trending towards the 100-period moving average, which we are approaching. This trend supports an upward move.
Entry Price: 0.01085
Target 1: 0.01109
Target 2: 0.01134
Target 3: 0.01162
Stop Loss: At the resistance zone in green
Remember this simple rule: Money management.
Any questions? Please leave a comment.
Thank you.
#PORTALUSDT Medium-term Bullish potential !#PORTAL
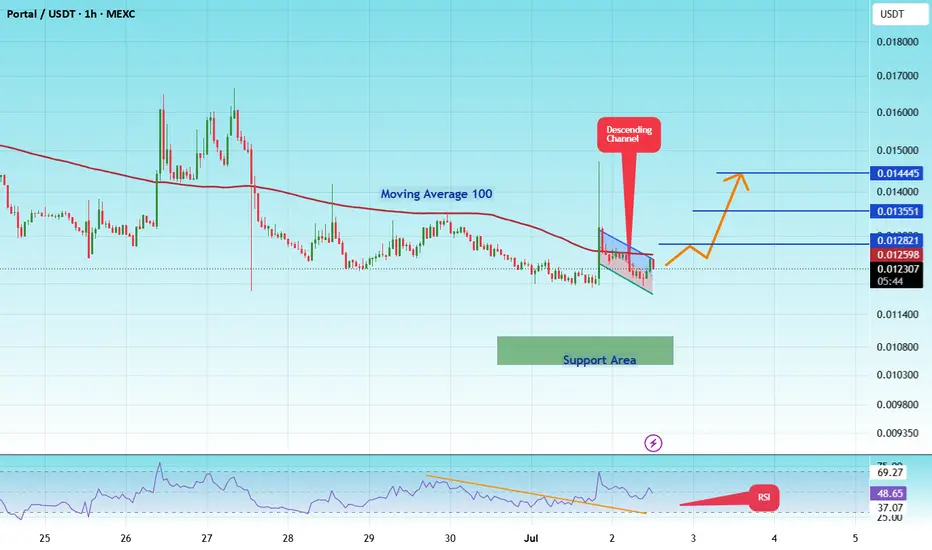
The price is moving within a descending channel on the 1-hour timeframe and has reached the lower boundary. It is now poised for a bounce and is expected to retest this boundary.
The Relative Strength Index (RSI) indicates a downward trend, which is likely to continue given the overbought conditions.
A key support zone has been identified in green at 0.01050. The price has bounced off this zone several times, making it a strong support level.
The price is trending towards the 100-period moving average, which we are approaching. This trend supports an upward move.
Entry Price: 0.01230
First Target: 0.01282
Second Target: 0.01355
Third Target: 0.01444
You can close at the second target or wait for the third target. The choice is yours.
Stop Loss: At the resistance zone in green.
Remember this simple rule: Money Management.
Any questions? Please leave a comment.
Thank you.
#PORTALUSDT Medium-term Bullish potential !#PORTAL
The price is moving within a descending channel on the 1-hour timeframe and has reached the lower boundary. It is now poised for a bounce and is expected to retest this boundary.
The Relative Strength Index (RSI) indicates a downward trend, which is likely to continue given the overbought conditions.
There is a key support zone in green at 0.01111. The price has bounced off this zone several times, making it a strong support level.
The price is trending towards the 100-period moving average, which we are approaching. This trend supports an upward move.
Entry Price: 0.01285
Target 1: 0.01292
Target 2: 0.01350
Target 3: 0.014200
Stop Loss: At the resistance zone in green
Remember this simple rule: Money management.
Any questions? Please leave a comment.
Thank you.
#PORTALUSDT may continue its trend after correction#PORTAL
The price is moving within an ascending channel on the 1-hour timeframe and has reached the lower boundary and is heading towards a breakout. A retest of this boundary is expected.
The Relative Strength Index (RSI) indicates a downward trend, and this trend is likely to continue due to the overbought condition.
There is a key resistance zone in green at 0.015440, which the price has bounced off several times, making it a strong support level.
A consolidation trend is observed above the 100-period moving average, which we are approaching. This trend supports a decline towards this level.
Entry Price: 0.013500
Target 1: 0.013300
Target 2: 0.012680
Target 3: 0.012210
Stop Loss: At the resistance zone in green.
Remember this simple rule: Manage your money wisely.
For any questions, please leave a comment.
Thank you.
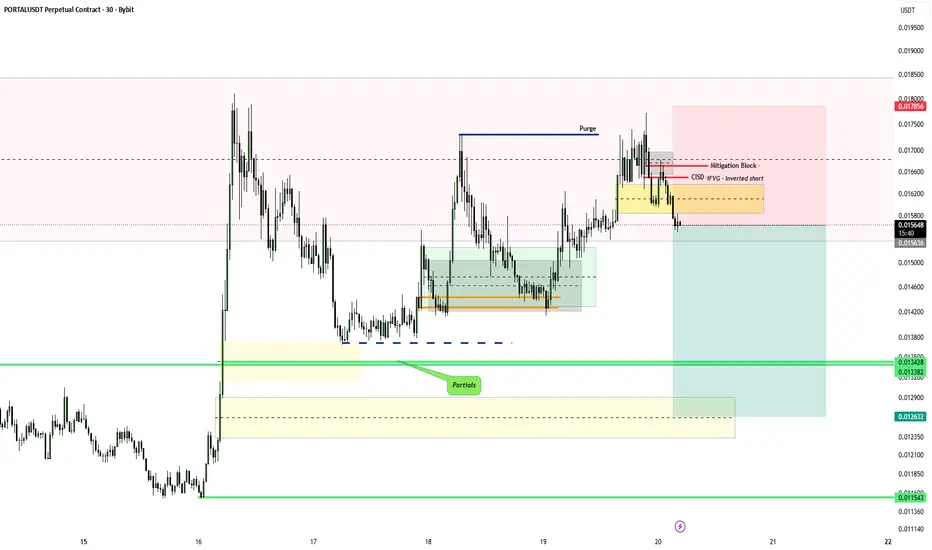
SHORT PORTAL1. Price has purged after induced stops
2. Price has closed below the IFVG - that is good
3. We have clean equal lows tp purge
4. We have discount breakaway gaps to draw to.
(my previous idea - price was at discount so longs were more ideal hence why all the pd arrays were treated as support)
PORTALUSDT UPDATEPORTAL Technical Setup Pattern: Falling Wedge Breakout. Current Price: $0.01593, Target Price: $0.02730, Target % Gain: 80.00%+.
Technical View: PORTAL/USDT is breaking out of a falling wedge pattern on the 1D timeframe with bullish momentum building near the descending trendline. A confirmed daily close above the breakout level could accelerate the move toward the projected target, supported by improving price action.
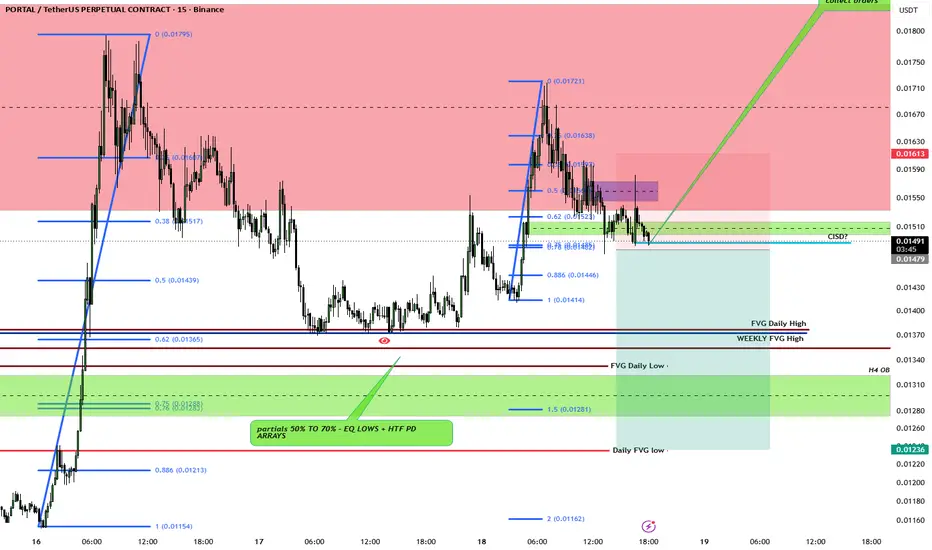
SHORT PORTAL1. This pair was slapped with a monitoring tag in Binance Spot - meaning it has higher probability of dropping when the setup shows up and been delisted from the Binance Platform
2. Price has tagged the Daily Mitigation Block
3. We are about to have CISD after the OB (in green) has been inveted
4. Draw + Partials at the Eq lows + Final draw at the 75% DR Fib
#PORTALUSDT Medium-term Bullish potential !#PORTAL
The price is moving within a descending channel on the 1-hour timeframe and has reached the lower boundary. It is now poised for a bounce and is expected to retest this boundary.
The Relative Strength Index (RSI) indicates a downward trend, which is likely to continue given the overbought conditions.
There is a key support zone in green at 0.01000. The price has bounced off this zone several times, making it a strong support level.
The price is trending towards the 100-period moving average, which we are approaching. This trend supports an upward move.
Entry Price: 0.01407
Target 1: 0.01485
Target 2: 0.01605
Target 3: 0.01750
Stop Loss: At the resistance zone in green
Remember this simple rule: Money management.
Any questions? Please leave a comment.
Thank you.
PORTALUSDT Forming Bullish MomentumPORTALUSDT is forming a clear bullish momentum pattern, a classic bullish wave signal that often indicates an upcoming breakout. The price has been consolidating within a narrowing range, suggesting that selling pressure is weakening while buyers are beginning to regain control. With consistent volume confirming accumulation at lower levels, the setup hints at a potential bullish breakout soon. The projected move could lead to an impressive gain of around 90% to 100% once the price breaks above the key resistance zone.
This bullish momentum pattern is typically seen at the end of downtrends or corrective phases, and it represents a potential shift in market sentiment from bearish to bullish. Traders closely watching PORTALUSDT are noting the strengthening momentum as it nears a breakout zone. The healthy trading volume adds confidence to this setup, showing that market participants are positioning early in anticipation of a reversal.
Investors’ growing interest in PORTALUSDT reflects rising confidence in the project's long-term fundamentals and current technical strength. If the breakout confirms with sustained volume, this could mark the beginning of a fresh bullish leg. The current market structure suggests that buyers are steadily gaining strength while bearish pressure continues to fade.
Traders might find this a valuable setup for medium-term gains, especially as the bullish momentum pattern completes and buying activity accelerates. A successful breakout could attract additional attention from market participants and potentially drive the price toward significantly higher levels in the coming weeks.
✅ Show your support by hitting the like button!
✅ Leave a comment below! (What is your opinion about this Coin?)
Your feedback and engagement keep me inspired to share more insightful market analysis with you!
#PORTALUSDT may continue its trend after correction#PORTAL
The price is moving within a descending channel on the 1-hour timeframe and has reached the lower boundary, heading towards a breakout. A retest of this boundary is expected.
The Relative Strength Index (RSI) indicates a downward trend, and this trend is likely to continue due to the overbought condition.
There is a key resistance zone in green at 0.03050, which the price has bounced off several times, making it a strong support level.
A consolidation trend is observed above the 100-period moving average, which we are approaching. This trend supports a decline towards this level.
Entry Price: 0.01830
Target 1: 0.01666
Target 2: 0.01476
Target 3: 0.01228
Stop Loss: At the resistance zone in green.
Remember this simple rule: Manage your money wisely.
For any questions, please leave a comment.
Thank you.
PORTAL Is Setting Up for a Massive Trade Opportunity!After months of downtrend and low market activity, volatility is starting to return to the this coin "PORTAL", creating new opportunities.
In this short video, I'll break down the key levels and zones I'm watching, what needs to happen next, and the potential this coin could have if it successfully re-enters its previous trading range.
This is my first technical analysis (TA) video, so I'd really appreciate your feedback. If you enjoyed the video, please leave a like and a comment. Thanks for watching!
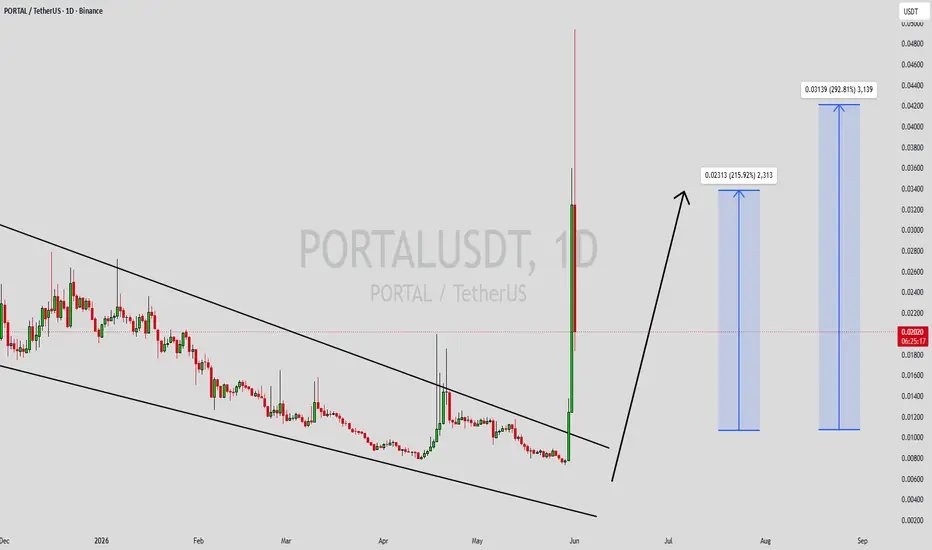
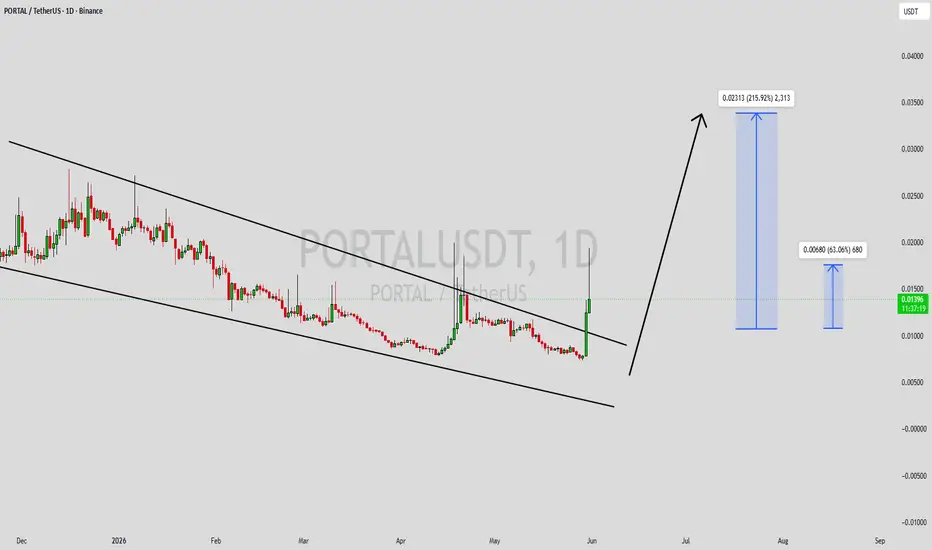
PORTALUSDT Forming Falling WedgePORTALUSDT is forming a clear falling wedge pattern, a classic bullish wave signal that often indicates an upcoming breakout. The price has been consolidating within a narrowing range, suggesting that selling pressure is weakening while buyers are beginning to regain control. With consistent volume confirming accumulation at lower levels, the setup hints at a potential bullish breakout soon.
The projected move could lead to an impressive gain of around **190% to 200%** once the price breaks above the wedge resistance. This falling wedge pattern is typically seen at the end of downtrends or corrective phases, and it represents a potential shift in market sentiment from bearish to bullish.
Traders closely watching PORTALUSDT are noting the strengthening momentum as it nears a breakout zone. Strong trading volume adds confidence to this setup, showing that market participants are positioning early in anticipation of a potential trend reversal.
Investors’ growing interest in PORTALUSDT reflects increasing confidence in the project's long-term fundamentals and current technical strength. If the breakout confirms with sustained volume, this could mark the beginning of a powerful new bullish leg. Traders may find this an attractive setup for medium-term gains, especially as the falling wedge pattern nears completion and buying momentum continues to build.
As market sentiment improves and accumulation remains strong, PORTALUSDT could become one of the more closely watched opportunities in the market. A successful breakout above resistance may unlock significant upside potential and attract additional buying interest.
✅ Show your support by hitting the like button!
✅ Leave a comment below! (What is your opinion about this coin?)
Your feedback and engagement keep me inspired to share more insightful market analysis with you!
PORTAL – 62% Correction on the Way? PORTAL is showing weakness after losing momentum, and traders are starting to ask whether a deeper correction could be ahead. If selling pressure continues and key support levels break, a move toward a 62% correction from recent highs becomes a realistic possibility
PORTAL:USDT UPDATE : THE VOLUME TOKEN📊 PORTAL:USDT UPDATE
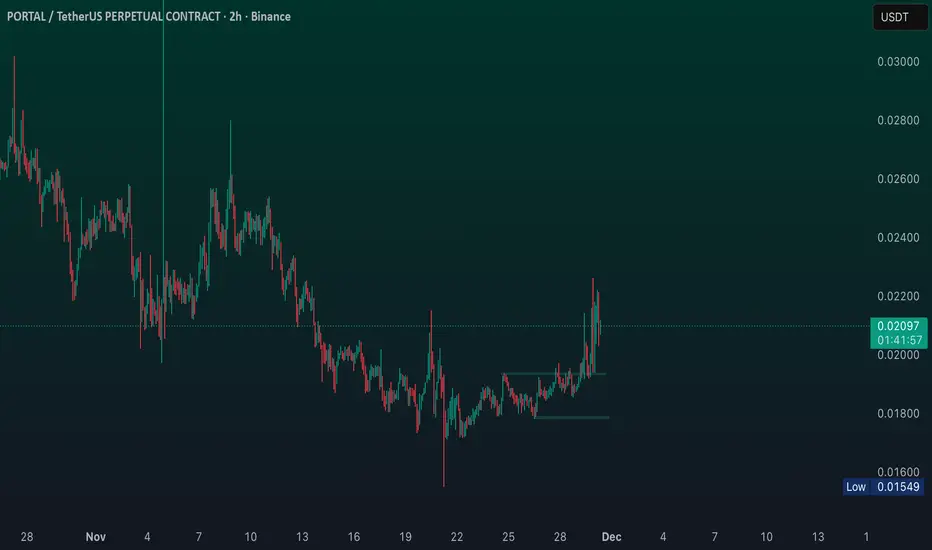
PORTAL continues showing strong bullish momentum after breaking out from a long accumulation phase near the 0.0073 support zone.
🟢 Market Structure
The token has already delivered a significant expansion move and is now consolidating below the important 0.0180 resistance level. Buyers continue defending higher lows, which keeps the bullish structure intact.
🔹 Current Situation
PORTAL is trading inside the upper part of the range, showing strength despite recent profit-taking. The market is attempting to build enough momentum for a potential breakout above resistance.
PORTAL ON LOW TIME FRAME CONFIRMED
⚠️ Key Levels to Watch
Resistance 1: 0.0180
Resistance 2: 0.0201
Resistance 3: 0.0222
Main Support: 0.0140 – 0.0150
A confirmed breakout above 0.0180 could open the door toward the next resistance levels around 0.0201 and 0.0222.
🚀 Outlook
The overall structure remains bullish as long as PORTAL holds above the current support zone. Volume remains elevated compared to previous sessions, indicating continued market interest.
📈 We continue following PORTAL closely for the next confirmed breakout update.
PORTALUSDT Forming Falling WedgePORTALUSDT is forming a clear falling wedge pattern, a classic bullish wave signal that often indicates an upcoming breakout. The price has been consolidating within a narrowing range, suggesting that selling pressure is gradually weakening while buyers are beginning to regain control. With consistent volume confirming accumulation at lower levels, the setup hints at a potential bullish breakout soon. The projected move could lead to an impressive gain of around 190% to 200% once the price breaks above the wedge resistance.
This falling wedge pattern is typically seen at the end of downtrends or corrective phases, and it represents a potential shift in market sentiment from bearish to bullish. Traders closely watching PORTALUSDT are noting the strengthening momentum as it approaches a key breakout zone. Strong trading volume adds confidence to this pattern, indicating that market participants may be positioning themselves early in anticipation of a significant reversal.
Investors’ growing interest in PORTALUSDT reflects increasing confidence in the project's long-term potential and current technical strength. If the breakout confirms with sustained volume, it could mark the beginning of a powerful new bullish leg. Traders may find this setup particularly attractive for medium-term opportunities, especially as the wedge pattern nears completion and buying momentum continues to build.
✅ Show your support by hitting the like button!
✅ Leave a comment below! (What is your opinion about this coin?)
Your feedback and engagement keep me inspired to share more insightful market analysis with you! 📈🚀
#PORTALUSDT Medium-term Bullish potential !#PORTAL
The price is moving within a descending channel on the 1-hour timeframe and has reached the lower boundary. It is now poised for a bounce and is expected to retest this boundary.
The Relative Strength Index (RSI) indicates a downward trend, which is likely to continue given the overbought conditions.
There is a key support zone in green at 006400. The price has bounced off this zone several times, making it a strong support level.
The price is trending towards the 100-period moving average, which we are approaching. This trend supports an upward move.
Entry Price: 0.008770
First Target: 0.009294
Second Target: 0.01037
Third Target: 0.011320
You can stop at the first and second targets and close the price, or continue towards the third target. Stop Loss: At the resistance zone in green.
Remember this simple rule: Money Management.
Any questions? Please leave a comment.
Thank you.
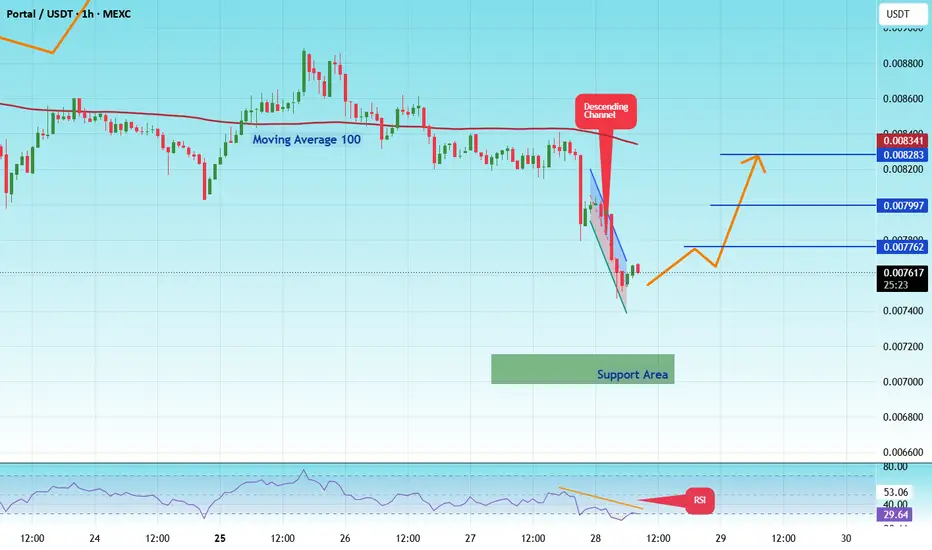
#PORTALUSDT Medium-term Bullish potential !#PORTAL
The price is moving within a descending channel on the hourly timeframe. It has reached the lower boundary and is trending towards a bounce. A retest of this boundary is expected.
The Relative Strength Index (RSI) indicates a downward trend, and this trend is likely to continue due to the overbought condition.
A key support zone has been identified in green at 0.007000. The price has bounced off this zone several times, making it a strong support level.
The price is trending towards the 100-period moving average, which we are approaching. This trend supports an upward move.
Entry Price: 0.007600
Target 1: 0.007762
Target 2: 0.007997
Target 3: 0.00828
You can close at the second target or wait for the third target to be reached. The choice is yours.
Stop Loss: At the resistance zone in green.
Remember this simple rule: Money management.
Any questions? Please leave a comment.
Thank you.
#PORTALUSDT Medium-term Bullish potential !#PORTAL
The price is moving within a descending channel on the 1-hour timeframe and has reached the lower boundary. It is now poised for a bounce and is expected to retest this boundary.
The Relative Strength Index (RSI) indicates a downward trend, which is likely to continue given the overbought conditions.
There is a key support zone (in green) at 0.00907. The price has bounced off this zone several times, making it a strong support level.
The price is trending towards the 100-period moving average, which we are approaching. This trend supports an upward move.
Entry Price: 0.01060
First Target: 0.01094
Second Target: 0.01140
Third Target: 0.01200
You can stop at the first and second targets and close the price, or continue towards the third target. Stop Loss: At the resistance zone (in green).
Remember this simple rule: Money Management.
Any questions? Please leave a comment.
Thank you.