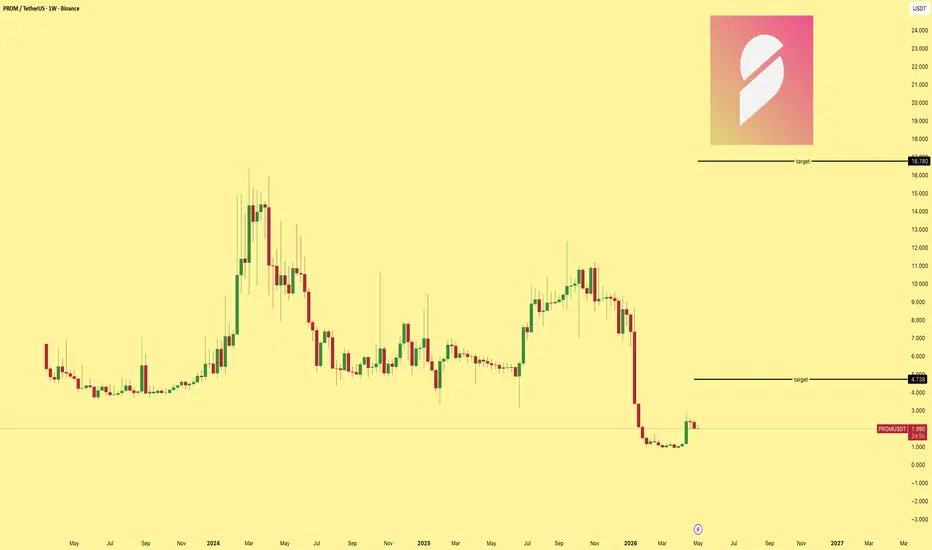
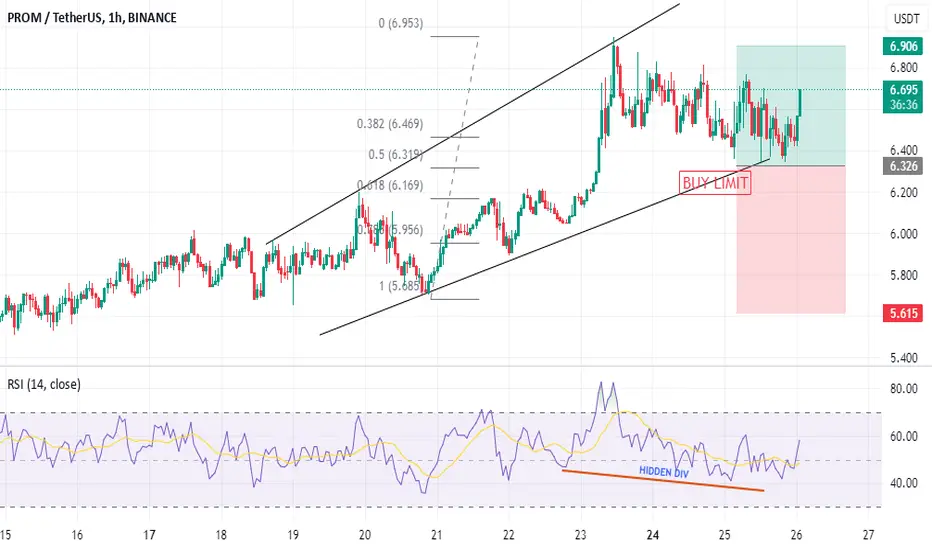
PROMEUSDT Forming Bullish MomentumPROMUSDT is forming a clear bullish momentum pattern, a classic bullish reversal signal that often indicates an upcoming breakout. The price has been consolidating within a narrowing range, suggesting that selling pressure is weakening while buyers are beginning to regain control. With consistent volume confirming accumulation at lower levels, the setup hints at a potential bullish breakout soon. The projected move could lead to an impressive gain of around 60% to 70% once the price breaks above
Prometeus/USD Tether Spot
No trades
No trades
In-depth trading ideas
$PROM Bulls Are Testing A Multi-Year Ceiling: Breakout Or RejectAQUISUK:PROM Bulls Are Testing A Multi-Year Ceiling: Breakout Or Rejection?
#PROM has delivered an exceptional rally, gaining approximately 845% in just 2 months with very limited meaningful retracement.
After such an aggressive expansion, my focus is no longer on chasing upside, it is on identifying where the current trend could lose momentum.
HTF SUPPLY ZONE: Bearish Order Block: $6.80–$9.37
Price is currently trading inside this HTF supply zone, making rejection a scenario worth watching
PROMUSDT Forming Bullish MomentumPROMUSDT is forming a clear bullish momentum pattern, a classic bullish wave signal that often indicates an upcoming breakout. The price has been consolidating within a narrowing range, suggesting that selling pressure is weakening while buyers are beginning to regain control. With consistent volume confirming accumulation at lower levels, the setup hints at a potential bullish breakout soon. The projected move could lead to an impressive gain of around 90% to 100% once the price breaks above th
PROMUSDT Forming Bullish MomentumPROMUSDT is forming a clear bullish momentum pattern, a classic bullish wave signal that often indicates an upcoming breakout. The price has been consolidating within a narrowing range, suggesting that selling pressure is weakening while buyers are beginning to regain control. With consistent volume confirming accumulation at lower levels, the setup hints at a potential bullish breakout soon. The projected move could lead to an impressive gain of around 190% to 200% once the price breaks above t
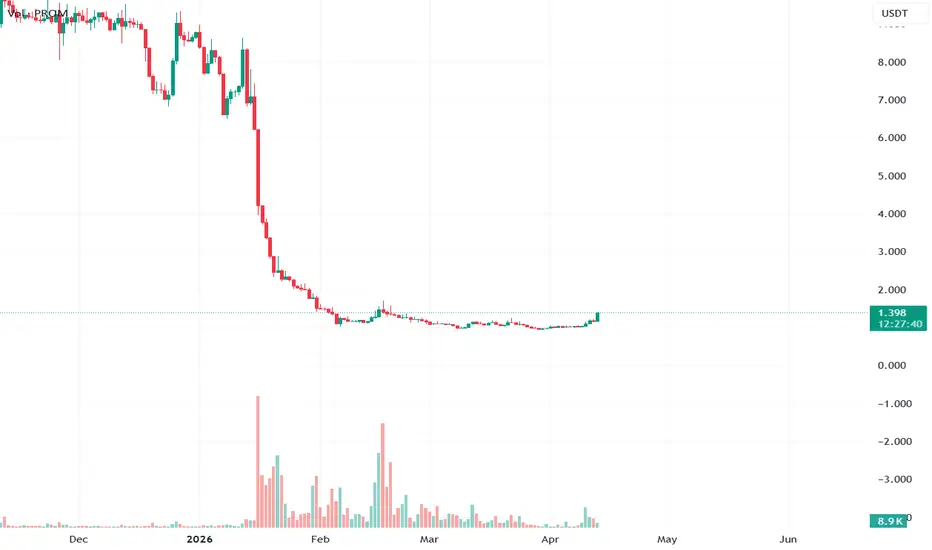
PROMUSDT - Deep BullPROMUSDT is trading at 1.398 spot against 1.392 futures with just 8.9K volume — this is an extremely thin market. Dollar flow reads 2.41M spot versus 14.01M futures, roughly a 5.8x ratio, with Spot:Fut reading Normal. However the critical context here is that AT Max leverage hit 90.97x just 28 bars ago — one of the most extreme leverage flushes visible on the board — and percentile has already collapsed to 6.4% Floor. That is a violent and recent de-risking event.
44 green to 6 red out of 112 g
PLong
PROMUSDT Forming Bullish MomentumPROMUSDT is forming a clear bullish momentum pattern, a classic bullish reversal signal that often indicates an upcoming breakout. The price has been consolidating within a narrowing range, suggesting that selling pressure is weakening while buyers are beginning to regain control. With consistent volume confirming accumulation at lower levels, the setup hints at a potential bullish breakout soon. The projected move could lead to an impressive gain of around 190% to 200% once the price breaks abo
PROMUSDT Forming Falling WedgePROMUSDT is forming a clear falling wedge pattern, a classic bullish reversal signal that often indicates an upcoming breakout. The price has been consolidating within a narrowing range, suggesting that selling pressure is weakening while buyers are beginning to regain control. With consistent volume confirming accumulation at lower levels, the setup hints at a potential bullish breakout soon. The projected move could lead to an impressive gain of around 50% to 60% once the price breaks above th
PROMUSDT Forming Bullish MomentumPROMUSDT is forming a clear Bullish Momentum pattern, a classic bullish reversal signal that often indicates an upcoming breakout. The price has been consolidating within a narrowing range, suggesting that selling pressure is weakening while buyers are beginning to regain control. With consistent volume confirming accumulation at lower levels, the setup hints at a potential bullish breakout soon. The projected move could lead to an impressive gain of around 90% to 100% once the price breaks abov
PROMUSDT Forming Bullish ReversalPROM/USDT is currently forming what looks like a consolidation base after a prior downtrend, indicating that accumulation may be underway and a bullish reversal could be on the horizon. The token’s price has held firm around the $9-$10 range while trading volume shows improvement, suggesting that institutional interest and market participation may be increasing. This kind of scenario often sets the stage for a breakout when both price structure and volume align.
On the fundamental side, PROM is
PROMUSDT Forming Bullish WavePROMUSDT is showing a bullish wave pattern, signaling strength and the potential for a continuation move to the upside. This type of formation often develops after a strong rally, followed by healthy consolidation, which allows the market to reset before pushing higher. The structure suggests that buyers are still in control, preparing for another leg up, and the technicals point toward a steady but promising gain.
Trading volume has remained supportive, which confirms the interest from market
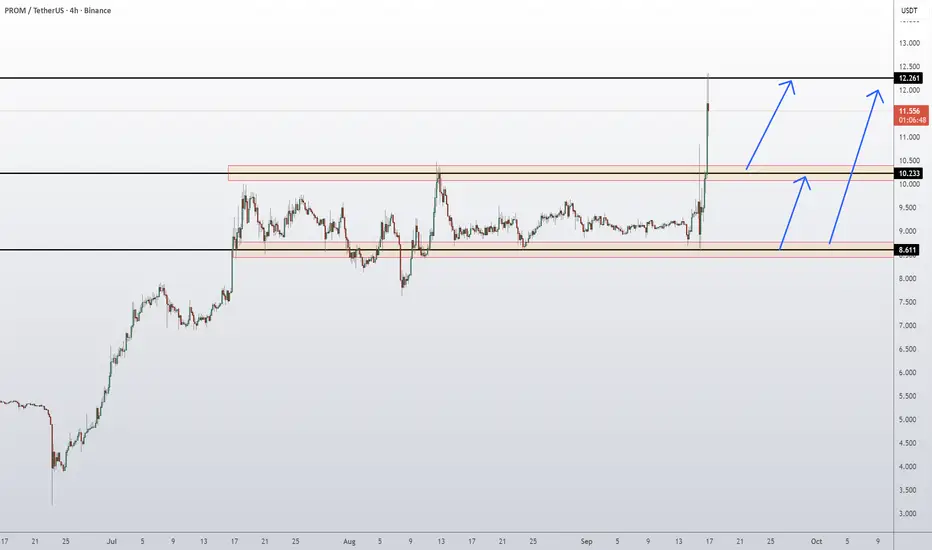
Prom Coin Token Price Prediction and Technical AnalysisPROM/USDT has broken out of its extended consolidation range, surging from the 10.233 resistance-turned-support and spiking toward the 12.261 resistance zone. This breakout confirms strong bullish momentum, but price is now consolidating just under the major resistance. If buyers manage to hold above 10.233, continuation toward 12.261 and potentially higher is likely. However, a failure to sustain could see a pullback into the 8.611 demand base before another leg higher.
📈 Key Levels:
Buy t
PROMUSDT Forming Bullish SegmentPROMUSDT has delivered an impressive breakout after a long period of consolidation, confirming a strong bullish sentiment among traders. The chart highlights a clean accumulation range where price held steady before surging upward with momentum. With good volume accompanying this breakout, it suggests that buyers are taking control and fueling the next wave of the rally.
This breakout signals that PROMUSDT has the potential to target higher resistance levels, with traders now eyeing gains of ar
PROM AT RISK ZONE FREE FALL POSSIBLEThe latest data indicate that PROM is in a risk zone and could experience a breakdown.
The signal is present; it is now a matter of whether it will be confirmed or not.
This provides a reason to monitor the coin closely, tracking the data step by step.
This is not trading advice, as markets are inherently unpredictable.
We have observed similar signals before on other coins that subsequently experienced a free-fall breakdown. For this reason, we are providing this update.
PROM/USDTKey Level Zone: 8.550 - 8.780
LMT v2.0 detected.
The setup looks promising—price previously trended upward with rising volume and momentum, then retested this zone cleanly. This presents an excellent reward-to-risk opportunity if momentum continues to align.
Introducing LMT (Levels & Momentum Trading)
- Over the past 3 years, I’ve refined my approach to focus more sharply on the single most important element in any trade: the KEY LEVEL.
- While HMT (High Momentum Trading) served me well—combi
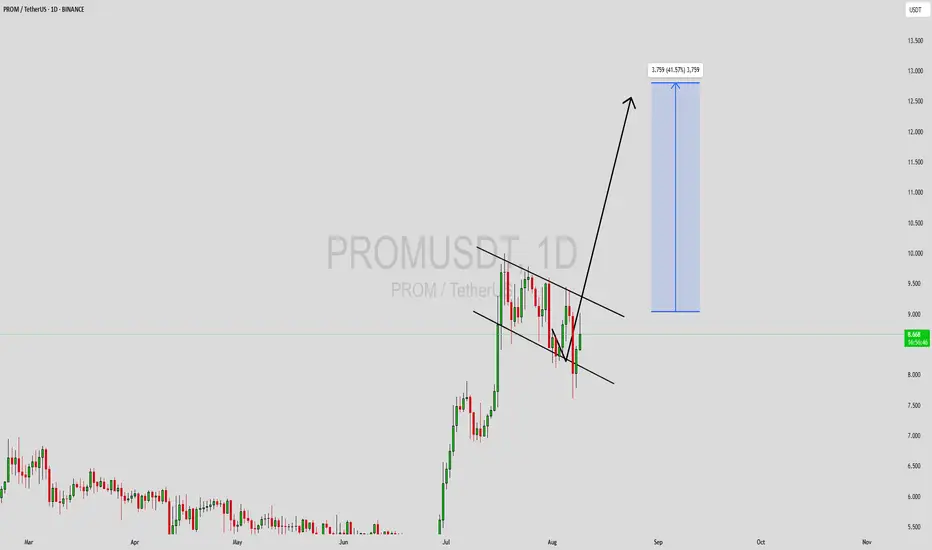
PROMUSDT Forming Bullish FlagPROMUSDT is currently forming a bullish flag pattern, a strong continuation signal that often indicates the potential for further upside after a preceding rally. This pattern develops when price consolidates in a downward-sloping channel following a strong upward move, allowing the market to reset before the next bullish push. The structure suggests that buyers are preparing for another leg higher, which could potentially deliver gains of 30% to 40% or more once the breakout occurs.
The current
PROMUSDT – LONG/BUY Spot RecommendationPROMUSDT – LONG/BUY Spot Recommendation
Context: PROMUSDT completed a daily (D1) correction 3 days ago, with price pulling back from a recent peak at $7.9 down to $6.8. Currently, D1 has confirmed its bottom.
Recommendation: LONG/BUY Spot
Entry Strategy: Missed ideal entry at $6.8; enter around $7.3 and accumulate further if price dips lower.
Profit Targets: $9.0 – $10.0 or follow signals based on D1 peak formations.
Rationale: D1 confirmed bottom; continuation of D1 uptrend expected.
PROMO Scalping with 7-starWhether it's bear or bull market, you don't have to worry. 7-star presents you with almost accurate sniper entries. Here promo is going all the way to 6.15 with good place for entry.
This new feature in our 7-star indicator is future scalping shorts
DYOR
For indicator access you can message me.
Long Entry Signal for PROM/USDTBased on the daily chart for PROMUSDT on Bybit, here's a concise analysis:
MLR vs. SMA: The MLR (blue) is above the SMA (pink), indicating a bullish trend.
MLR vs. BB Center: The MLR is above the BB Center Line (orange), suggesting bullish momentum.
PSAR: The PSAR dots (black) are under the price, confirming a bullish trend.
Price vs. SMA 200: The price is above the 200-period SMA (red), supporting a long-term bullish trend.
Current Strategy: Since all entry conditions for a long position are
PLong