In-depth trading ideas
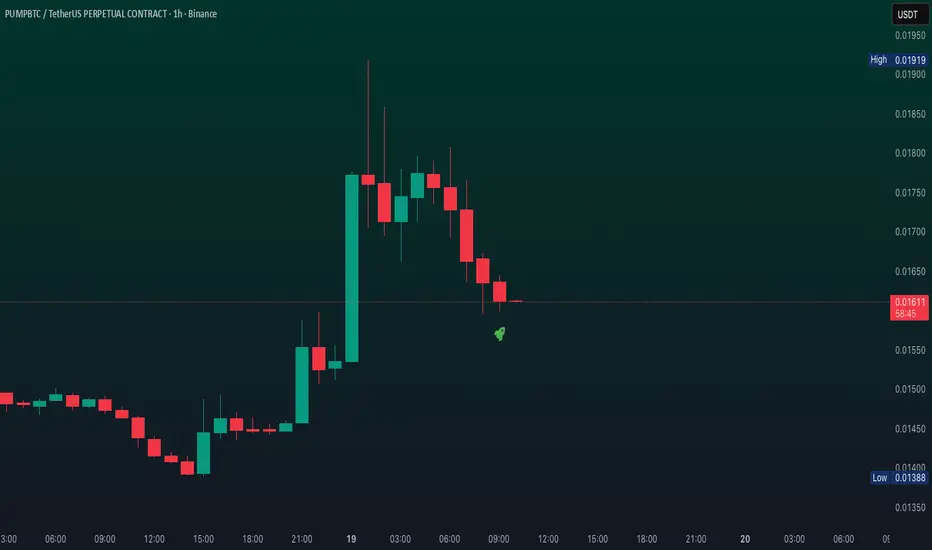
PumpBTC —Back within bullish zone (~2,400% Profits Potential) Another project hits bottom and recovers. The bullish bias is confirmed. The week is only starting now but the start is super green.
Here I have a combination of several signals: The falling wedge and the bottom reversal, the cup pattern. The current session is producing a break above EMA34. Volume is starting to rise on a big full green candle.
In September 2025 PUMPBTCUSDT grew almost 2,000% in a matter of weeks. Similar is the chart I am now showing you. It starts slow, the reversal process tends to be boring; suddenly, everything changes and that's the present candle. Full green.
Next, high bullish momentum shows up, sustained growth; week after week after week. Nobody knows for how long this process can be maintained.
Some projects will peak after 3-4 weeks if they start to grow late. Others can grow for months non-stop. Think of all those projects that started growing in December 2025, now more than four months of sustained bullish action.
Put everything together and we will have a bull-run phase. The moment everything grows, marketwide bullish action, leading to the highest prices in years... The targets can be seen on the chart.
PUMPBTCUSDT already showed it can grow big and fast in a matter of weeks. So it is possible to hit those targets in several months. If the market retraces after the first wave, this can be used as an opportunity to buy before the appearance of even higher prices.
100% bullish. Are you with me?
Namaste.
PUMPBTCUSDT - Deep BullPUMPBTCUSDT is trading at 0.02091 spot against 0.02102 futures with volume at 15.91M. The critical number here is the futures-to-spot ratio — 549.94M futures against just 32.7M spot is a 16x imbalance. Dollar flow confirms it: 683.74K spot versus 11.5M futures. Spot:Fut is reading Futures Lean, meaning this move is being driven by derivatives traffic, not organic spot demand. That alone demands caution before any aggressive long entry.
38 green to 17 red out of 112 puts bull bias at 55.56% with bear at 2.9. EMA is clean at 4 green to zero red. Candle structure holds at 9 green 5 red, Ichimoku TK 9 green 3 red, C>T at 11 green 3 red. The problem is DD/SS reading 1 demand to 4 supply — that is a significant supply overhang flagging distribution overhead. Squeeze has been building for 55 bars and is IMMINENT, momentum pointing bull, bandwidth at 34.92% normal. Bull Cascade just started at bar 1 with 18.7% five-bar move.
Spot Z is slightly negative at -0.19 steady, futures Z mild positive at 0.13, combined at 0.09 average. No real acceleration in either direction. The 5-bar spot trajectory is rising from -0.34 to 0.15 but remains in negative territory. MeanZ is at 2.55σ Extreme — price is statistically stretched above its mean even at these levels. Bull:Bear Z at 0.68 to -0.31 reads neutral with no strong directional conviction from volume flow.
Leverage at 16.91x and declining sits at 39.1% percentile — Lower but not yet Floor, which is the key distinction. All-time max leverage was 41.98x just 303 bars ago. Price is at 7.9% bottom of its full historical range between 0.01345 and 0.10812, so the asset is historically cheap. However, percentile at 39.1% means leverage has not fully flushed to the structural buy zone yet — there is room for further compression.
OBV Z at -0.44 with a 5-bar drift from -0.52 to 0.08 is the most honest signal on the board. Drift Up is the weakest possible OBV recovery reading — buyers are barely trickling in while futures dominate the volume profile. No whale activity, liquidations clear, no squeeze divergence flagged. This OBV reading directly contradicts the cascade and EMA alignment. Volume intelligence is not supporting the bull case yet.
The honest read: PUMPBTCUSDT is structurally cheap and the 55-bar squeeze is a loaded spring, but the 16x futures-to-spot ratio, 4 supply zones overhead versus 1 demand, leverage sitting at lower not floor, and OBV barely drifting positive all point to a setup that needs confirmation before entry. The yield at 581% APY bear is funding traders to short this, not long it. If the squeeze fires with OBV Z breaking above 0 and spot Z clearing positive territory simultaneously, the bounce target of 45.2% is real. Until then, the futures tail is wagging the spot dog here.
Is That Crypto Pump Real? Data Says No. Here's Why.
Stop Losing Money to Fake Volume. Find Real Moves Now.
Trade the REAL Crypto Volume. Stop Getting Faked Out.
PUMPBTC/USDThas been in a clear accumulation phase over the past month. The first bullish leg broke above the key 0.04 USDT resistance with strong momentum, flipping it into a solid support zone. Recently, liquidity was swept just below the 0.04 level, trapping late sellers and confirming buyer strength.
With Bitcoin entering price discovery mode and showing signs of a parabolic move, PUMPBTC is poised to follow the macro trend. The structure is bullish, and a parabolic continuation is likely as long as the 0.038–0.04 support holds.