PUMP Surges 20% — Is Another 5% Rally Still Ahead?PUMP ( BINANCE:PUMPUSDT ) has surged nearly 20% over the past 24 hours, supported by both fundamental catalysts and a major technical breakout.
Can PUMP extend its rally, or is a temporary pullback approaching?
Key Catalysts
• BOOST Buybacks: Continuous buybacks helped absorb part of the selling pressure following the recent token unlock.
• Spot-Led Demand: Open Interest declined while price moved higher, suggesting that the rally was driven mainly by spot buying rather than excessive leveraged positions.
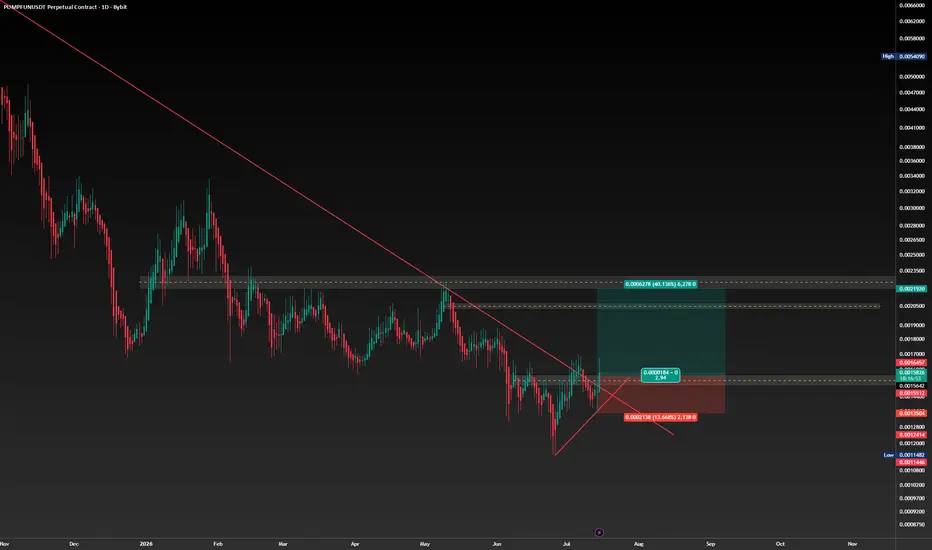
• Technical Breakout: PUMP broke above its multi-month Descending Channel with significantly higher trading volume, attracting new liquidity and momentum traders.
Technical Analysis
On the 4-hour time frame, PUMP is currently approaching the Resistance Zone, Resistance Lines, and Cumulative Short Liquidation Leverage($0.002230-$0.002186).
From an Elliott Wave perspective, PUMP appears to be completing its main wave 5. The price could temporarily break above the Resistance Lines before reaching its final top.
I expect PUMP to continue its bullish move and gain at least another +5%.
However, after reaching the Resistance Lines and Cumulative Short Liquidation Leverage, the token could experience at least a temporary pullback.
Cumulative Long Liquidation Leverage: $0.001958-$0.001915
Key Trading Level: $0.00200-$0.001970
Do you think PUMP can break above the Resistance Zone before a pullback?
🟢 Yes
🔴 No
📌 PUMP Analysis, 4-hour time frame.
🛑 Always use proper risk management and set a Stop Loss(SL) for every position.
🚀 If this analysis helps your trading plan, a BOOST would help more traders discover it.
In-depth trading ideas
PUMP: Cup and Handle Pattern CompletedPUMP: Cup and Handle Pattern Completed – Triggering a Bullish Breakout Wave with Superior Risk-Reward
PUMP has just issued a highly impressive bullish signal by officially confirming the completion of a textbook Cup and Handle chart pattern. Following a curved accumulation phase forming the cup base to absorb overhead selling pressure, the price action executed a minor corrective dip to construct the handle, before decisively breaking above the neckline resistance barrier. The sheer dominance of buying volume at the breakout point demonstrates that the bulls are in total control.
Based on the visual data from the 1-hour chart , the projected upside target for this breakout wave is measured equivalent to the vertical depth of the cup. The fact that the price holds firmly above the newly converted resistance floor alongside the dynamic MA100 trendline support confirms a solid structural foundation, unlocking substantial room for upward expansion in the short term.
This current technical setup delivers an exceptional Long trading opportunity with an elevated risk-to-reward (RR) ratio exceeding 4R. Traders can trigger trend-following buy orders while placing a tight stop-loss just below the handle support structure to protect capital efficiently. Nevertheless, strict adherence to disciplined risk management remains paramount regardless of market conditions.
Disclaimer: This is not financial advice, DYOR.
Degens Aping, Platform Printing and The $PUMP Pumping The Meme Casino Just Hit the Nitro Button
Looks like the degens found the buy button again.. PUMP is absolutely sending it, and this time it's not just because someone posted a Pepe with laser eyes. After weeks of getting farmed by paper hands, the token finally caught a wave of fresh hype as traders started rotating back into Solana meme plays
The biggest fuel behind this pump is the growing optimism around Pump. fun's ecosystem
Despite the meme coin market cooling off earlier this year, the platform continues to dominate Solana's token launch scene, generating massive trading activity and protocol revenue. Investors are betting that if meme season returns, Pump .fun will be one of the biggest winners. Basically, people aren't buying the token they're buying a ticket to the degen casino before the crowd shows up
On top of that, crypto sentiment has improved across the board. Bitcoin holding strong and Solana gaining momentum have pushed traders further out on the risk curve. When blue chips stop moving fast enough, degens naturally migrate to high beta plays like PUMP, hoping to catch the next ridiculous candle before Crypto Twitter starts posting rocket emojis every five seconds
Of course, let's not forget the classic crypto recipe, low float momentum, leveraged longs piling in, influencers shilling "early entry," and shorts getting absolutely liquidated into oblivion
Whether this turns into a full blown giga pump or just another exit liquidity event depends on whether buyers can keep the volume flowing. Until then, the meme machine is alive, the casino is open, and someone's portfolio is either going to Valhalla..or straight to McDonald's🍟
Gamble or vision?Curious, what do you think of pump at this point the volume is picking up? The real profit of crypto is coming from two sources:
1. Hyper liquid
2. Pump fun, which means that they really make a profit and invest 50% back into the business by buying those tokens.
Based on that, we're betting on picking up more volume in crypto. Especially In MEME area it is a high chance but it stays a gamble.
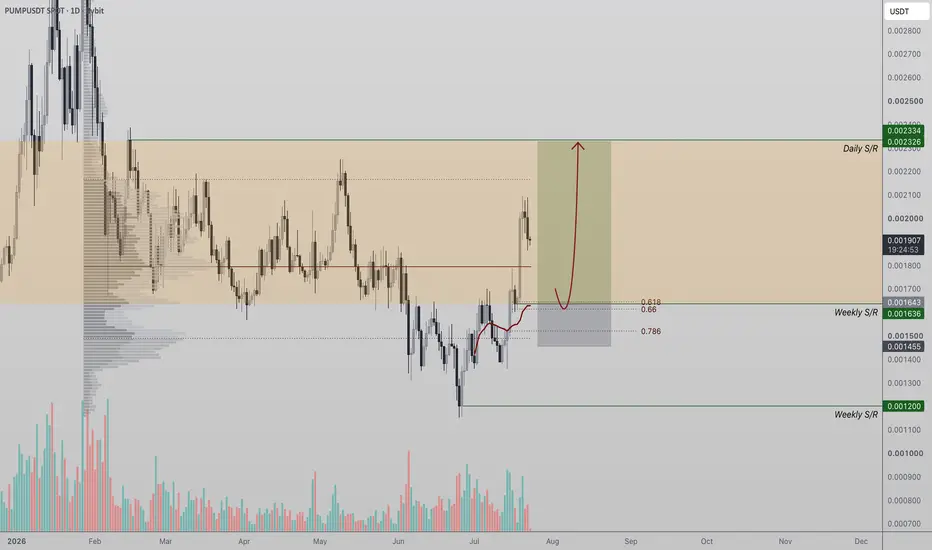
PUMP Eyes Key SupportPUMP is showing encouraging signs of strength after reclaiming the range Point of Control and holding firmly above weekly support.
This reclaim is an important technical development, as it suggests buyers have regained control of the current trading range and are attempting to establish a foundation for further upside. Remaining above this weekly support is critical, as it reinforces the short-term bullish structure and increases the probability of continued higher prices.
The ideal scenario from here would be a controlled bullish retest of the reclaimed support. If price revisits this region and successfully forms a higher low, it would confirm that the previous breakout is holding while also filling the market inefficiency created by the recent impulsive move higher. This type of price action often strengthens the trend by allowing buyers to re-enter before the next leg higher.
Adding to the bullish outlook is the strong technical confluence surrounding the current support zone. The weekly support aligns closely with the VWAP, the 0.618 Fibonacci retracement, and the reclaimed Point of Control, creating a high-conviction demand area. When several technical indicators converge at the same level, the likelihood of a meaningful market reaction increases.
As long as PUMP continues to hold this confluence zone, the probability favours a continuation toward the next daily resistance. Maintaining this structure would preserve the broader range while supporting a sustained bullish outlook in the sessions ahead.
PUMP SCREAMING UNDERVALUED RIGHT NOWPump fun has bought back and burned ~40% of supply
Pump is screaming undervalued at 500M Cap
1M+ USD in revenue every day. Every single day
New Go Bounty Feature..
A platform generating daily revenue higher than 99% of projects in crypto
Sitting in the top 6 for revenue across the entire market
It has potential to do very well when fundamentals actually start acting as Catalyst
$PUMPUSD 3RD WAVE PUMP LOADING? (Don't Miss This Setup!)NYSE:PUMP 3RD WAVE PUMP LOADING? (Don't Miss This Setup!) 🚀
Looking closely at the 4H chart, NYSE:PUMP has already bounced off this rising trendline support twice before. Right now, price is pulling back down to test that exact same green support line again. If buyers hold this trendline for the 3rd time, we are expecting a massive third-wave pump straight toward those higher targets drawn on the chart.
This setup gives us a super clean, high-probability entry as price comes down to retest support. RSI is resetting nicely during this pullback, coiling up for the next big leg up. As long as this trendline holds, the momentum favors a sharp bounce, giving traders a solid risk-to-reward ratio right off the line.
⚠️ LONG SETUP INVALIDATION: Our bullish idea is completely invalid if a 4-hour candle closes firmly below the rising support trendline, or if price breaks down and fails to reclaim it on a retest.
PUMPUSDT Forming Bullish MomentumPUMPUSDT is forming a clear bullish momentum pattern, a classic bullish wave signal that often indicates an upcoming breakout. The price has been consolidating within a narrowing range, suggesting that selling pressure is gradually weakening while buyers are beginning to regain control. With consistent trading volume confirming accumulation at lower levels, the current setup hints at a potential bullish breakout in the near future. The projected move could lead to an impressive gain of around 50% to 60% once the price breaks above the key resistance level.
This bullish momentum pattern is typically seen at the end of downtrends or corrective phases, representing a potential shift in market sentiment from bearish to bullish. Traders closely watching PUMPUSDT are noticing strengthening momentum as the price approaches a critical breakout zone. Strong trading volume adds confidence to this setup, showing that market participants are positioning early in anticipation of a sustained upward move.
Growing investor interest in PUMPUSDT reflects increasing confidence in the project's long-term fundamentals and its improving technical outlook. If the breakout is confirmed with sustained buying volume, it could mark the beginning of a fresh bullish leg. The ongoing consolidation phase suggests steady accumulation, creating favorable conditions for a strong continuation rally once the resistance level is cleared.
Traders may find this an attractive medium-term opportunity, especially as the bullish momentum pattern nears completion and buying pressure continues to build. A confirmed breakout could attract additional market participation and accelerate the move toward the projected upside target.
✅ Show your support by hitting the like button.
✅ Leaving a comment below! (What is You opinion about this Coin)
Your feedback and engagement keep me inspired to share more insightful market analysis with you!
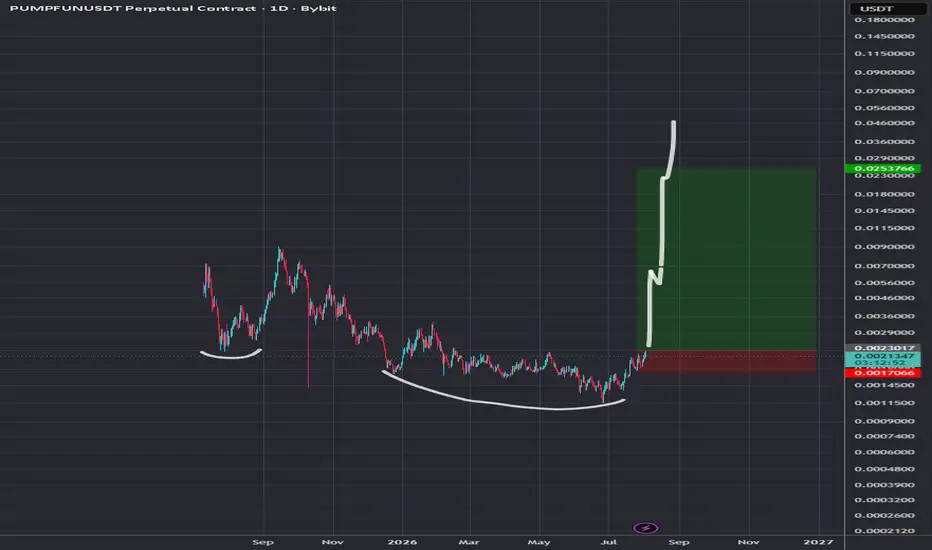
PUMP FUN MANIA [LONG] GEM signal I've been watching this chart quietly for months and it is finally breaking out.
This project is not just a nothing burger meme coin. It is a meme coin creation platform for Solana and is already top 50 rank on Coinmarketcap.
In an ALT szn regime, this is the best candidate to buy and hold until this bull rally is over!
see dominance chart and other supporting evidence below!
🧠DATA DRIVEN signals
FOLLOW and LIKE for more high quality BACKTESTED signals from proprietary ML grade models, capable of accurately inferring phase, amplitude and likelihood unlike any mechanical indicator out there.
Pumpfun Trading ideaBreak of the weekly and daily imbalance, with a shift in bias and emerging bullish momentum, driven by the high probability of a retest of previous equilibrium levels in price. No bullish algos activated for now; currently under observation.
The setup would be focused on these reaction points.
Not financial advice
PUMP USDT SHORT SIGNAL#78. PUMP/USDT – Trade Setup (SHORT)
📈 Position Type: SHORT
🕒 Timeframe: 1H
📊 Market: Futures
💰 Entry Zone:
0.001666
🛑 Stop-Loss:
0.001713
🎯 Take-Profit Targets:
• TP1: 0.001640
• TP2: 0.001613
• TP3: 0.001576
• TP4: 0.001530
⚙️ Leverage:
5 *10
▫️ After TP1, move SL to Entry + 0.2%.
▪️ Exit Plan:
• 40% at TP1
• 20% at TP2
• 20% at TP3
20% at. TP4
📌 Risk Management:
Risk only 1–2% of your capital per trade.
⚠️ Always check and confirm the setup on your chart before entering the trade.
⚠️
PUMPUSDT Forming Bullish MomentumPUMPUSDT is forming a clear bullish momentum pattern, a classic bullish wave signal that often indicates an upcoming breakout. The price has been consolidating within a narrowing range, suggesting that selling pressure is weakening while buyers are beginning to regain control. With consistent trading volume confirming accumulation at lower levels, the current setup hints at a potential bullish breakout in the near future. If the breakout is confirmed, the projected move could lead to an impressive gain of around 50% to 60%.
This bullish momentum pattern is commonly seen at the end of downtrends or corrective phases, signaling a potential shift in market sentiment from bearish to bullish. Traders closely watching PUMPUSDT are noticing strengthening momentum as the price approaches a key breakout zone. Healthy trading volume further reinforces this setup, indicating that market participants are positioning early in anticipation of a sustained upward move.
Growing investor interest in PUMPUSDT reflects increasing confidence in the project's long-term potential and its current technical structure. If buyers successfully push the price above resistance with sustained volume, it could mark the beginning of a fresh bullish leg. The ongoing consolidation phase suggests steady accumulation, creating favorable conditions for a strong continuation rally once the breakout is confirmed.
Traders may find this an attractive medium-term opportunity, especially as the bullish momentum pattern nears completion and buying pressure continues to build. A confirmed breakout could attract additional market participation and accelerate the move toward the projected upside target.
✅ Show your support by hitting the like button.
✅ Leaving a comment below! (What is You opinion about this Coin)
Your feedback and engagement keep me inspired to share more insightful market analysis with you!
PUMP Tests Weekly SupportPUMP is currently trading at a key weekly support, placing price at an important technical inflection point where the next major move is likely to develop. Following the recent correction, the market is approaching a strong demand zone that could provide the foundation for a bullish reversal if buyers step back into the market.
Just below the current price sits the 0.618 Fibonacci retracement, adding another layer of technical confluence to this support region. This Fibonacci level represents the first major demand area and is often where healthy pullbacks conclude before the broader trend resumes. As long as price remains above this confluence, the probability increases for a higher low to be established.
A successful defense of the weekly support and 0.618 Fibonacci would strengthen the current market structure and increase the likelihood of a reclaim of the existing trading range. Such a move would confirm renewed buying interest and open the probability of a rotational rally toward higher resistance levels.
However, failure to hold this support zone would weaken the bullish outlook and increase the risk of a deeper corrective move before demand returns.
For now, PUMP remains at one of the most significant technical areas on the chart. The reaction around the weekly support and 0.618 Fibonacci will likely determine whether buyers can regain control and initiate the next leg higher within the broader trend.
PUMPUSDT Forming Bullish MomentumPUMPUSDT is forming a clear bullish momentum pattern, a classic bullish wave signal that often indicates an upcoming breakout. The price has been consolidating within a narrowing range, suggesting that selling pressure is weakening while buyers are beginning to regain control. With consistent volume confirming accumulation at lower levels, the setup hints at a potential bullish breakout soon. The projected move could lead to an impressive gain of around 40% to 50% once the price breaks above the key resistance zone.
This bullish momentum pattern is typically seen at the end of downtrends or corrective phases, and it represents a potential shift in market sentiment from bearish to bullish. Traders closely watching PUMPUSDT are noting the strengthening momentum as it approaches a critical breakout area. Good trading volume adds confidence to this setup, showing that market participants are positioning early in anticipation of a sustained upward move.
Investors’ growing interest in PUMPUSDT reflects rising confidence in the project's long-term fundamentals and current technical strength. If the breakout confirms with sustained buying volume, this could mark the beginning of a fresh bullish leg. The ongoing consolidation phase suggests that buyers are steadily building positions while bearish pressure continues to weaken, creating favorable conditions for further upside.
Traders might find this a valuable setup for medium-term gains, especially as the bullish momentum pattern nears completion and buying momentum continues to strengthen. A confirmed breakout above resistance could attract additional market participation and potentially drive the price toward its projected upside target over the coming weeks.
✅ Show your support by hitting the like button!
✅ Leave a comment below! (What is your opinion about this coin?)
Your feedback and engagement keep me inspired to share more insightful market analysis with you!
PUMP: bullish spike toward $0.0019The Macro Picture 🗺️
PUMP unwound from its $0.00225 May peak in a steady descending structure that bottomed on the $0.00125 macro floor in late June. That floor caught the flush cleanly, and price has since built a recovery back to $0.00165 with RSI climbing through the midline. The down-leg looks exhausted, and the reclaimed ground puts the overhead supply — the same band that hosted the spring range — back within reach.
The Setup ⚙️
The Reaction: The $0.00125 floor held and price has reversed in a series of higher lows, with RSI turning up to confirm demand returning. Buyers have taken back control of the near-term tape, tilting the path of least resistance upward toward the first supply overhead.
The Ceiling: The $0.00175 decision is the immediate test — the level that capped the breakdown before the June flush. Reclaiming it flips the near-term structure and clears the way to the $0.0019 macro resistance.
The Roadmap: Primary target sits at $0.0019 — the macro resistance and base of the old spring range, where the green roadmap points once $0.00175 gives way. Invalidation: a sustained 1D close below $0.0015 would invalidate this bullish reaction and reopen the path back toward the $0.00125 macro floor.
PUMP | 02 July 2026PUMPUSDT position | 4h Chart (Entry on H1)
Follow price BINANCE:PUMPUSDT.P
❇️ Analysis Description: Price is currently within a trading range. I am monitoring the key structural levels to identify an FZ-Pullback setup on the H1 timeframe for a high-probability entry.
🔼 Buy-sell Setup:
Long: Breakout above 0.001614 and retest.
Short: Breakdown below 0.001386 and retest.
🕯 Entry Plan (1-Hour Confirmation):
Trend/Range Analysis: Determine if price is trending or in a trading range on the H1 timeframe.
Pullback Candle Identification: Identify the first candle that breaks the previous structural high/low (with at least 80% of its body).
Entry: Wait for a retest of the Pullback Candle’s extreme line (or the broken static/dynamic level) with a confirmation candle.
Stop Loss: Behind the last major swing point for maximum security.
Take Profit: R:R 2.5 for trending markets; R:R 1.5 - 2.0 for range-bound markets.
⚠️ Please follow proper risk management.
💬 Leave your thoughts in the comments or message me directly for details!
PUMPUSDT — Reversal Opportunity or Another Bear Trap?On the 2D timeframe, PUMPUSDT is still trading within a well-defined Falling Channel that has been in place since its peak in September 2025. Over the past several months, the price has continued to print lower highs and lower lows, confirming that the primary trend remains bearish 🔻.
However, the price is now approaching the upper resistance trendline of the channel ⚠️, making this a critical area that could determine the next major market direction.
Interestingly, after multiple rebounds from the channel support, selling pressure appears to be weakening while the price is forming a consolidation structure 🧩. This type of price action often represents an accumulation phase before a significant move.
---
📉 Pattern Formation: Falling Channel
The primary pattern visible on this chart is a Falling Channel (Descending Channel).
✨ Pattern Characteristics:
📌 Price continues to move within two downward-sloping parallel trendlines.
📌 The upper trendline acts as dynamic resistance.
📌 The lower trendline serves as dynamic support.
📌 Every rally has been rejected at the channel resistance.
📌 Every decline has so far found buying interest at the channel support.
From a technical perspective, a Falling Channel is often considered a bullish reversal pattern 🚀 if price successfully breaks above the upper resistance with strong trading volume. Until that breakout occurs, however, the prevailing bearish trend remains intact.
---
🟢 Bullish Scenario
A bullish confirmation would only occur if price manages to:
✅ Break out and close above the Falling Channel resistance.
If the breakout is confirmed, the next potential upside targets are:
🎯 Target 1
0.0018359
This is the nearest horizontal resistance level and a previous distribution zone.
---
🎯 Target 2
0.0022002
A key resistance level that could become the next upside target if buying momentum continues to strengthen.
---
🎯 Target 3
0.0030685
This represents the major resistance area and the next bullish objective if a medium-term trend reversal develops.
💡 Note: The stronger the breakout volume, the greater the probability that PUMPUSDT enters a medium-term reversal phase.
---
🔴 Bearish Scenario
As long as the channel resistance remains unbroken, the primary trend continues to favor the bears.
⚠️ The bearish scenario becomes more likely if:
❌ Price is rejected once again at the channel resistance.
❌ Price fails to hold above the channel support.
If the lower channel support breaks with strong selling volume, PUMPUSDT could print a new lower low and continue its downtrend before reaching the next significant demand zone 📉.
For that reason, the lower boundary of the channel remains a crucial level that buyers must defend 🛡️.
---
📌 Conclusion
PUMPUSDT is currently trading at one of its most critical technical levels in recent months ⏳.
The Falling Channel structure remains valid, but the price is approaching a potential breakout zone that could trigger a major trend reversal if supported by increasing trading volume 🔥.
Until a confirmed breakout occurs, waiting for confirmation is a more prudent strategy than entering aggressively 🎯.
The price reaction around this area will likely determine PUMPUSDT's direction over the coming weeks 🚀📊.
---
#PUMPUSDT #PUMP #Crypto #Cryptocurrency #TechnicalAnalysis #ChartAnalysis #Altcoins #Bullish #Bearish #Breakout #FallingChannel #Trendline #Support #Resistance #PriceAction
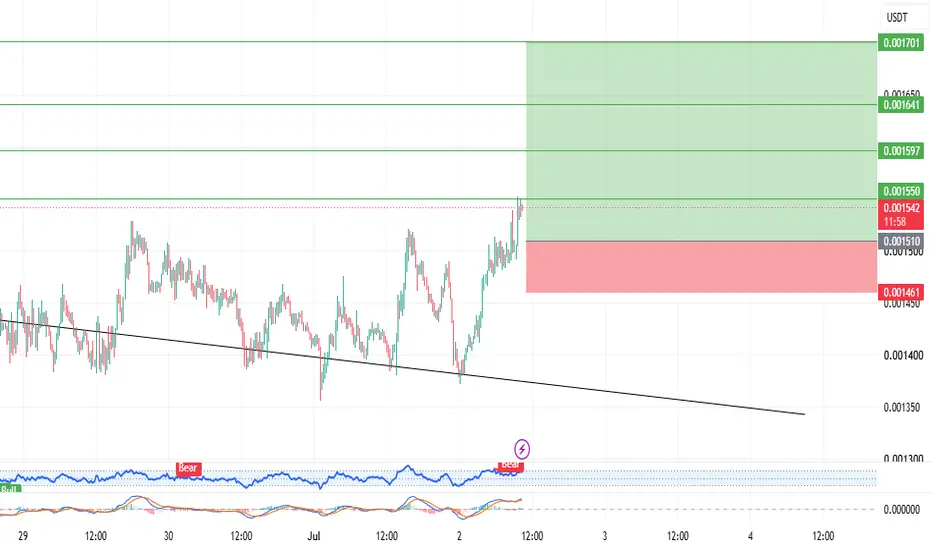
PUMP USDT LONG SIGNALPupm/USDT – Trade Setup (LONG)
📈 Position Type: LONG
🕒 Timeframe: 1 H
📊 Market: Futures
💰 Entry Zone:
0.001511
🛑 Stop-Loss:
0.001460
🎯 Take-Profit Targets:
• TP1: 0.001550
• TP2: 0.001597
• TP3: 0.001641
• TP4: 0.0017
TP5:
TP6:
⚙️ Leverage:
5- 3
⚠️ After reaching TP1, move Stop-Loss to Entry Price.
📌 Risk Management:
Risk only 1–2% of your capital per trade.
Always confirm the setup on your chart before entry
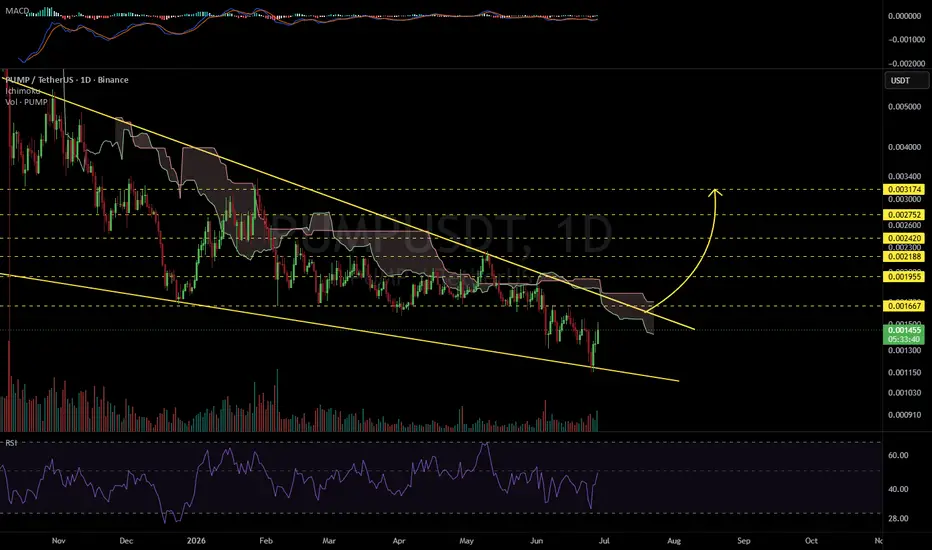
PUMPUSDT 1D#PUMP is moving inside a falling wedge pattern on the daily chart. It has bounced off the wedge support and looks interesting.
In case of a breakout above the wedge resistance, the potential upside targets are:
🎯 $0.001667
🎯 $0.001955
🎯 $0.002188
🎯 $0.002420
🎯 $0.002752
🎯 $0.003174
⚠️ Always remember to use a tight stop-loss and maintain proper risk management.
PUMPUSDT Forming Falling WedgePUMPUSDT is forming a clear falling wedge pattern, a classic bullish wave signal that often indicates an upcoming breakout. The price has been consolidating within a narrowing range, suggesting that selling pressure is weakening while buyers are beginning to regain control. With consistent volume confirming accumulation at lower levels, the setup hints at a potential bullish breakout soon. The projected move could lead to an impressive gain of around 90% to 100% once the price breaks above the wedge resistance.
This falling wedge pattern is typically seen at the end of downtrends or corrective phases, and it represents a potential shift in market sentiment from bearish to bullish. Traders closely watching PUMPUSDT are noting the strengthening momentum as it nears a breakout zone. Strong trading volume adds confidence to this pattern, showing that market participants are positioning early in anticipation of a reversal.
Investors’ growing interest in PUMPUSDT reflects rising confidence in the project's long-term fundamentals and current technical strength. If the breakout confirms with sustained volume, this could mark the start of a fresh bullish leg. The current market structure suggests that buyers are steadily gaining control while bearish pressure continues to fade, creating favorable conditions for a significant upward move.
Traders might find this a valuable setup for medium-term gains, especially as the falling wedge pattern approaches completion and buying momentum accelerates. A confirmed breakout could attract increased market participation and potentially drive the price toward substantially higher levels over the coming weeks.
✅ Show your support by hitting the like button!
✅ Leave a comment below! (What is your opinion about this coin?)
Your feedback and engagement keep me inspired to share more insightful market analysis with you!
PUMP/USDT — Elliott Wave + SMC Confluence Setup (30m)Clean confluence between Elliott Wave and SMC here: both wave (2) and wave (4) corrections stalled right inside order blocks, and structure keeps breaking lower (BOS) each leg down.
Wave 4 retraced to 0.382. Since wave 3 is extended, eyeing a 0.618 extension of (1+3) for the wave 5.
Not a signal, just sharing structure. Invalidated above wave (4) high (~0.001315).
$PUMPUSDT volume just surged 90.6% in 24 hours — and price is...🔥 BINANCE:PUMPUSDT volume just surged 90.6% in 24 hours — and price is sitting on the exact level that decides everything.
📰 24H News Snapshot
BINANCE:PUMPUSDT 's 24H trading volume hit $61.5M — a ~5% jump from the day prior, signaling a sharp rise in market activity. Pump.fun was recently named among 11 top altcoins to watch as analysts cite potential for a narrative-driven rally during broader altcoin rotation. The platform has also launched its new "GO" decentralized bounty system in June 2026, adding a fresh utility catalyst.
📊 Market Bias: Cautiously Bullish
Demand zone holding + volume expansion + altcoin rotation narrative = setup has merit. ADX at 19.50 warns trend is still weak — patience is the edge here.
🎯 Trade Levels
📍 Entry Zone: $0.001400 – $0.001417
🛑 Stop Loss: $0.001367 (-3.6% | Risk: 1–2% of portfolio max)
🎯 TP1: $0.001526 (+7.7% | 2.1:1 RR)
🎯 TP2: $0.001667 (+17.6% | 4.9:1 RR)
📐 Overall R:R: up to 4.9:1
🧠 Chart Analysis
Price recently swept lows near $0.001341 and bounced hard into the established demand zone at $0.001417. This is a classic liquidity sweep — market makers clear stops below support before reversing.
The 4H chart shows a strong rejection wick off the lows, and price is now consolidating inside the entry box. Invalidation: a 4H close below $0.001367 cancels the setup.
🛡️ Risk Management
ADX at 19.50 means there's no strong trend yet — keep position size small (1–2% of capital). Do NOT use leverage until a confirmed 4H close above $0.001526.
📚 Educational Nugget
A volume spike after a liquidity sweep is one of the highest-probability setups in technical analysis. Most retail traders see the dip and sell — institutions are the ones buying it. Volume tells you who's actually in control.
Most traders freeze when they see a volume spike at a key level — not knowing whether to buy or run.
The chart already told you. The sweep happened. The volume confirmed it. Now it's just about execution.
💬 Where's your TP set? Drop it below 👇
#PUMP #PumpFun #CryptoTrading