PUMP Could CRASH to $0.0016 as Middle East War Fears GrowHi,
I'm becoming increasingly bearish on PUMP. Daily resistance keeps pushing the price lower, while the Head and Shoulders formation adds another warning sign. With fundamental risks also mounting, $0.0016 is my first downside target, although I believe there's room for a much deeper correction.
Thanks.
PUMP / TetherUS
No trades
No trades
In-depth trading ideas
PUMP Daily – Bullish Cypher at the PRZ after a heavy sell-offPUMP has been bleeding hard (around -40% in a month), but the drop just landed on a textbook bullish Cypher on the daily.
X at the July low, A at the August high, B pulled back to 0.503, C pushed above A to 1.662, and D is sitting right on the 0.786 retracement of XC. That's the Cypher sweet spot.
The PRZ is 0.00245 – 0.00255 and price is trading right inside it now.
Plan:
- Buy zone: 0.00245 – 0.00255
- TP1: 0.00416
- TP2: 0.00518
- Invalidation: a daily close below 0.00236
Momentum is stil
$PUMP Long After One More Leg DownNYSE:PUMP rallied aggressively in October while the rest of the crypto market was falling, gaining over 500%. So while other cryptocurrencies have almost returned to their autumn lows, NYSE:PUMP is still trading significantly higher and has plenty of room for further correction.
But a potential long setup is already taking shape 👇
Price is approaching a two-month descending resistance trendline, with a potential breakout coming soon.
CMF shows a divergence with price. Throughout the co
PUMP Daily Outlook: Oversold Bounce Stalls Below Internal Daily PUMP has corrected into the region of a weekly support level. Price never cleanly tapped it, but the approach was enough to trigger an oversold bounce. That reaction shows some buyers are active near this higher time frame zone, but the bounce hasn’t yet changed the broader corrective structure.
PUMP is now trading below an internal daily resistance level, and that is the key area to watch. Oversold bounces often run out of momentum when they meet overhead supply, and this level marks where sel
PUMP Daily: Sweep, Reclaim, and a Plan to 0.0068PUMP/USDT (1D)
PUMP rallied from the 0.001149 low to 0.006809, then corrected almost 50%. Price has now returned to the 0.0034 – 0.0035 support, the September low, and the daily candle swept below it and closed back above.
What the chart shows:
0.0034 is the key horizontal support. It held in September and is holding again.
The recent wick below the level was bought back, so the sweep took the stops under the support and failed to continue.
The red VWAP from the top (~0.0048) is declining and
PUMPUSDT – Head and Shoulders Pattern Signals Further DownsideIt looks like PUMPUSDT has finally lost the momentum behind its previous rally. On the daily chart, we can see a fairly clear head and shoulders pattern, with each recovery after the main peak showing less strength. And now, price has broken below the neckline.
I'm particularly interested in how price moved away from the 0.0033–0.0035 area . This was a key zone buyers needed to defend to keep the recovery alive, but they failed to do so. If price comes back to retest this area and struggles to
PUMP/USDT: Key Support Test – 97% Upside Potential?PUMP trades near $0.00345, testing a key support zone. RSI remains weak at 36, while MACD signals bearish momentum. A liquidity sweep and reclaim of $0.003440 is needed to confirm a potential long setup.
Fundamentally, Pump.fun's revenue and token buybacks offer support, but the 6.88B PUMP token unlock on November 14 could increase selling pressure.
If support holds, $0.005427 is the first resistance, followed by $0.006780 (+97%). A breakdown could push price toward $0.002364 and $0.001686.
T
PUMP — Bullish Rebound or Further Correction?PUMP is currently approaching and retesting a significant support zone located between $0.00305 – $0.00355.
This area is worth monitoring because price previously experienced a significant upward move after breaking away from its lower consolidation range.
📈 After establishing a low around $0.001154, PUMP staged a strong recovery, eventually reaching a high of $0.006805.
However, following that peak, the price entered a corrective phase, with selling pressure gradually pushing it back toward
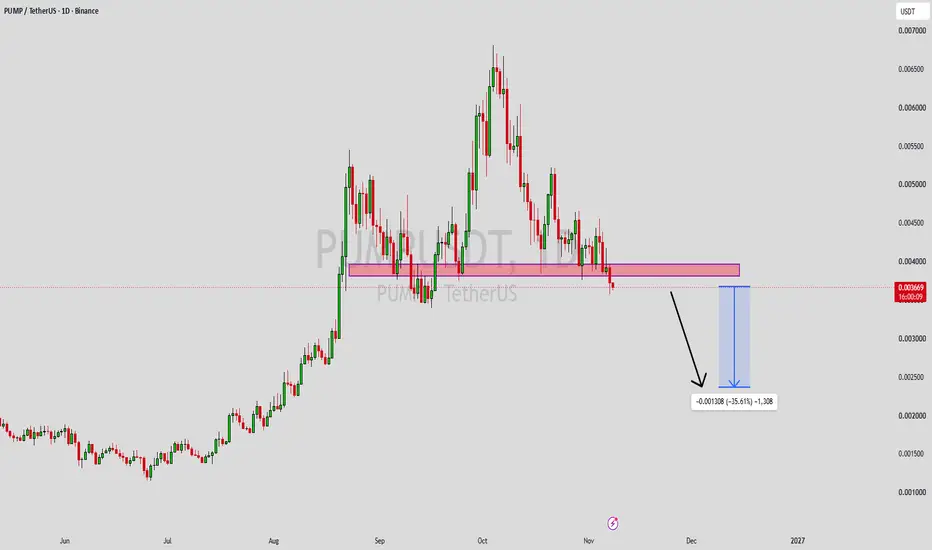
PUMPUSDT Forming Bearish PatternPUMPUSDT has slipped below a major safety net. After peaking above $0.0068 last month, the price has been sliding downwards, and it just broke underneath the key $0.0038–$0.0040 floor. Buyers did a good job protecting this level back in late summer, but sellers have taken over and turned that old support zone into a ceiling, pulling the token down to around $0.00367.
Because this base cracked, the chart suggests more downside could be on the way. The setup points toward an open drop down to
Back to our PUMP,#Idea #PUMP
Back to our PUMP, and the wedge played out exactly as we expected!
Pro PUMP:
🧬 Fundamentals: Pump.fun is a SocialFi and DEX project in DeFi. Protocol TVL is $329.38M (down 17.5% over 30 days), open interest fell 7.5% in a week, perp funding is almost flat at +0.0053% per 8h and 54.3% of accounts are short.
📉 As expected, the asset dropped out of the wedge and started its correction after a retest from below. There are 3 main lows to collect, marked in white: 0.003784, 0.003437 and
PUMP Token: Value Area High Rejection and Key Support LevelsPUMP price action has recently rejected from the Value Area High (VAH), which aligns with the 0.618 Fibonacci retracement level. This confluence represents an area of technical resistance where selling pressure has emerged, potentially opening the door to a corrective move if sellers maintain control.
If the rejection continues, price could move towards the dynamic support zone below, where multiple technical confluences may provide an area of interest for buyers. This region will be important
PUMP / USDT (BULLISH REVERSAL SETUP)Market Structure & Technical Outlook
Price has been in a bearish trend; however, a potential bullish reversal is developing, supported by bullish RSI divergence on the 4H timeframe.
A breakout above the previous Lower High (LH) could signal a potential shift in market structure from bearish to bullish. Therefore, the trade will be triggered upon confirmation of the LH breakout.
Trade Plan
Buy Stop: 0.0048, placed above the LH breakout level.
Stop Loss: 0.003884, placed at the previous Lower
PUMP weekly: the base is built, here is the 5x to 10x bull caseWeekly map for PUMP (pump.fun) on Binance spot, log scale. Drawn Oct 19, 2026 with price near 0.0045, about $2.1B circulating market cap.
The chart:
Listed Sep 2025, topped at 0.0090 in the listing week, then bled about 87% into a June 2026 low of 0.00115. March to July 2026 built a 10-month base between 0.0012 and 0.0021. The August breakout came on the biggest volume since launch, the 10w SMA crossed above the 20w, and September printed a higher low at 0.0034 before running to 0.0068. Last we
PUMPUSDT is going DownAs you can see, there was an accurate uptrend, dashed. We have broken from below of it, which led to strong continuation to the downside.
Expecting to see further move real soon.
We are expecting to see a massive move if this is correct, the first target will be at around 10% unleveraged.
Pump dip before a run to 0.009Hey guys
Sharing with you a great idea for buying pump
Currently price is at a support
Expecting a retracment and continuation of the trend towards taget around 0.009$
PUMP broke a major structure at daily and weekly time frame.
levels were shared before in a mind to be bought as an massive opportunity
SL is placed under the rectangle almost under 0.0051 (less than 1%)
NFA
DYOR
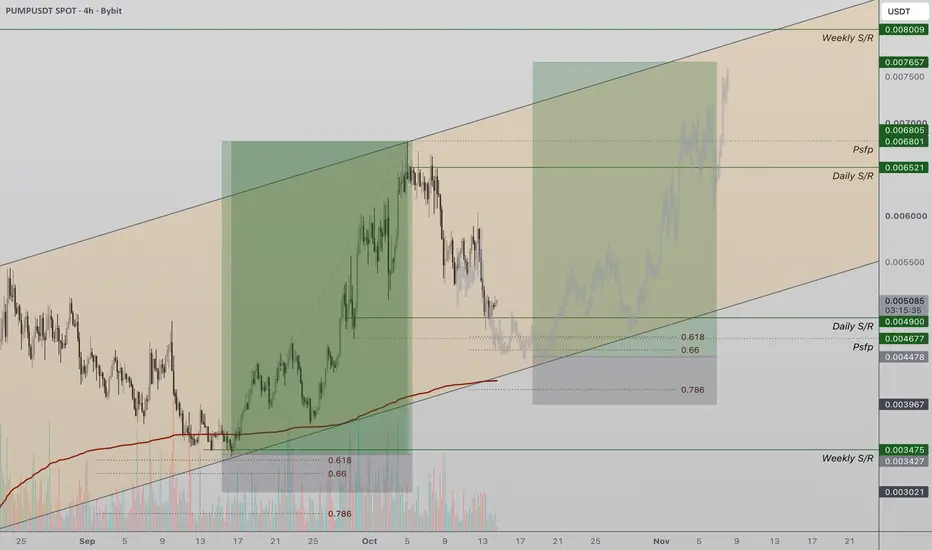
PUMP: Rising Channel Structure Signals Potential Rotational MovePUMP price action continues to trade within a broader rising channel on the higher timeframes, with the recent rejection from channel-high resistance suggesting a potential rotational move towards lower channel support.
From a technical perspective, the rejection at the upper boundary indicates that selling pressure remains present around this resistance region. As a result, price action is now rotating lower within the established channel structure, with the next key area of interest being the
PUMP: A Potential Daily Head & ShouldersWeekly Rounded Bottom Remains Constructive
PUMP has staged an impressive recovery following months of consolidation, developing a rounded bottom with the potential to form a larger cup-and-handle pattern. The recent rally towards $0.006806 reinforces the improving longer-term structure, although the pattern remains incomplete.
Weekly EMAs Support the Recovery
The 21/8-week EMAs remain bullishly crossed, with price trading comfortably above both averages. Weekly RSI also remains above 50, alt
PUMPUSDT 1W: one more push to 0.008861, then the wedge breaks💊 PUMP keeps climbing inside a rising wedge, and wedges like this usually end with a sharp turn.
PUMP technicals:
Right now the weekly sits at 0.005624, just above 0.005261 support, inside a rising wedge that started near the 0.001659 lows. Each new high comes from a smaller push, the wedge keeps narrowing, and RSI has climbed to around 70 after the run. Under price are the breakout zones, with 0.003524 and the 0.002868-0.002891 band as the key levels. The old highs sit at 0.008861, so that is
Range High Resistance & Higher-Low SetupPUMP price action is currently trading into range-high resistance, where a new daily resistance level has been established. This region is likely to remain an important area of supply, particularly if price begins showing signs of rejection or weakening momentum.
A correction from the current resistance zone could open the probability of a retest toward daily support, which carries strong technical confluence with the 0.618 Fibonacci retracement and the lower boundary of the established channel
Pump Price Continues to Trade in a Trading ChannelPUMP price action has recently rejected from the upper boundary of its established trading channel, creating the potential for a rotation back toward channel support. This support region also aligns with the 0.618 Fibonacci retracement, giving the area additional technical confluence and making the reaction there important for the broader structure.
If price retests this confluence zone and manages to hold above it, the existing channel structure would remain intact. A sustained reaction from s