PYTH Bulls Trapped? | Wyckoff DistributionYellow Paradisers! What if #PYTHUSDT has already completed its distribution and is preparing for the next markdown phase?
💎#PYTHUSDT is respecting a textbook Wyckoff Distribution. After forming a Buying Climax (BC), Automatic Reaction (AR), and multiple Secondary Tests (ST), price printed a UTAD (U
PYTH: local squeeze with $0.06 destinationThe Macro Picture 🗺️
PYTH bottomed at $0.030 in June and has run a clean impulse back to $0.050 — a rising sequence of higher highs and higher lows. Momentum is firmly with the buyers: RSI is riding the upper band near 72, the sign of a trend that's being led, not faded.
The Setup ⚙️
The Momentum
$PYTH HOLDERS: THIS LEVEL DECIDES EVERYTHING!XETR:PYTH HOLDERS: THIS LEVEL DECIDES EVERYTHING!
XETR:PYTH is approaching one of the most important areas on the chart. The overall structure is still bullish because higher lows are being respected, but price is currently trading below the major resistance zone around $0.061-$0.062. This is no
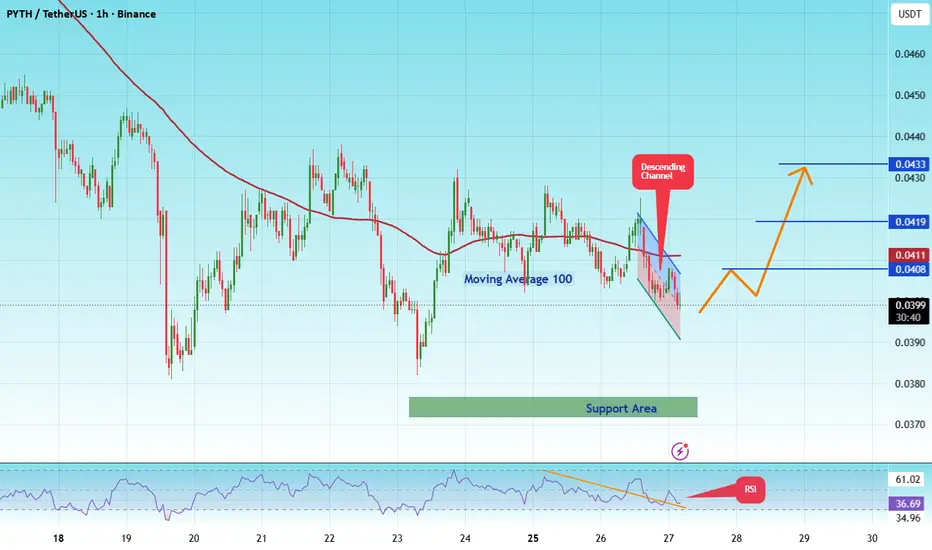
#PYTHUSDT Forming Bullish Momentum#PYTH
The price is moving within a descending channel on the hourly timeframe. It has reached the lower boundary and is trending towards a bounce. A retest of this boundary is expected.
The Relative Strength Index (RSI) indicates a downward trend, and this trend is likely to continue due to the ov
PYTHUSDT Forming Falling WedgePYTHUSDT is forming a clear falling wedge pattern, a classic bullish wave signal that often indicates an upcoming breakout. The price has been consolidating within a narrowing range, suggesting that selling pressure is weakening while buyers are beginning to regain control. With consistent volume co
PYTH LONG SETUP + FUNDAMENTAL ANALYSIS1. Price tapped in to the Daily FVG and this propelled price to create a BOS - break structure
2. Price reverted to discount after delivering price to OB Monthly M.T (in yellow)
3. Price tapped into the H3/H4 OB
4. We have a discount CISD - false CISD hence delivery must be on the premium (our draw)
PYTHUSDT Forming Falling WedgePYTHUSDT is forming a clear falling wedge pattern, a classic bullish wave signal that often indicates an upcoming breakout. The price has been consolidating within a narrowing range, suggesting that selling pressure is weakening while buyers are beginning to regain control. With consistent volume co
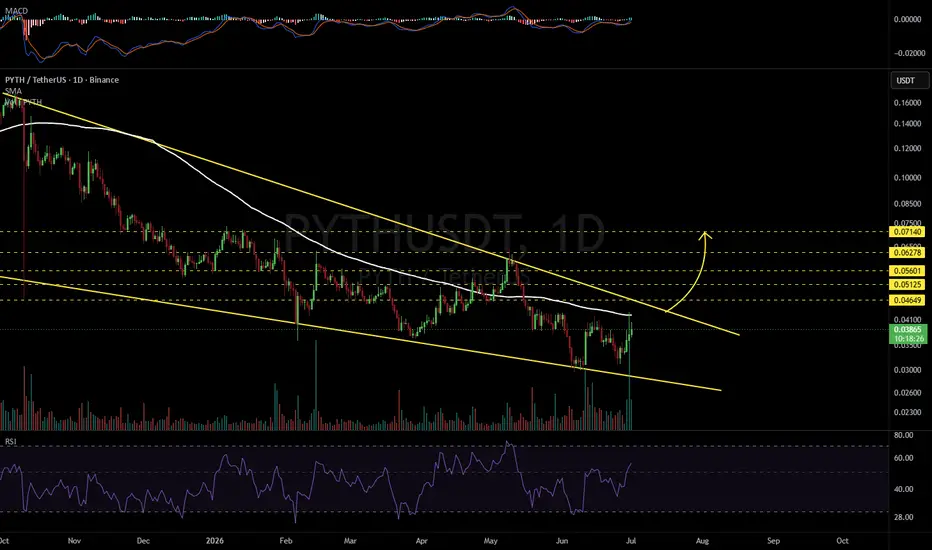
PYTHUSDT 1D#PYTH is moving inside a falling wedge pattern on the daily chart. In case of a breakout above the wedge resistance and the daily SMA100, the potential upside targets are:
🎯 $0.04649
🎯 $0.05125
🎯 $0.05601
🎯 $0.06278
🎯 $0.07140
⚠️ Always remember to use a tight stop-loss and maintain proper risk ma
#PYTH Possible Scenario Primary Trend: Uptrend. Price action experienced a sharp bullish expansion starting around June 29, characterized by strong green consecutive candles making higher highs and higher lows.
Secondary Trend (Correction): A healthy pullback occurred after peaking near 0.03800. The asset retraced to test
See all ideas
Summarizing what the indicators are suggesting.
Oscillators
Neutral
SellBuy
Strong sellStrong buy
Strong sellSellNeutralBuyStrong buy
Oscillators
Neutral
SellBuy
Strong sellStrong buy
Strong sellSellNeutralBuyStrong buy
Summary
Neutral
SellBuy
Strong sellStrong buy
Strong sellSellNeutralBuyStrong buy
Summary
Neutral
SellBuy
Strong sellStrong buy
Strong sellSellNeutralBuyStrong buy
Summary
Neutral
SellBuy
Strong sellStrong buy
Strong sellSellNeutralBuyStrong buy
Moving Averages
Neutral
SellBuy
Strong sellStrong buy
Strong sellSellNeutralBuyStrong buy
Moving Averages
Neutral
SellBuy
Strong sellStrong buy
Strong sellSellNeutralBuyStrong buy
Displays a symbol's price movements over previous years to identify recurring trends.