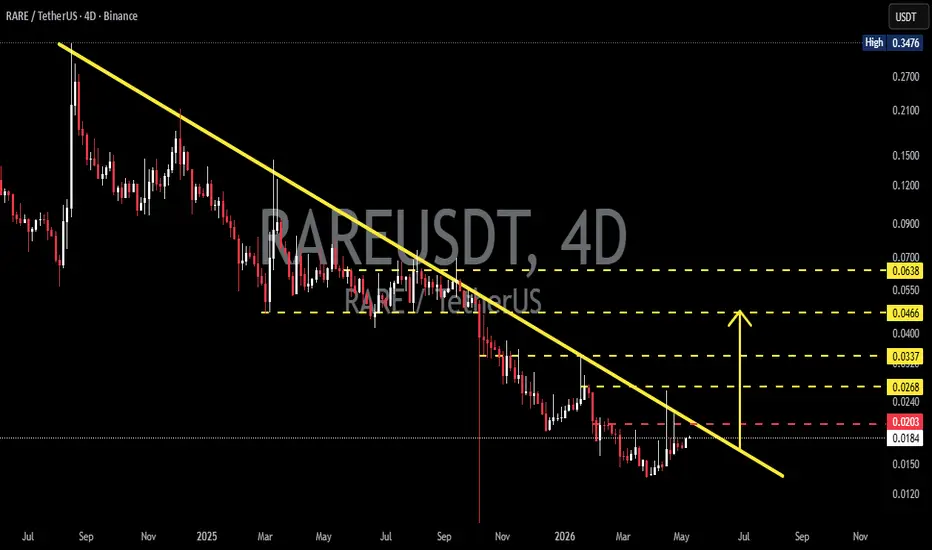
RAREUSDT — Beginning of a Reversal or Fake Rally?RAREUSDT on the 4D timeframe is still moving within a major long-term downtrend structure from its previous peak. However, the current price action is starting to show signs of recovery after successfully holding the lower support zone and moving back toward the main descending trendline. 🔍
The yel
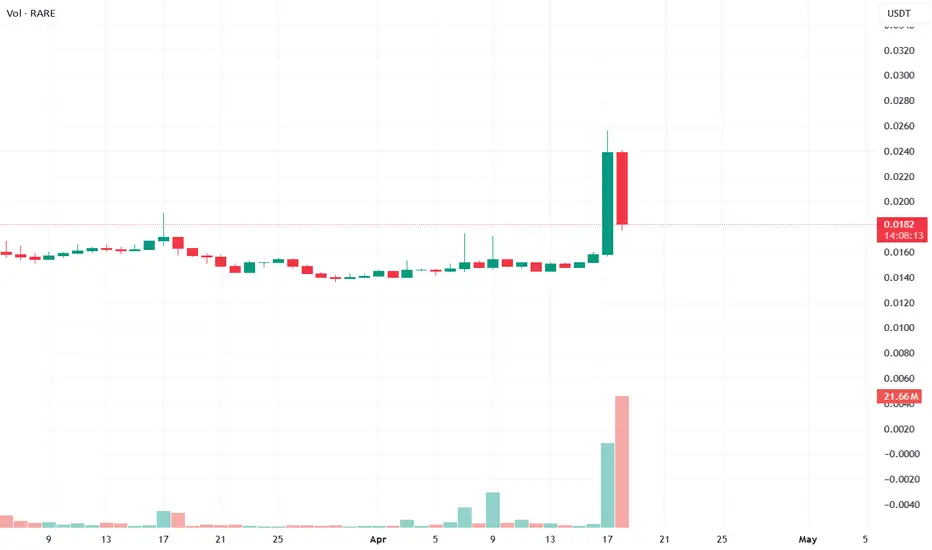
14-04-26 Drama on the Brink of RARE"Only at RARE, the price of seblak is more expensive than the price of the token. But wait...!" 🐳🍲
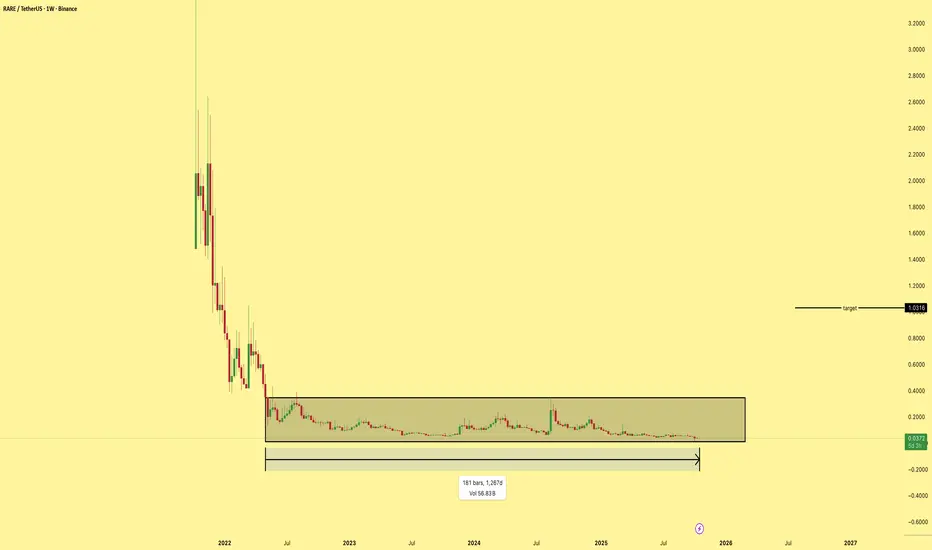
Imagine walking through a flea market and finding an antique that's already at rock bottom, but no one wants to look at it because it's so shabby. That's RARE's fate this week. Weekly, this coin is alr
RAREUSDT Bear Exhaustion + Floor Bottom... Reversal Setup Loading
RAREUSDT prints 0.0182 spot against 0.0181 futures with F/S ratio running 6.63x↓ at 9.9% percentile — Floor territory. Volumes pair 337.07M spot / 6.13M USDT versus 2.25B futures / 40.95M USDT — premium -0.6% Xtreme Backwardation at Z -1.5, yield tagged Bull -662% APY at
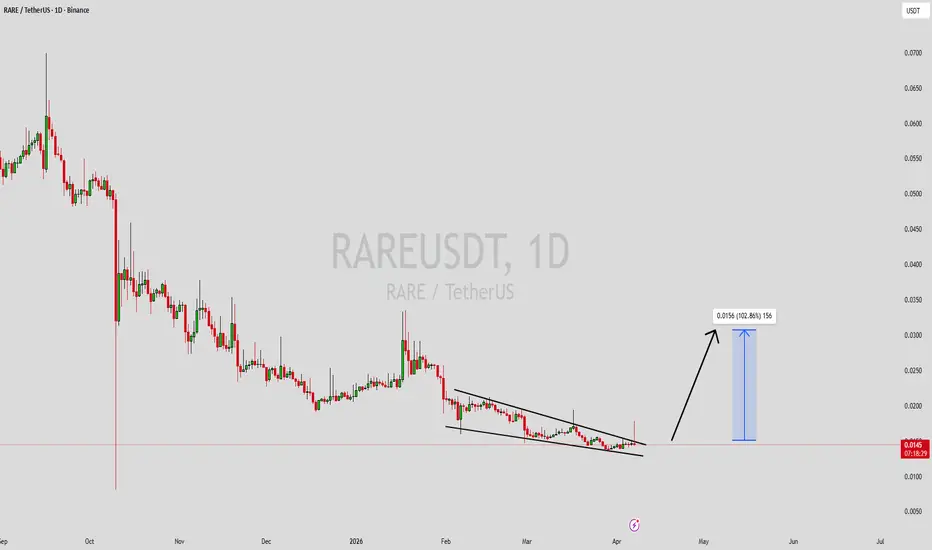
RAREUSDT Forming Falling WedgeRAREUSDT is forming a clear falling wedge pattern, a classic bullish reversal signal that often indicates an upcoming breakout. The price has been consolidating within a narrowing range, suggesting that selling pressure is weakening while buyers are beginning to regain control. With consistent volum
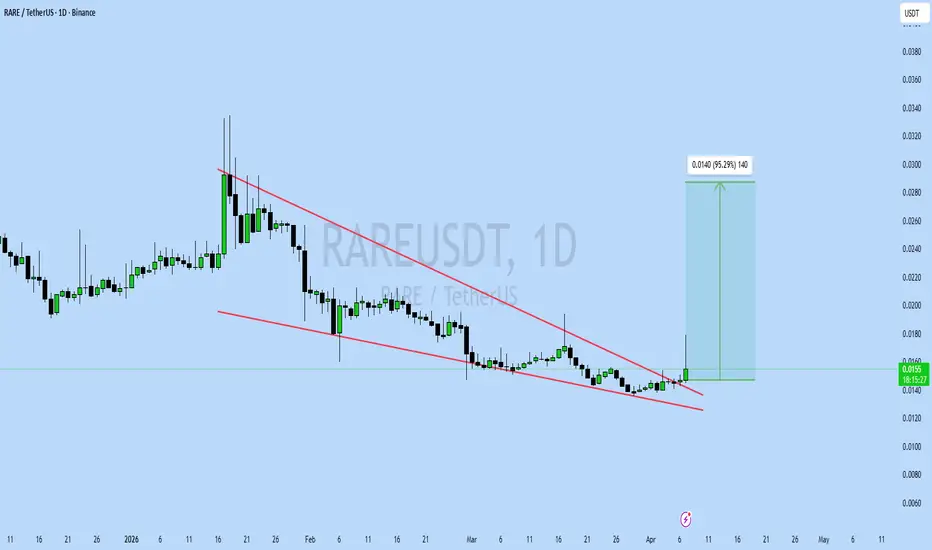
RAREUSDT UPDATENASDAQ:RARE Technical Setup Pattern: Falling Wedge Breakout Current Price: $0.0157 Target Price: $0.0280, $0.0300 Target % Gain: 95.29% RARE is breaking out of a falling wedge on the 1D timeframe with price pushing above the descending resistance and early volume support signaling a potential trend
SUPER – Support Breakdown, Bearish Momentum BuildingSUPER has been consolidating for several days around the 0.0156 support zone, forming a clear horizontal structure after the previous sell-off.
Price has now broken below this key support level, suggesting that the consolidation phase may be ending and that sellers could be preparing for another mo
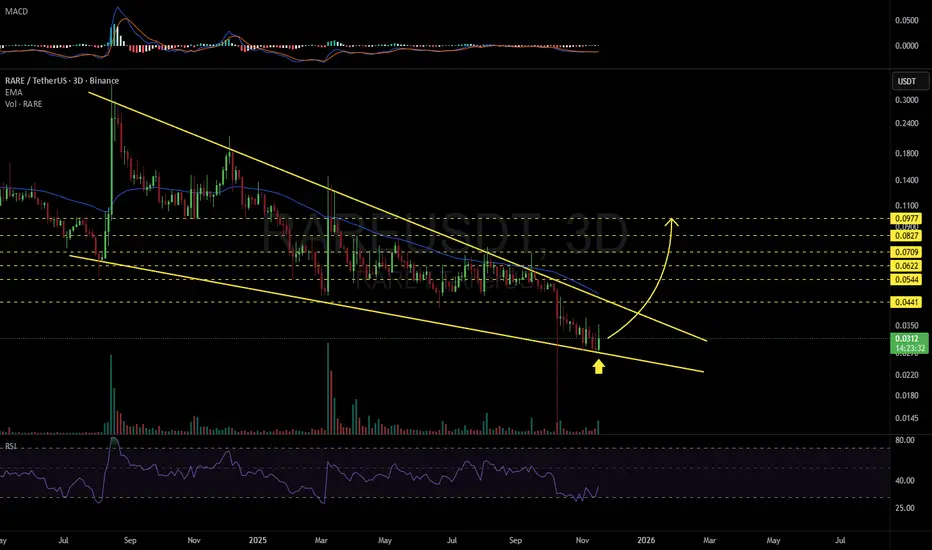
RAREUSDT 3D#RARE is moving inside a falling wedge on the 3-day timeframe. It appears to have found support near the wedge’s lower boundary and has bounced from that level. If price breaks above the wedge resistance, the potential targets are:
🎯 $0.0441
🎯 $0.0544
🎯 $0.0622
🎯 $0.0709
🎯 $0.0827
🎯 $0.0977
⚠️ Alw
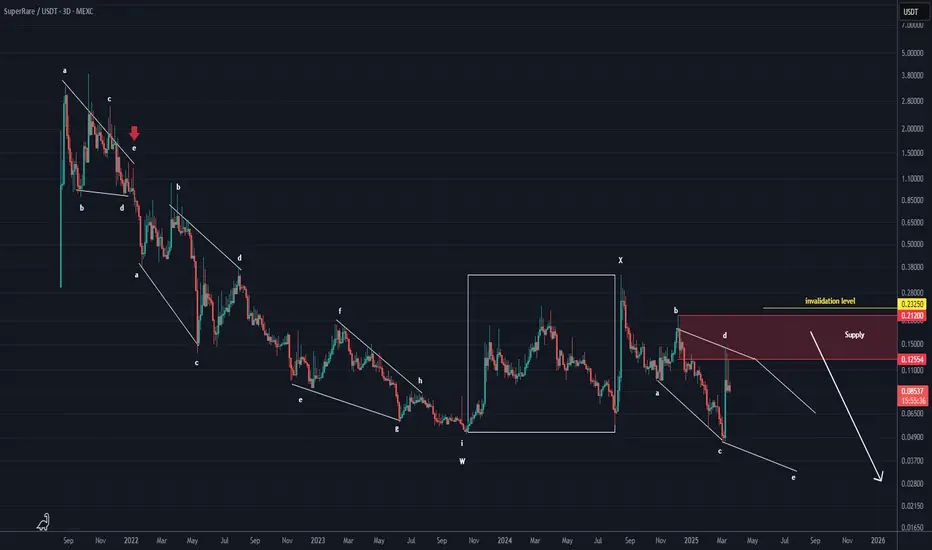
RARE Analysis (3D)From the point where we placed the red arrow on the chart, the RARE correction has begun.
It appears that we have a double correction on the chart, and now the second phase of this correction has started.
After the completion of wave X, a supply zone has formed, which seems to act as the price cei
See all ideas
Summarizing what the indicators are suggesting.
Oscillators
Neutral
SellBuy
Strong sellStrong buy
Strong sellSellNeutralBuyStrong buy
Oscillators
Neutral
SellBuy
Strong sellStrong buy
Strong sellSellNeutralBuyStrong buy
Summary
Neutral
SellBuy
Strong sellStrong buy
Strong sellSellNeutralBuyStrong buy
Summary
Neutral
SellBuy
Strong sellStrong buy
Strong sellSellNeutralBuyStrong buy
Summary
Neutral
SellBuy
Strong sellStrong buy
Strong sellSellNeutralBuyStrong buy
Moving Averages
Neutral
SellBuy
Strong sellStrong buy
Strong sellSellNeutralBuyStrong buy
Moving Averages
Neutral
SellBuy
Strong sellStrong buy
Strong sellSellNeutralBuyStrong buy
Displays a symbol's price movements over previous years to identify recurring trends.