RaveDAO / Tether
No trades
No trades
In-depth trading ideas
RAVEUSDT Near Critical Support Bounce or Breakdown?RAVE continues to grind lower within a descending channel and is slowly approaching a major external demand zone. This area is expected to provide strong support for the bulls and could trigger a meaningful recovery toward the internal supply zone. However, failure to defend this demand zone would invalidate the bullish scenario and open the door for a deeper decline, likely leading to the formation of a fresh lower low.
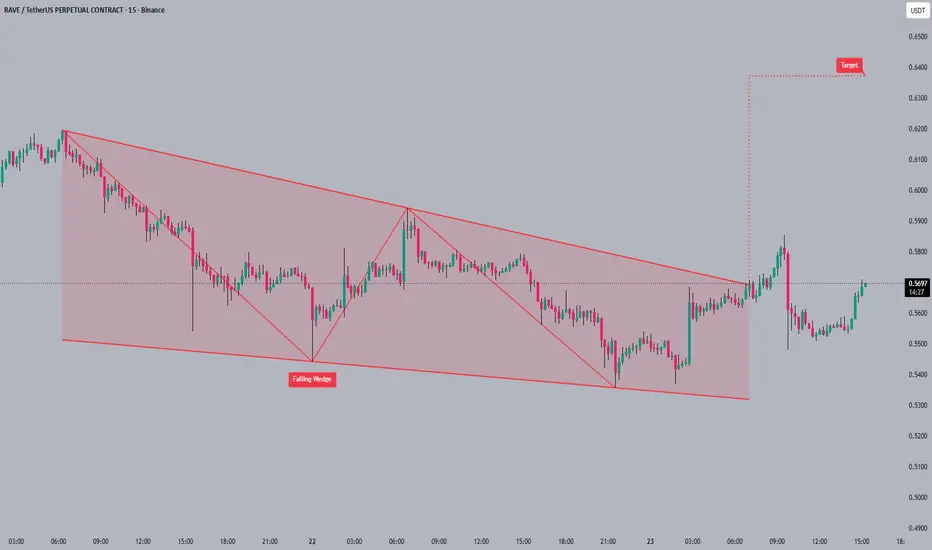
RAVEUSDT Forming Falling WedgeRAVEUSDT is forming a clear falling wedge pattern, a classic bullish wave signal that often indicates an upcoming breakout. The price has been consolidating within a narrowing range, suggesting that selling pressure is weakening while buyers are beginning to regain control. With consistent volume confirming accumulation at lower levels, the setup hints at a potential bullish breakout soon. The projected move could lead to an impressive gain of around 190% to 200% once the price breaks above the wedge resistance.
This falling wedge pattern is typically seen at the end of downtrends or corrective phases, and it represents a potential shift in market sentiment from bearish to bullish. Traders closely watching RAVEUSDT are noting the strengthening momentum as it nears a breakout zone. Strong trading volume adds confidence to this pattern, showing that market participants are positioning early in anticipation of a reversal.
Investors’ growing interest in RAVEUSDT reflects rising confidence in the project's long-term fundamentals and current technical strength. If the breakout confirms with sustained volume, this could mark the start of a fresh bullish leg. The ongoing accumulation phase suggests that buyers are steadily gaining control, while weakening selling pressure increases the likelihood of a sustained move to the upside.
Traders might find this a valuable setup for medium-term gains, especially as the falling wedge pattern approaches completion and buying momentum accelerates. A confirmed breakout above resistance could attract additional buying interest and potentially drive the price toward its projected upside target over the coming weeks.
✅ Show your support by hitting the like button!
✅ Leave a comment below! (What is your opinion about this coin?)
Your feedback and engagement keep me inspired to share more insightful market analysis with you!
RAVEUSDT Forming Falling WedgeRAVEUSDT is forming a clear falling wedge pattern, a classic bullish wave signal that often indicates an upcoming breakout. The price has been consolidating within a narrowing range, suggesting that selling pressure is weakening while buyers are beginning to regain control. With consistent volume confirming accumulation at lower levels, the setup hints at a potential bullish breakout soon. The projected move could lead to an impressive gain of around 190% to 200% once the price breaks above the wedge resistance.
This falling wedge pattern is typically seen at the end of downtrends or corrective phases, and it represents a potential shift in market sentiment from bearish to bullish. Traders closely watching RAVEUSDT are noting the strengthening momentum as it nears a breakout zone. Strong trading volume adds confidence to this pattern, showing that market participants are positioning early in anticipation of a reversal.
Investors’ growing interest in RAVEUSDT reflects rising confidence in the project's long-term fundamentals and current technical strength. If the breakout confirms with sustained volume, this could mark the start of a fresh bullish leg. The current market structure suggests that buyers are gradually taking control while bearish momentum continues to weaken, creating favorable conditions for a significant upside move.
Traders might find this a valuable setup for medium-term gains, especially as the falling wedge pattern nears completion and buying momentum accelerates. A confirmed breakout could attract increased market participation and potentially push the price toward substantially higher levels over the coming weeks.
✅ Show your support by hitting the like button!
✅ Leave a comment below! (What is your opinion about this coin?)
Your feedback and engagement keep me inspired to share more insightful market analysis with you!
RAVE is approaching the buy zone (12H)Before anything else, keep in mind that this is a highly volatile and high-risk coin, so proper risk management is essential.
RAVE appears to be in a time consuming bearish Wave B. This Wave B itself seems to be forming either an expanding or a complex corrective pattern, with Wave C of B expected to complete within the highlighted green zone.
As long as the green zone holds, the price could move toward the indicated targets to complete Wave D of B.
A daily candle close below the invalidation level would invalidate this analysis.
invalidation level : 0.1851$
If you have a coin or altcoin you want analyzed, first hit the like button and then comment its name so I can review it for you.
What do you think? Is RAVE bearish?
#RAVEUSDT looking extremely bullish#RAVE
The price is moving within a descending channel on the hourly timeframe. It has reached the lower boundary and is trending towards a bounce. A retest of this boundary is expected.
The Relative Strength Index (RSI) indicates a downward trend, and this trend is likely to continue due to the overbought condition.
A key support zone (in green) has been found at 0.5580. The price has bounced off this zone several times, making it a strong support level.
The price is trending towards the 100-period moving average, which we are approaching. This trend supports an upward move.
Entry Price: 0.6540
First Target: 0.6753
Second Target: 0.7060
Third Target: 0.7440
You can close at the second target or wait for the third target. The choice is yours.
Stop Loss: At the resistance zone (in green).
Remember this simple rule: Money Management.
Any questions? Please leave a comment.
Thank you.
#RAVEUSDT – Short Setup from Key Supply Zone#RAVE
The price is moving within a descending channel on the 1-hour timeframe and has reached the lower boundary. It is now poised for a bounce and is expected to retest this boundary.
The Relative Strength Index (RSI) indicates a downward trend, which is likely to continue given the overbought conditions.
There is a key support zone in green at 5400. The price has bounced off this zone several times, making it a strong support level.
The price is trending towards the 100-period moving average, which we are approaching. This trend supports an upward move.
Entry Price: 0.7445
First Target: 0.7900
Second Target: 0.8491
Third Target: 0.9145
You can stop at the first and second targets and close below them, or continue towards the third target. Stop Loss: At the resistance zone in green.
Remember this simple rule: Money Management.
Any questions? Please leave a comment.
Thank you.
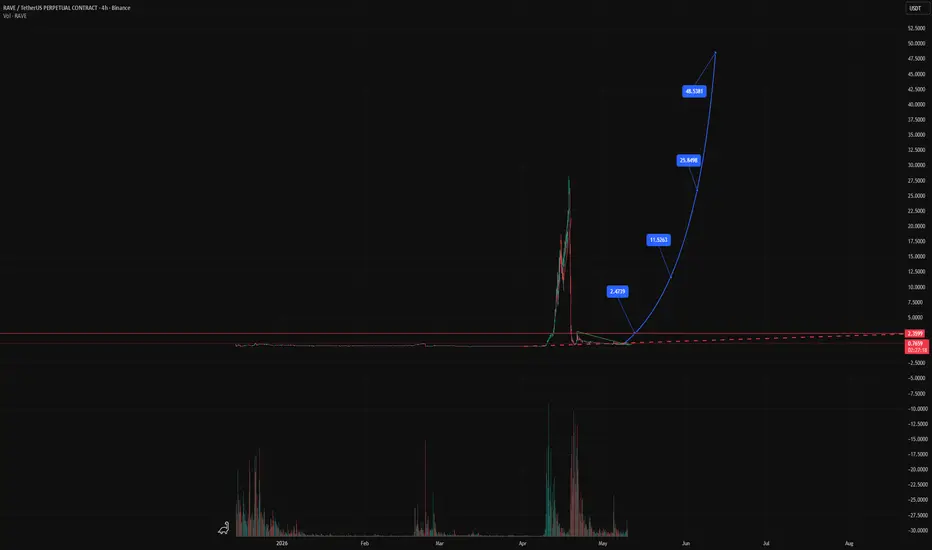
RAVEUSDT | Post-Crash Accumulation → Base Formation → Parabolic RAVEUSDT | Post-Crash Accumulation → Base Formation → Parabolic Expansion Setup 🚀
RAVEUSDT has undergone a classic blow-off top followed by a full market reset , with price collapsing sharply after an aggressive rally. Since then, price has entered a prolonged low-volatility accumulation phase near the base.
━━━━━━━━━━━━━━━
📊 Market Structure Breakdown
• Initial phase: Parabolic expansion → distribution → sharp liquidation
• Current phase: Compression at lows with reduced volatility
• Price action now shows signs of base stabilization
The long sideways structure suggests:
→ Weak hands fully shaken out
→ Supply absorbed over time
→ Potential accumulation by stronger participants
━━━━━━━━━━━━━━━
💡 Key Structural Insight
After extreme moves, markets typically cycle through:
Expansion → Distribution → Collapse → Accumulation → Re-Expansion
RAVE appears to be transitioning from:
Accumulation → Early Expansion Phase
━━━━━━━━━━━━━━━
🚀 Projected Expansion Path
The marked projection outlines a high-volatility expansion scenario:
🔹 Phase 1: Breakout from base (~2.4 region)
🔹 Phase 2: Acceleration toward mid-range (~11.5)
🔹 Phase 3: Momentum continuation (~25.8)
🔹 Phase 4: Potential parabolic move (~48+)
These levels represent liquidity magnets where price may react during expansion.
━━━━━━━━━━━━━━━
⚠️ Risk & Invalidation
• Failure to hold above base support
• Continued low-volume chop without breakout
• Rejection from initial breakout level
This would indicate prolonged accumulation or further downside.
━━━━━━━━━━━━━━━
🧠 Key Insight
Low-volatility bases after extreme crashes often precede high-impact expansion moves .
The longer the compression, the stronger the potential breakout.
━━━━━━━━━━━━━━━
📌 Conclusion
RAVEUSDT is currently positioned at a critical inflection point .
A confirmed breakout from this base could trigger a [b>multi-stage expansion toward higher liquidity zones.
Patience is key — the move, if triggered, can be explosive.
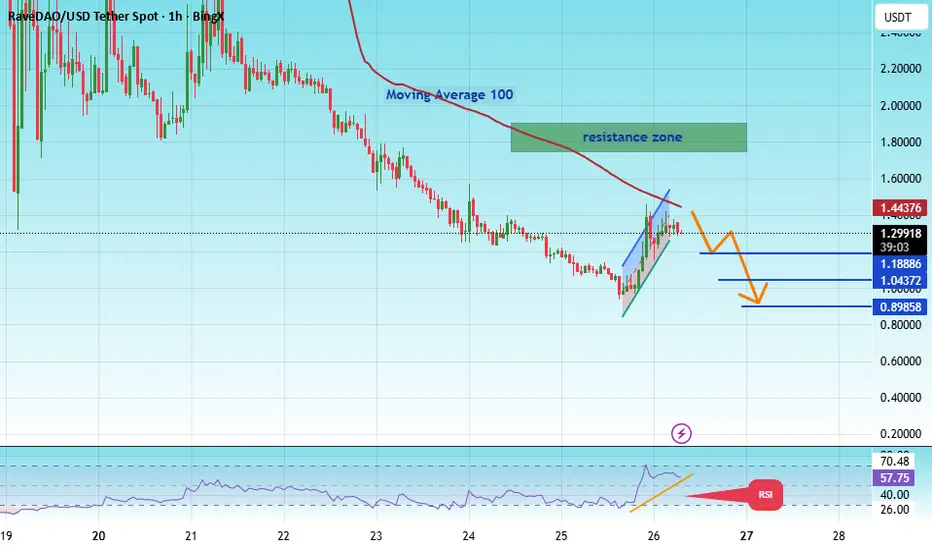
#RAVEUSDT – Short Setup from Key Supply Zone#RAVE
The price is moving within an ascending channel on the hourly timeframe. It has reached the lower boundary and is heading towards a breakout. A retest of this boundary is expected.
The Relative Strength Index (RSI) indicates a downward trend, and this trend is likely to continue due to the overbought condition.
There is a key resistance zone in green at 1.90, which the price has bounced off several times, making it a strong support level.
A consolidation trend is observed above the 100-period moving average, which we are approaching. This trend supports a decline towards this level.
Entry Price: 1.31
Target 1: 1.19
Target 2: 1.04
Target 3: 0.8870
Stop Loss: At the resistance zone in green.
Remember this simple rule: Manage your money wisely.
For any questions, please leave a comment.
Thank you.
RAVE READY FOR DEAD CAT BOUNCE🔥 Fortune AI Radar — NASDAQ:RAVE
Fresh activity detected on NASDAQ:RAVE today.
Data suggests increasing market interest & buyers stepping in.
Technicals currently lean bullish, with momentum trending upward.
Whales showing hints of accumulation and hype rising among trader
RAVEUSDT Ready for the next leg up?Massive distribution from the $28.3 region now fully unwound, with price returning to a high-value accumulation range between $0.67–$0.54.
Structure suggests reloading phase in progress.
Upside roadmap:
$1.33 → $3.27 → $8.27
As long as accumulation holds, this remains a high R:R positioning zone. Smart money accumulates quietly… are you positioned?
Market Psychology → From Panic to Real GrowthThis chart illustrates a classic market cycle driven by trader behavior rather than fundamentals.
After a sharp dump, price enters an accumulation zone (highlighted in green), where weak hands exit and smart money begins positioning. During this phase, volatility drops and price moves sideways — most traders lose interest here.
As price starts bouncing, retail traders jump in expecting a strong reversal (greed phase). However, the market fails to sustain momentum, leading to a slow bleed — this is distribution, where early buyers get trapped and liquidity is absorbed.
Once the confusion and sell-off phase is complete, the market stabilizes again near the same demand zone. This sets the stage for the real move, where price can expand strongly with better structure and less resistance overhead.
Key Takeaways:
Initial pump ≠ real trend reversal
Sideways zones = accumulation/distribution battlefield
Most traders enter too early (greed) and exit too late (fear)
The strongest move often comes after fake breakouts and shakeouts
Strategy Insight:
Focus on patience. Let the distribution phase complete and wait for confirmation near key demand before expecting expansion.
RAVE AnalysisRAVE is currently trading in a broader downtrend, with price consistently forming lower highs and lower lows after a sharp rejection from the 1.25–1.30 region. The market structure remains weak, indicating continued bearish pressure in the higher timeframe.
🔍 Key Observations:
Price is hovering around a critical demand/support zone near 0.99–1.02
Multiple resistance levels stacked above: 1.018 → 1.048 → 1.056 → 1.076
Weak bullish attempts suggest lack of strong buying momentum
📉 Bearish Scenario:
If price fails to hold the current support zone (~0.99), we could see a strong breakdown targeting:
0.93
0.85
Extreme liquidity sweep toward 0.57
📈 Bullish Scenario:
A reclaim and hold above 1.018–1.048 zone could trigger a relief rally toward:
1.056
1.076 (major resistance)
💡 The projected path suggests a potential liquidity sweep to the downside first, followed by a strong reversal move — classic smart money behavior.
⚠️ Conclusion:
RAVE — Perfect Call, No Executionvideo (posted as private by mistake but here you go):
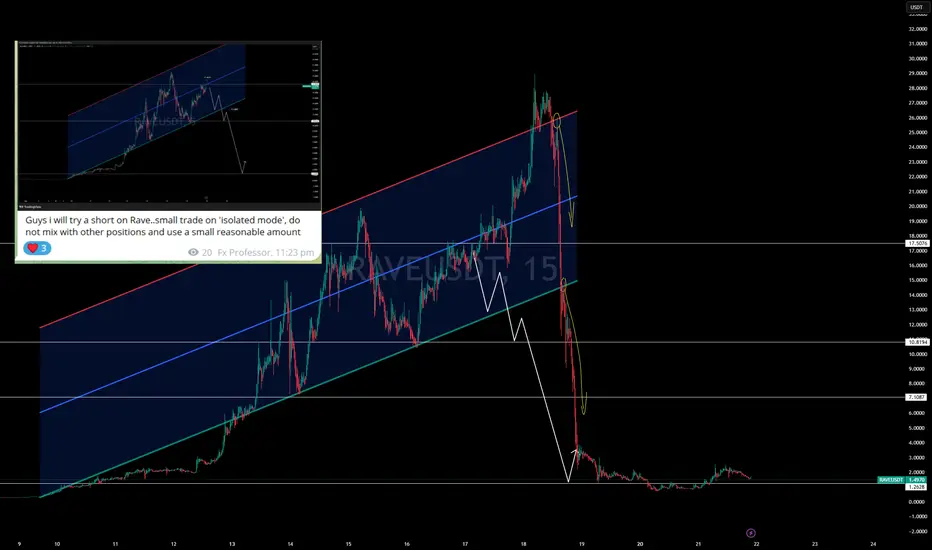
⚠️ RAVE — Perfect Call, No Execution
I shared a bearish view with a move from around 28 toward 1.26.
And yes… the market respected the idea.
But here’s the part traders don’t always admit:
👉 I didn’t make money on it.
Why?
• Entered too early
• Didn’t follow up on the setup properly
• Missed the cleaner rejection zones near 26 and later around 15
• Weekend mode kicked in — family time won over screen time
That is real trading. I even LOST some money trying to daytrade the lost short to potential rebound of some kind...bad idea.
Analysis can be correct.
Execution can still fail.
And in this game, execution is everything.
🧠 Why I Focus on Bitcoin More
Last months, I’m leaning more and more toward Bitcoin.
Altcoins can move hard, yes — but they are also:
• Highly manipulated
• Sensitive to liquidity conditions
• Driven by order book imbalance
That doesn’t mean we ignore them. I am actively looking for some short positions still (until it's time to buy the GOOD Ones again).
👉 It means we treat them differently.
For me, that often means looking for shorts on weakness, not falling in love with random narratives.
RAVE’s Insane Pump and Collapse — Recovery or Dead Cat Bounce?I want to talk about the RaveDAO project , which caught my attention. Here’s why: in just 10 days, it had over an +11,500% price increase, but then within about two days, it dropped more than -99%.
Let’s explore what caused this price crash—stay with me!
Why RAVE Token collapsed:
Insiders/team allegedly controlled 90–95% of the entire 1 billion supply through just 3 multisig wallets.
Large transfers (e.g. 23M tokens ≈ $23M) were sent to some crypto exchanges' deposit addresses right before the pump → created artificial short squeeze → triggered $43–52M in liquidations (mostly shorts).
Once the squeeze played out, insiders dumped. No real news, partnership, or utility drove the rally — pure supply manipulation.
Main exchanges immediately opened formal investigations into market manipulation.
Now, let’s get into the technical analysis of the RAVE token ( BINANCE:RAVEUSDT.P ) on the 1-hour timeframe.
The RAVE token attempted to attack the resistance zone once but couldn’t break it after the severe crash it experienced. It’s currently moving near that same area.
From an Elliott Wave perspective, it seems the RAVE token is completing its wave 4, so we could anticipate another attempt toward the resistance zone.
I expect the RAVE token to rise to at least around $2.27. If the upward momentum is strong, we could even see it break the resistance zone.
First Target: $2.270
Second Target: Cumulative Short Liquidation Leverage($2.864-$3.269)
Stop Loss(SL): $1.10(Worst)
Points may shift as the market evolves
Cumulative Long Liquidation Leverage: $1.110-$0.933
What’s your view on the RaveDAO project? Can it recover again, or should we expect a dead cat bounce?
💡 Please respect each other's opinions and express agreement or disagreement politely.
📌RaveDAO Analysis (RAVEUSDT.P), 1-hour time frame.
🛑 Always set a Stop Loss(SL) for every position you open.
✅ This is just my idea; I’d love to see your thoughts too!
🔥 If you find it helpful, please BOOST this post and share it with your friends.
RAVEThe manipulation involving the coin’s commission was, indirectly, a "short squeeze." The coin's development team distributed tokens across multiple exchanges to create the illusion of a sell-off, which subsequently triggered a short squeeze bubble. Theoretically, this implies that there is insufficient evidence to prove the team actually sold any portion of their own holdings. The exchanges involved will likely issue announcements regarding this shortly. Currently, the price is in a state of panic and under heavy selling pressure; therefore, for this specific trade, it is advisable to avoid using leverage exceeding 1x.
RAVE COIN ANALYSIS AND POSSIBLE TRADE PLAN !!NASDAQ:RAVE Coin 🎣.
• Near me 0.35$-0.28$ zone of NASDAQ:RAVE Coin is a strongest one support & liquidity zone.... Where if i got any proper bullish confirmation on LTF's after consolidation... Then i will build long trade on it with tight SL🚨
Warning : That's just my plan & analysis... When i will execute a trade.. I will update🫡
From 120K to Silence What Is Really Driving This Market?!In the past months, after the drop from 120K on BTC, you may have noticed that some tickers made insane pumps. Among them are CRYPTOCAP:SIREN and CRYPTO:RIVERUSD BINANCE:RAVEUSDT.P and other like BINANCE:STOUSDT , and many others.
The point I want to discuss here is that exchanges seem to be attracting traders’ attention through these pumps. If you look closely and do some basic research, even during the BTC run to 120K, Google Trends was almost flat, showing no real surge in public interest. This says a lot about how people are currently interacting with the crypto market.
Yes, institutions have entered the market with their own agendas. But even among them, some are already taking losses, though it does not seem to affect them. Large portfolios can adapt and stay flexible in ways that retail traders cannot.
What concerns me more is the behavior of certain tokens that achieve gains of over +3000%, only to lose everything within days.
These kinds of moves and sharp sell offs make it difficult to enter or manage positions. It raises a real question. Are platforms playing a role in this to maintain high daily trading volume and guide the market where they want?
There are many questions, especially since we did not see a true altcoin season in the last cycle, even though BTC kept making new highs.
Is confidence in the crypto market still strong?
Will altcoins play a role in the next cycle, or is there no real cycle ahead?
Have altcoins been replaced by new tokens that are heavily oversupplied and quickly lose their value?
Do you remember the crash in 2025 linked to Binance, which wiped out many accounts? That long wick we still see across many altcoins is something the market has not fully recovered from.
There are many questions and possibilities. The coming days will bring answers that could be disappointing, shocking, or maybe even offer some hope.
Either way, we keep doing our best.
we ask Allah reconcile and repay