Compare with RENDERUSDT SPOT
RENDER 8H – Descending Channel Pressing Into Lower BoundaryRENDER on the 8H timeframe is currently trading around 1.745 after a sharp decline from the June spike high near 2.480, with price now grinding along the lower boundary of a descending channel near 1.415–1.460 following a recovery attempt that failed to reclaim the 1.580–1.600 horizontal level.
The
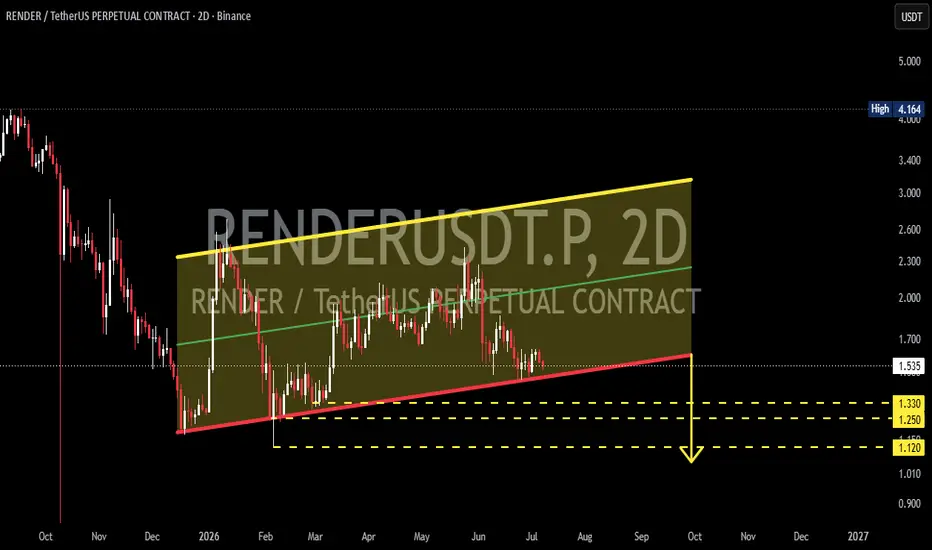
RENDERUSDT - Rising Channel, Is a Bearish Breakdown Next?📊 Technical Analysis
💵 Coin: CRYPTOCAP:RENDER #RENDER
⏳ Time Frame: 2D
📈 Pattern: Rising Channel (Bearish Bias)
🎯 Current Focus: Watching for price reaction at the channel support to determine the next directional move.
---
📚 Pattern Overview: Rising Channel 📈
The chart shows price moving
RENDER will experience deeper drops ahead (12H)The larger structure that RENDER appears to have formed looks like a Diametric pattern.
Wave F of this Diametric has itself unfolded as a Symmetrical pattern and now seems to be complete. The price is currently developing Wave G of the overall formation.
A pullback into the red zone is expected be
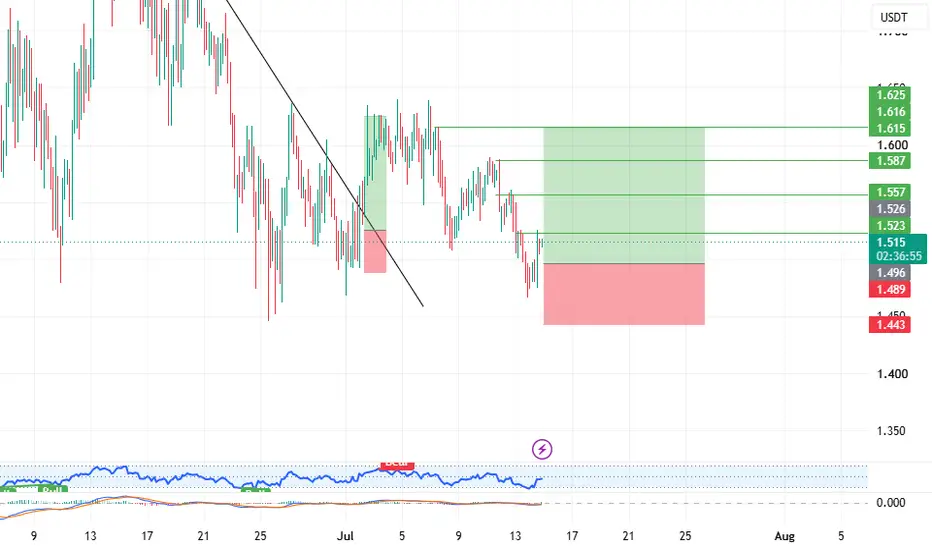
RENDERUSDT — Bullish BC Reached, But One Magnet RemainsOKX:RENDERUSDT is sitting at an important decision point.
The larger bullish sequence is still active. Price broke the bearish trendline with meaningful displacement, created a valid bullish structure, and has now pulled back into the bullish B C zone .
That matters.
BC is where buyers are suppo
RENDER/USDT — Long After Recovery, Sell Complete [Quantum Algo]RENDERUSDT Perpetual
Context:
RENDER had a brutal sell-off. The previous Sell signal at 2.10 delivered a clean drop down to 1.50 — nearly 30% in less than a week. After bottoming, price has built a clear recovery structure with higher highs and higher lows back up to 1.85. Now a fresh Buy signal ha
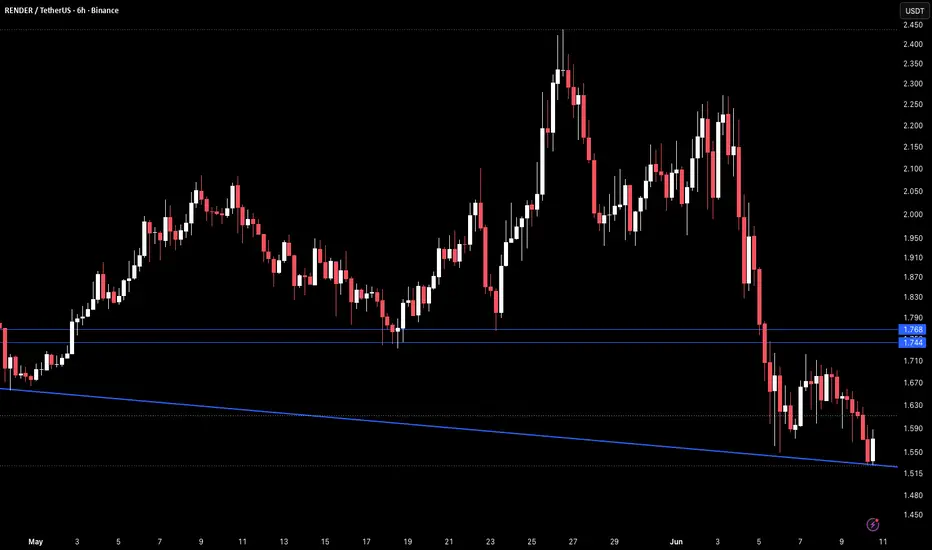
RENDER 6H – Trendline & Support Breakdown at New LowsRENDER on the 6H timeframe is currently trading around 1.577 after a sharp sell-off in early June that broke through the rising macro trendline from the February lows and two key horizontal support levels at 1.744 and 1.768 in quick succession, pushing price to the lowest level on this chart.
The t
RENDERSince Arthur Hayes said AI crypto tokens can crash and that means they will go up, Render is a pretty solid option and is one of my favorite projects.
However it still has to reclaim $1.80 short term and then break the $2.60 resistance which it got rejected from several times, and then there will b
See all ideas
Summarizing what the indicators are suggesting.
Oscillators
Neutral
SellBuy
Strong sellStrong buy
Strong sellSellNeutralBuyStrong buy
Oscillators
Neutral
SellBuy
Strong sellStrong buy
Strong sellSellNeutralBuyStrong buy
Summary
Neutral
SellBuy
Strong sellStrong buy
Strong sellSellNeutralBuyStrong buy
Summary
Neutral
SellBuy
Strong sellStrong buy
Strong sellSellNeutralBuyStrong buy
Summary
Neutral
SellBuy
Strong sellStrong buy
Strong sellSellNeutralBuyStrong buy
Moving Averages
Neutral
SellBuy
Strong sellStrong buy
Strong sellSellNeutralBuyStrong buy
Moving Averages
Neutral
SellBuy
Strong sellStrong buy
Strong sellSellNeutralBuyStrong buy
Displays a symbol's price movements over previous years to identify recurring trends.
Frequently asked questions
The current price of RENDERUSDT SPOT (RENDER) is 1.426 USDT — it has fallen −0.50% in the past 24 hours. Try placing this info into the context by checking out what coins are also gaining and losing at the moment and seeing RENDER price chart.
RENDERUSDT SPOT price has fallen by −7.50% over the last week, its month performance shows a −9.82% decrease, and as for the last year, RENDERUSDT SPOT has decreased by −67.04%. See more dynamics on RENDER price chart.
Keep track of coins' changes with our Crypto Coins Heatmap.
RENDERUSDT SPOT (RENDER) reached its highest price on Dec 5, 2024 — it amounted to 11.892 USDT. Find more insights on the RENDER price chart.
See the list of crypto gainers and choose what best fits your strategy.
RENDERUSDT SPOT (RENDER) reached the lowest price of 0.502 USDT on Oct 10, 2025. View more RENDERUSDT SPOT dynamics on the price chart.
See the list of crypto losers to find unexpected opportunities.
The safest choice when buying RENDER is to go to a well-known crypto exchange. Some of the popular names are Binance, Coinbase, Kraken. But you'll have to find a reliable broker and create an account first. You can trade RENDER right from TradingView charts — just choose a broker and connect to your account.
Crypto markets are famous for their volatility, so one should study all the available stats before adding crypto assets to their portfolio. Very often it's technical analysis that comes in handy. We prepared technical ratings for RENDERUSDT SPOT (RENDER): today its technical analysis shows the strong sell signal, and according to the 1 week rating RENDER shows the sell signal. And you'd better dig deeper and study 1 month rating too — it's strong sell. Find inspiration in RENDERUSDT SPOT trading ideas and keep track of what's moving crypto markets with our crypto news feed.
RENDERUSDT SPOT (RENDER) is just as reliable as any other crypto asset — this corner of the world market is highly volatile. Today, for instance, RENDERUSDT SPOT is estimated as 3.31% volatile. The only thing it means is that you must prepare and examine all available information before making a decision. And if you're not sure about RENDERUSDT SPOT, you can find more inspiration in our curated watchlists.
You can discuss RENDERUSDT SPOT (RENDER) with other users in our public chats, Minds or in the comments to Ideas.