$RENDER | 1D — BREAKOUT ATTEMPT RENDER is finally pushing above its long-term descending resistance.
After months of compression, price is now testing the $1.80–$1.90 breakout zone with strong recent momentum. 📈
But here's the key:
A breakout isn't confirmed until the daily candle closes above resistance and holds the level on
Compare with Render Token / Tether
RENDER is approaching a strong resistance here$2 Psychological resistance, and daily 0.618 short term 0.618 retracement.
Expecting to see a small rejection from there, these levels are real strong. We should be seeing small reversal to the downside. But if break from above of them after the retest, we could expect RENDER to fly higher.
RENDER Descending Channel — Breakout or Rejection?💵 Pair: CRYPTOCAP:RENDER
⏳ Time Frame: 5D
📐 Pattern: Descending Channel
📍 Price on the chart: around $1.766
🔻 Descending Channel Structure
The chart shows that RENDER/USDT has been moving within a long-term Descending Channel.
📉 Upper Channel — Red Trendline
The red trendline acts as a dynamic
RENDERUSDT | Bearish Reversal SetupRENDERUSDT had been trading in a clear uptrend, forming a consistent sequence of higher highs and higher lows. However, as price recorded another higher high, the RSI formed a lower high, creating a clear bearish divergence and signaling weakening bullish momentum.
I waited for confirmation rather
RENDER is about to turn super bullish (3H)RENDER is currently forming a Diametric pattern and is now in wave F.
Please note that this is a BUY/LONG signal, not a SELL/SHORT signal. This means you should wait for the price to reach the green zone and only then consider entering a BUY/LONG position.
We expect wave G to complete within the g
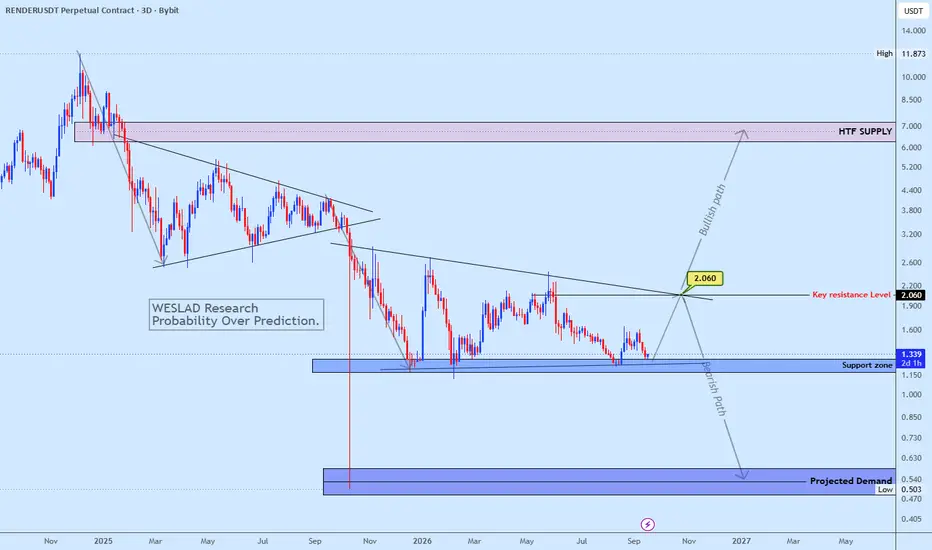
RENDER Support Retest on WatchRENDER is trading within the support base, with a bounce potentially targeting the 2.06 key resistance. A rejection from 2.06 could trigger a sharp decline back toward the support area. If that support fails, the 0.50–0.55 projected demand zone comes into focus.
Probability over prediction.
WESLAD
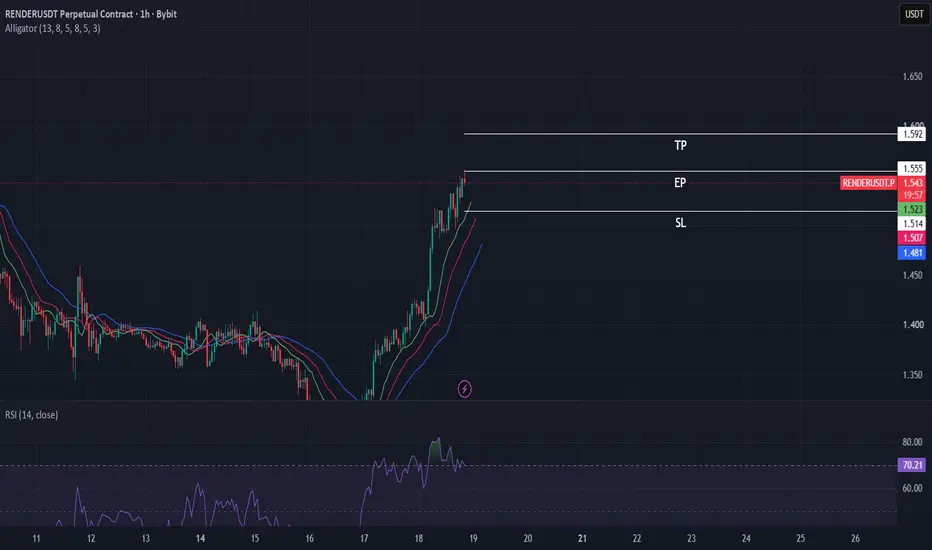
RENDERUSDT LONG SETUPI took this long position in line with the prevailing uptrend. Price was forming a clear series of higher highs and higher lows, and the Williams Alligator indicator supported the bullish structure. I saw no bearish divergence in the setup.
With broader sentiment across the crypto market appearing
RENDER - Key levels to watchRENDER is still trading within its larger HTF range, but the current area is interesting.
The key levels I’m watching:
~$1.10 → Major HTF support
~$2.50 → Key resistance / level to reclaim
~$6.80 → Major HTF resistance if momentum returns
For now, $1.10 continues to hold as support, but RENDER sti
RENDER/USDT H1: Weakness after local high🎯 TP1: $1.5009 (+1.32%) │ TP2: $1.4807 (+2.65%)
🛑 SL: $1.5576 (-2.41%) │ R/R: 1 : 1.1
⚠️ SL is placed beyond the nearest candle wicks to reduce the risk of accidental triggering
FUNDAMENTAL BACKGROUND
RENDER is trading without significant project catalysts, moving in line with the broader crypto ma
See all ideas
Summarizing what the indicators are suggesting.
Oscillators
Neutral
Oscillators
Neutral
Summary
Neutral
Summary
Neutral
Summary
Neutral
Moving Averages
Neutral
Moving Averages
Neutral
Displays a symbol's price movements over previous years to identify recurring trends.
Frequently asked questions
The current price of Render Token / Tether (RENDER) is 1.897 USDT — it has fallen −6.57% in the past 24 hours. Try placing this info into the context by checking out what coins are also gaining and losing at the moment and seeing RENDER price chart.
Render Token / Tether price has risen by 10.73% over the last week, its month performance shows a 32.62% increase, and as for the last year, Render Token / Tether has decreased by −45.11%. See more dynamics on RENDER price chart.
Keep track of coins' changes with our Crypto Coins Heatmap.
Render Token / Tether (RENDER) reached its highest price on Dec 5, 2024 — it amounted to 11.862 USDT. Find more insights on the RENDER price chart.
See the list of crypto gainers and choose what best fits your strategy.
Render Token / Tether (RENDER) reached the lowest price of 0.474 USDT on Oct 10, 2025. View more Render Token / Tether dynamics on the price chart.
See the list of crypto losers to find unexpected opportunities.
The safest choice when buying RENDER is to go to a well-known crypto exchange. Some of the popular names are Binance, Coinbase, Kraken. But you'll have to find a reliable broker and create an account first. You can trade RENDER right from TradingView charts — just choose a broker and connect to your account.
Crypto markets are famous for their volatility, so one should study all the available stats before adding crypto assets to their portfolio. Very often it's technical analysis that comes in handy. We prepared technical ratings for Render Token / Tether (RENDER): today its technical analysis shows the buy signal, and according to the 1 week rating RENDER shows the buy signal. And you'd better dig deeper and study 1 month rating too — it's neutral. Find inspiration in Render Token / Tether trading ideas and keep track of what's moving crypto markets with our crypto news feed.
Render Token / Tether (RENDER) is just as reliable as any other crypto asset — this corner of the world market is highly volatile. Today, for instance, Render Token / Tether is estimated as 4.67% volatile. The only thing it means is that you must prepare and examine all available information before making a decision.
You can discuss Render Token / Tether (RENDER) with other users in our public chats, Minds or in the comments to Ideas.