REQ - time to bounce upREQ is more or less following ZEC path with last capitulation dip creating more oversold condition than the one we had in March 2020. I expect bounce up and similar to ZEC a push to test diagonal resistance line at ATH range from where again deeper pullback to try form a higher low.
In-depth trading ideas
Request Token Long-term HoldAnother great project that has been quietly building and growing for years. Facilitates invoicing and payment collection on the blockchain - pretty essential for adoption in the future and, if it becomes the default platform for this, the sky is the limit for the price. I think $4-5 is very achievable; the other targets are pure speculation!
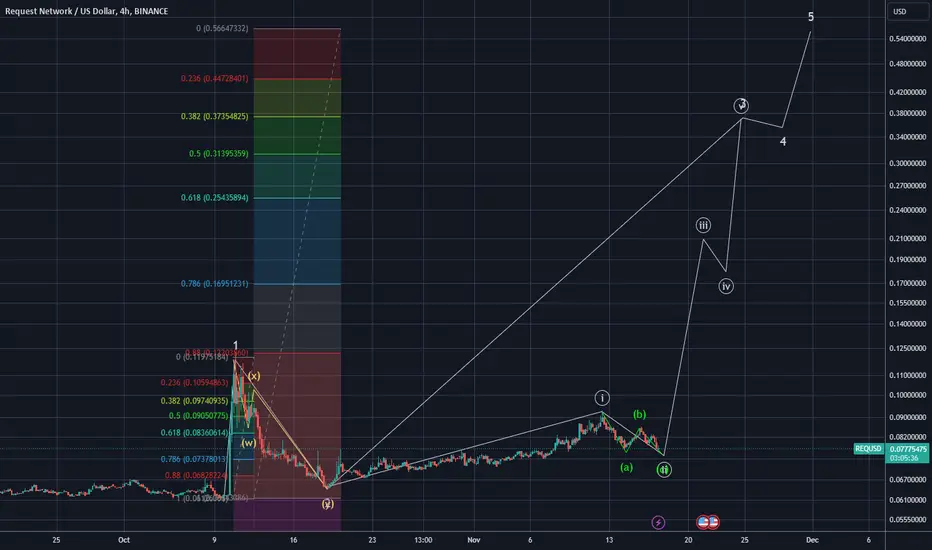
request wavestracing out an extended wave 3 with main wave 3 of 3 ahead
ultimate target around .55
nfa
y axis
RLong
✴️ Request Network Long-Term Consolidation ChannelRequest Network has been moving sideways within a wide long-term consolidation channel with a long-term higher low. The daily RSI is at 51 (bullish) while prices trade near support.
A strong RSI with low/near support prices is a very important signal. You would normally get a "weak" RSI reading when prices are low and dropping.
Having a strong RSI means that a bullish breakout can now happen anytime, any day.
This pair looks bullish to me... Buy & hold is my strategy; Think and focus on the l
I'm ready 🚀I'm not one to give fancy speeches or informational guidance on trading.
I put my money where I believe a project has potential and I promote the project to best to my ability with facts not hype.
Don't expect to see $20 anytime soon it takes time for greatness to achieve marketing attention.
I do believe this year a $3 billion dollar market cap is possible.
Potential I see around $40 billion dollar market cap around 2026 if it gains momentum in the market as a reliable defi alternative to PayPa
REQUSDT Almost doubled its value in one day!It was just over a month ago when we called for a strong bullish break-out on the Request Network (REQUSDT), in the event that its medium-term Lower Highs trend-line broke and the 1D MA200 (orange trend-line):
As you see, the break-out happened today and so far is massive as the token is up +85% in just one day! As mentioned then, the target is the 2.0 Fibonacci extension level from the previous Inverse Head and Shoulders. A closing above the 2.0 Fib can be a whole new Bull Phase targeting
RLong
REQUSDT Supported and waiting for the 1D MA200 break-outRequest Network (REQUSDT) held the Symmetrical Support of 0.1040 and broke above both the 1D MA100 (green trend-line) and 1D MA50 (blue trend-line). However it bounced off the Lower Highs trend-line that started on the July 31 High.
As a result, we would like to see a break above that Lower Highs trend-line to engage into a buy extension. In that case, the target would be the 2.0 Fibonacci extension (around 0.2100), as the previous pattern was an Inverted Head and Shoulders (IH&S) which is a fo
RLong
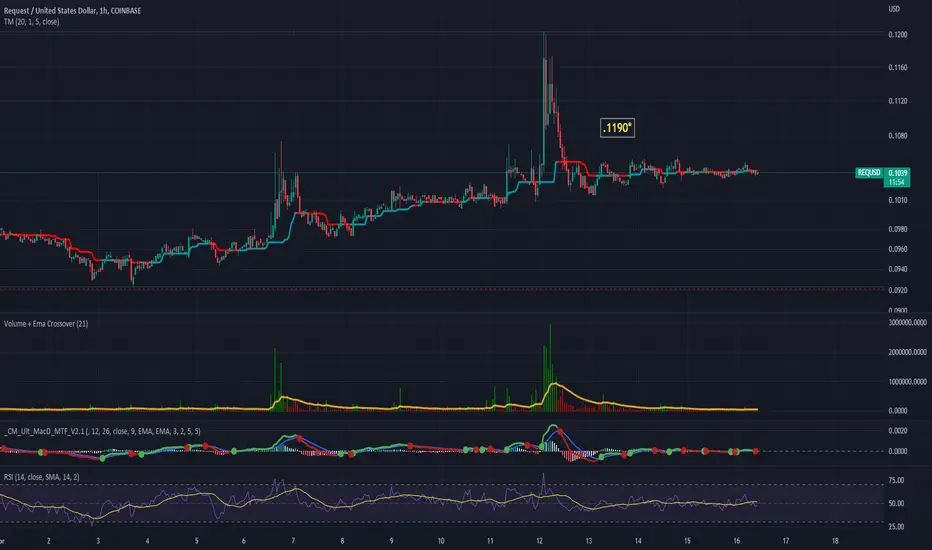
REQ: Invalidate Under .11 Request is showing some upward momentum. Volume reads on the LTFs shows supply decreasing on the pullbacks -- evidence of reabsorption. Invalidate if the PA sinks below .11.
*Be sure to subscribe for more dynamic VSA swing charts based off Wyckoff TA. Accuracy hitting profit/sell target ranges between 80-85%. Check my past charts, then follow me and see for yourself! I'm all about making money; it's the only reason I'm here. Let's go!
**Not financial advice. Please DYOR and trade at your own
REQUEST NETWORK - SUPER BULLISHThis will take some time to play.
Always do your OWN research and make the call on your own judgment and analysis.
RLong
REQ/USDT - UPDATETV admins pulled my last few posts including this one. so here's a quick update.
Nothing has changed with the plan. here is a depth view of what my re-entry would be for the handle.
This is a hodl 3-4 years, it could be possible you can see over 10,000.00% run if it follows to plan.
Safe trading all.
RLong
I'M READY FOR THIS BULLISH WAVEThere's a huge difference between a bearish wave and a bullish double wave.
It broke out on the bearish wave with some great momentum before hitting resistance. Completion of wave 1 and 2 on the impulse wave cycle has completed now we are going into wave 3,4 and 5.
Request is finally making a move in the market after years of sleeping. 👋👋👋👋🤝😆
TWO MASSIVE WAVESBe ready that's really all I have to say.
My bags are packed and I'm ready to go.
It could happen at any moment.
RLong
DOUBLE OR TRIPLE BOTTOM ON THE GREEN DOTTED LINE IS MY CALLLooks like we will double or triple bottom on the green dotted line unless something happens and we break down then the red dotted line is a fail safe support line. Had a feeling 23 to 27 would be the bottom. Dropped just a little more than expected but still looks great for the next run. Just keep holding and taking 50% profit on the waves and when we finally break out again its going to be a big one. I assigned two dates with vertical lines for a possible breakout.
R
REQUSD 2D: 1000%+ gains BEST level TO BUY/HOLD(SL/TP)(SWING)Why get subbed to me on Tradingview?
-TOP author on TradingView
-15+ years experience in markets
-covering crypto/FX/stocks
-Professional chart break downs
-Supply/Demand Zones
-TD9 counts / combo review
-Key S/R levels
-No junk on my charts
-Frequent updates
-Covering FX/crypto/US stocks
-24/7 uptime so constant updates
REQUSD 2D: 1000%+ gains BEST level TO BUY/HOLD(SL/TP)(SWING)
IMPORTANT NOTE: speculative setup. do your own
due dill. use STOP LOSS. don't overleverage.
previously recommende
RLong