In-depth trading ideas
REZUSDT | Downtrend Exhaustion → Accumulation → Multi-StageREZUSDT | Downtrend Exhaustion → Accumulation → Multi-Stage Expansion Setup 🚀
REZUSDT has been in a prolonged bearish structure, respecting a clear descending trendline with consistent lower highs and controlled downside pressure. However, recent price action suggests that this trend is approaching exhaustion , with price stabilizing near a key accumulation zone.
━━━━━━━━━━━━━━━
📊 Market Structure Breakdown
• Extended downtrend with strong trendline respect
• Price compressing near lows → accumulation phase
• Reduced volatility indicating seller exhaustion
• Early signs of structural shift forming
The market is transitioning from:
Bearish Control → Accumulation → Potential Expansion
━━━━━━━━━━━━━━━
💡 Key Levels & Zones
🔹 Accumulation Base: ~0.0036 – 0.0063
→ Strong support zone where buyers are stepping in
🔹 Early Breakout Level: ~0.0087
→ First confirmation of strength
🔹 Mid Resistance: ~0.0110
→ Key structure level / reaction zone
🔹 Major Resistance: ~0.0272
→ Liquidity zone from previous price action
🔹 Reversal Zone: ~0.0358 – 0.0390
→ High-probability distribution area
━━━━━━━━━━━━━━━
🚀 Projected Scenario
The projected path outlines a classic expansion model:
1. Base formation and breakout above accumulation
2. Gradual move into mid-range liquidity
3. Strong impulsive move toward major resistance
4. Potential rejection or distribution at higher zones
This reflects a liquidity-driven expansion cycle .
━━━━━━━━━━━━━━━
⚠️ Invalidation
• Breakdown below accumulation zone
• Failure to reclaim breakout level
• Continued compression without expansion
This would suggest continuation of the broader bearish structure.
━━━━━━━━━━━━━━━
🧠 Key Insight
Markets that spend extended time in accumulation often generate high-momentum expansion moves .
The longer the compression, the stronger the potential breakout.
━━━━━━━━━━━━━━━
📌 Conclusion
REZUSDT is approaching a critical turning point .
A confirmed breakout from the accumulation base could trigger a multi-stage expansion toward higher liquidity zones .
Watch the breakout — this is where momentum shifts begin.
REZUSDT Forming Bullish MomentumREZUSDT is forming a clear bullish momentum pattern, a classic bullish wave signal that often indicates an upcoming breakout. The price has been consolidating within a narrowing range, suggesting that selling pressure is weakening while buyers are beginning to regain control. With consistent volume confirming accumulation at lower levels, the setup hints at a potential bullish breakout soon. The projected move could lead to an impressive gain of around 40% to 50% once the price breaks above the wedge resistance.
This bullish momentum pattern is typically seen at the end of downtrends or corrective phases, and it represents a potential shift in market sentiment from bearish to bullish. Traders closely watching REZUSDT are noting the strengthening momentum as it nears a breakout zone. The good trading volume adds confidence to this pattern, showing that market participants are positioning early in anticipation of a reversal.
Investors’ growing interest in REZUSDT reflects rising confidence in the project’s long-term fundamentals and current technical strength. If the breakout confirms with sustained volume, this could mark the start of a fresh bullish leg. Traders might find this a valuable setup for medium-term gains, especially as the pattern completes and buying momentum accelerates.
✅ Show your support by hitting the like button and
✅ Leaving a comment below! (What is your opinion about this Coin?)
Your feedback and engagement keep me inspired to share more insightful market analysis with you!
REZ/USDT - Breakout or Fake Move?The REZ/USDT (3D) chart is still in a medium–long term downtrend structure, clearly visible from the descending trendline resistance (yellow line) that has been consistently pushing price down since the early distribution phase. 📉
However, there are early signs that selling pressure is starting to weaken, and a potential accumulation phase may be forming. 🔄
---
📊 Structure & Patterns Forming
🔻 Descending Trendline (Major Resistance)
Price continues to fail breaking this line → indicating strong seller dominance.
🟢 Rounded Bottom / Early Accumulation
In the recent low area (~0.0026 – 0.0033), a more stable base is forming → indicating sellers may be losing momentum.
📦 Consolidation Range
Price is moving within a tight range:
Support: 0.0033 – 0.0040
Minor Resistance: 0.0057
⚡ Liquidity Sweep (Long Wick)
A sharp downside spike occurred → likely a stop hunting move before a minor reversal.
---
🎯 Key Levels
🟢 Strong Support: 0.0026 – 0.0033
🔴 Minor Resistance: 0.0057
🚧 Next Resistance Levels:
0.0078
0.0110
0.0163 (major supply zone)
---
🐂 Bullish Scenario
Bullish confirmation requires:
1. Price breaks and closes above 0.0057
2. Followed by a breakout of the descending trendline
📈 Upside Targets:
0.0078 (initial target)
0.0110 (mid resistance)
0.0163 (major target / supply zone)
🔥 If the trendline is broken, this could signal:
> An early trend reversal from downtrend to uptrend
---
🐻 Bearish Scenario
Bearish bias remains if:
1. Price fails to break 0.0057
2. Strong rejection occurs at the trendline
3. Volume weakens during upward movement
📉 Downside Potential:
Return to 0.0033
Even a retest of 0.0026 (previous low)
⚠️ A breakdown below this area could lead to:
> Downtrend continuation (forming new lower lows)
---
🧠 Conclusion
REZ is currently at a critical phase:
Still in a downtrend 📉
But showing early signs of accumulation 🟢
👉 The 0.0057 level & trendline are key:
Break = reversal opportunity 🚀
Rejection = continuation downward 🔻
#REZUSDT #CryptoAnalysis #TechnicalAnalysis #Altcoins #TradingView #PriceAction #Breakout #Downtrend #Reversal #AccumulationZone
Renzo (REZ) Enters Bullish Territory w/320% Easy TargetThe low process in 2025 lasted one month and it was followed by a bullish wave. The bullish wave was relatively small, showing that a lack of consolidation and accumulation at support leads to poor performance.
In 2026 the bottom process lasted three months—there is more. The bottom lasted three months and the decline five months. Here we have a total of 8 months or more without bullish action. There is plenty of consolidation at the bottom and also above water. A long period of accumulation can lead to a strong performance. This is true marketwide.
REZUSDT—Renzo. Closing a full green session just now, the action is back above support. This is a great chart setup that is entertaining a massive bullish wave. One that unfolds fast and reaches high. One that keeps on going after the initial momentum dries out.
Namaste.
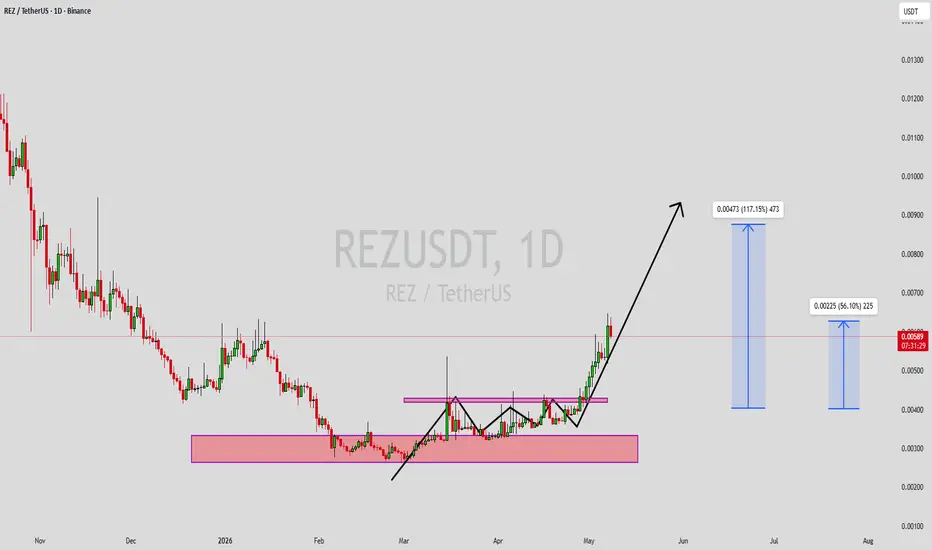
REZUSDT Forming Bullish MomentumREZUSDT is currently forming a clear bullish momentum pattern, a classic wave structure that often signals an upcoming breakout. The price has been consolidating within a narrowing range, indicating that selling pressure is gradually weakening while buyers are beginning to regain control. With consistent volume supporting accumulation at lower levels, the setup suggests a strong potential for a bullish breakout in the near term.
If the price breaks above the wedge resistance, the projected move could be significant, with a potential gain of around 90% to 100%. This type of bullish momentum pattern is typically seen at the end of downtrends or corrective phases, signaling a possible shift in market sentiment from bearish to bullish.
Traders closely monitoring REZUSDT are observing strengthening momentum as it approaches a key breakout zone. The presence of solid trading volume adds confidence to this setup, indicating that market participants may be positioning early in anticipation of a reversal.
Growing investor interest in REZUSDT reflects rising confidence in its technical structure and overall potential. If the breakout is confirmed with strong and sustained volume, it could mark the beginning of a fresh bullish leg. This setup may present a valuable opportunity for medium-term traders as momentum builds and the pattern completes.
✅ Show your support by hitting the like button
✅ Leave a comment below (What is your opinion about this coin?)
Your feedback and engagement keep me motivated to share more insightful market analysis with you!
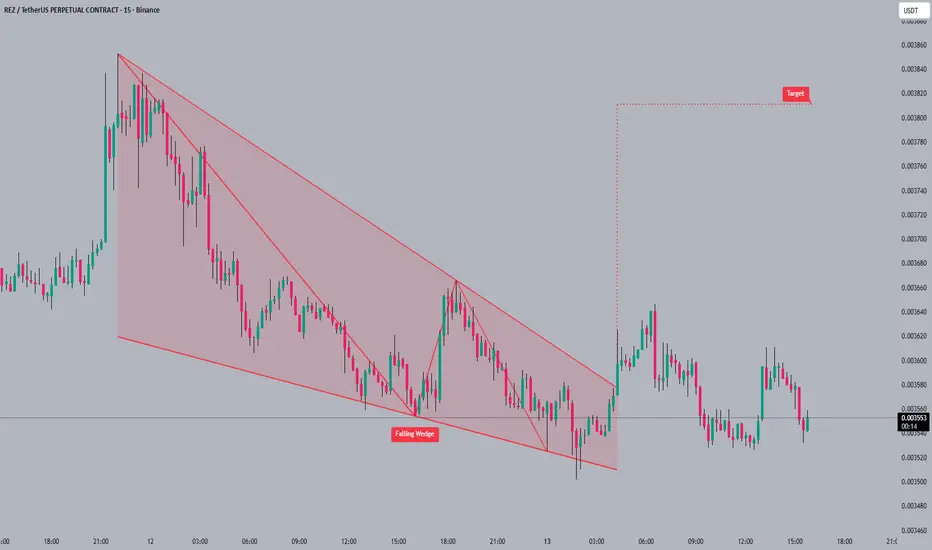
#REZ#REZ has broken out of a falling wedge pattern 🚀 and is currently consolidating near the breakout point. The falling wedge suggests a potential bullish reversal 📈 after a period of downward price action. The next target for #REZ is around 0.003820 which is the projected height of the wedge📐.
Be patient; not every trade is a winner, and risk management is crucial to long-term success🧠.
#REZ #crypto #trading #altcoin
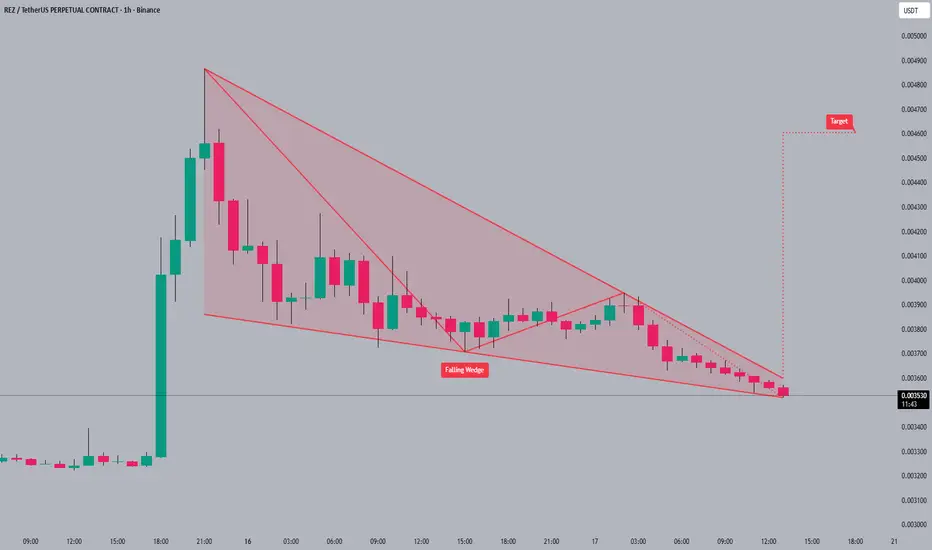
#REZ#REZ is currently trading within a falling wedge pattern 📉, hinting at a potential reversal. The falling wedge formation 📐 suggests decreasing selling pressure, which could lead to a breakout. The next target for #REZ is around 0.0046 USDT, if the breakout is confirmed 🚀.
A breakout from a falling wedge can lead to a rapid price increase as trapped shorts cover their positions 🐂.
#REZ #crypto #trading #altcoin
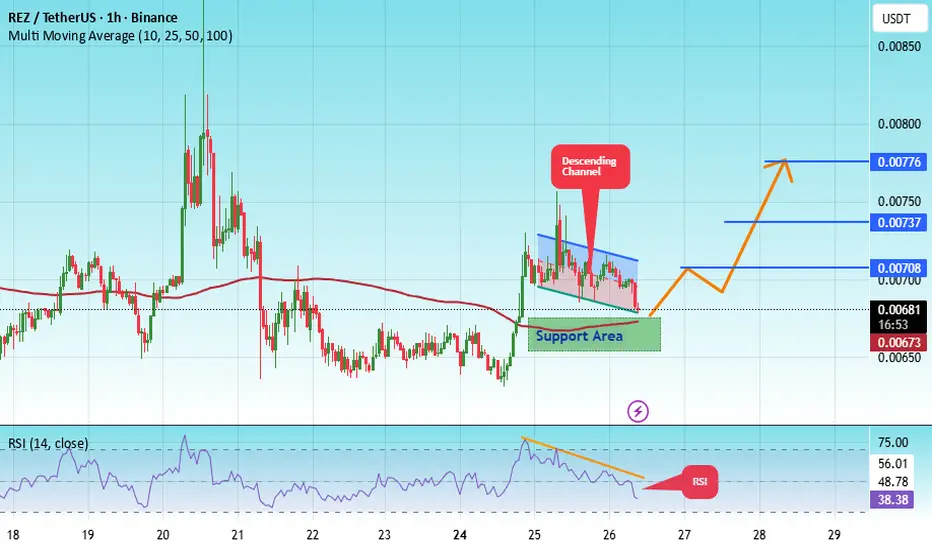
#REZ/USDT - BULLISH WAVE LOADING!!#REZ
The price is moving within an ascending channel on the 1-hour timeframe and is adhering to it well. It is poised to break out strongly and retest the channel.
We have a downtrend line on the RSI indicator that is about to break and retest, which supports the upward move.
There is a key support zone in green at 0.00663, representing a strong support point.
We have a trend of consolidation above the 100-period moving average.
Entry price: 0.00683
First target: 0.00708
Second target: 0.00737
Third target: 0.00776
Don't forget a simple money management rule:
Place your stop-loss order below the green support zone.
Once you reach the first target, save some money and then change your stop-loss order to an entry order.
For any questions, please leave a comment.
Thank you.
$REZ/USDT 4H CHART UPDATE: #REZ is currently consolidating $REZ/USDT 4H CHART UPDATE:
#REZ is currently consolidating inside a symmetrical triangle, showing clear signs of compression before a possible breakout. A move above the upper trendline around $0.0132 could trigger bullish momentum toward $0.015–$0.017.
As long as REZ holds above $0.012 support, the structure remains positive. Watch for volume confirmation on the breakout that’s when the real move begins.
REZ / USDT : Approaching Trendline resistance with potentialREZ / USDT is approaching trend line resistance with strong potential. A successful breakout from this level could trigger a bullish rally of 50–60% in the short term.
Keep a close watch and always wait for confirmation before entering. Manage risk wisely.
REZUSDT UPDATE#REZ
UPDATE
REZ Technical Setup
Pattern: Bullish falling wedge pattern
Current Price: $0.037
Target Price: $0.057
Target % Gain: 55.12%
AMEX:REZ is breaking out of a falling wedge pattern on the 1D timeframe. Current price is $0.037 with a target near $0.057, showing about 55% potential upside. The breakout signals renewed bullish momentum with structure favoring further continuation. Always use proper risk management.
Time Frame: 1D
Risk Management Tip: Always use proper risk management.
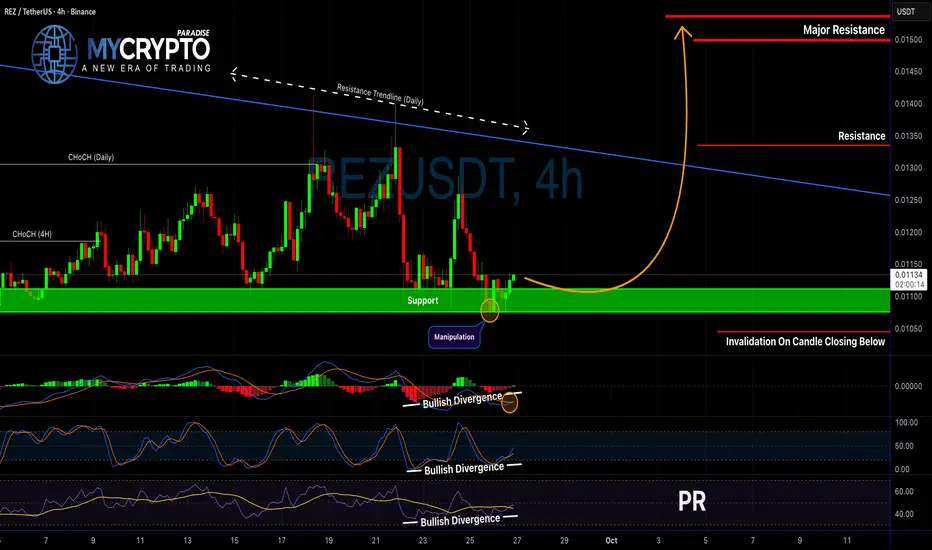
Is REZUSDT About to Explode or Collapse?Yello Paradisers! Have you been paying attention to REZUSDT lately? If not, you could be missing out on a major move that may catch many traders off guard. The pair has recently shown signs of manipulation following a clear accumulation phase, which significantly increases the probability that a distribution phase is now underway.
💎Price is currently sitting at a crucial support level, and before the manipulation occurred, we observed a clear Change of Character (CHoCH) on both the Daily and lower timeframes. This is a strong signal that most early buyers have been taken out, which often sets the stage for the real move to begin.
💎We’re also seeing strong bullish confluence across multiple indicators. The MACD, RSI, and Stochastic RSI are all showing divergence, which further supports the bullish thesis. On top of that, a key daily resistance trendline lies just above the current price and could act as a magnet, drawing the price higher in the short term. This setup is being supported by a double bottom structure forming on the higher timeframe, which we are actively trading from the lower timeframes in order to capture a higher risk-to-reward ratio. The alignment across multiple timeframes increases the probability of a sustained bullish move.
💎If you're looking for an entry, the current price zone offers a solid setup with a risk-to-reward of more than 1:2. A smart approach here would be to secure partial profits early and leave a small position running in case the price accelerates toward higher targets. However, if the price breaksdown & closes candle below our key invalidation level, the bullish scenario will be invalidated. In such a case, it’s better to step aside and wait for stronger confirmation rather than forcing a low-probability trade.
🎖Make sure you play it smart, Paradisers; the next 6–9 months will be juicy for some and painful for others. Discipline, patience, robust strategies, and trading tactics are the only ways you can make it long-term in this market.
MyCryptoParadise
iFeel the success🌴
REZUSDT 3DKeep an eye on the #REZ 3-day timeframe chart. It has formed a descending channel and is on the verge of breaking out above it. In case of a breakout, the potential mid-term targets are:
🎯 $0.01535
🎯 $0.02013
🎯 $0.02827
🎯 $0.03485
🎯 $0.04142
🎯 $0.05078
🎯 $0.06271
⚠️ Always remember to use a tight stop-loss and follow proper risk management.
REZ/USDT — Major Crossroads: Breakout New Trend or Drop to Lows?🔎 Overview
REZ/USDT on the 2D timeframe is at a critical stage. For months, price has been capped by a long-term descending trendline that has rejected every rally attempt since 2024. Now, the price is once again testing this trendline while holding inside the accumulation zone (0.010 – 0.013).
This zone has acted as a strong battleground between buyers and sellers. The next move will likely define the larger direction: will we see a bullish breakout or a continuation of the bearish trend?
---
📐 Technical Pattern
Long-Term Downtrend Line: consistent lower highs since mid-2024.
Accumulation Base: the yellow box shows strong demand where price repeatedly bounced.
Potential Breakout Setup: price is attempting to break out of the downtrend + accumulation base — often the start of a trend reversal if confirmed.
---
🟢 Bullish Scenario
1. A confirmed breakout requires a 2D candle close above the trendline and a move beyond 0.01826 resistance.
2. If confirmed, upside targets are:
🎯 Target 1: 0.01826 → +43%
🎯 Target 2: 0.03254 → +156%
🎯 Target 3: 0.04627 → +264%
🎯 Target 4: 0.06289 → +395%
3. Breakout strength will be validated if supported by high volume and a successful retest of the breakout zone turning into support.
---
🔴 Bearish Scenario
1. Failure to break the trendline may lead to another rejection and sideways movement inside the box.
2. A breakdown below the 0.010–0.009 range would trigger stronger downside pressure.
3. Extreme bearish target sits at the historical low of 0.00698 (≈ −45% from current price).
---
🎯 Trading Approach
Conservative: wait for a 2D close above 0.01826 + successful retest → safer entry with stronger confirmation.
Aggressive: enter on initial breakout above the trendline, stop loss below the accumulation zone (~0.009). Higher risk, higher reward.
Risk management: keep position sizes controlled. R:R to the 0.03254 target could reach 5:1, meaning much greater reward potential if the breakout is valid.
---
📝 Conclusion
REZ/USDT is at a crossroads. A valid breakout could end the long downtrend and open the path toward a major rally. However, failure here could drag the price back to historical lows.
This is the ultimate “wait for confirmation” setup: patience for 2D candle closes, volume signals, and retests will determine whether this is a false breakout or the start of a new trend.
---
#REZ #REZUSDT #CryptoAnalysis #BreakoutTrading #SupportResistance #Trendline #CryptoSignals #Altcoin
Trendline Breakout AlertREZ/USDT has been under a descending trendline for a long time.
Now the price has finally tested & broken out 🔥
🔑 Trading Plan:
✅ DCA zone already tapped (perfect accumulation entry).
✅ If price holds above breakout → first target 0.034 (20% book).
✅ Next target 0.065 (30% book).
🎯 Final upside zone: 0.17 – 0.186
📊 Risk Management:
Stoploss below 0.0069 = setup invalid.
Always stick to DCA strategy & take partial profits on the way up.
⚡️ This trade requires patience & discipline. If the breakout sustains → strong upside potential in the coming months.
REZ Tightens Into Apex With Breakout Pressure Building AMEX:REZ is winding up inside a symmetrical triangle on the 4H chart 🔺—and it’s nearing decision time.
The price is approaching the apex with reduced volatility, often a sign that a sharp move is around the corner.
Earlier, AMEX:REZ broke out of a falling wedge, but follow-through was weak. This current structure might be the second shot—if volume steps in, momentum could finally shift higher 📈
👀 Compression is tight, and breakout pressure is real.
Will bulls take control this time or is another fade incoming?
Not financial advice.
REZUSDT at a Critical Point– Testing a Major Long-Term TrendlineComplete Analysis:
The REZUSDT pair is currently showing a highly compelling setup, as price approaches a long-term descending trendline that has held since May 2024. This is a pivotal moment that could dictate the next significant move—either a bullish breakout or a bearish rejection continuation.
---
📉 Pattern and Structure
The chart is forming a large Descending Triangle pattern, with the descending trendline consistently pushing the price lower for over a year.
Price is now nearing a key horizontal resistance at approximately 0.01826 USDT, which also intersects with the long-term trendline.
The lowest support level sits at 0.00698 USDT, marking the bottom from a major previous decline.
---
📈 Bullish Scenario
If the price successfully breaks and closes above the trendline (~0.01826 USDT), then:
The next potential upside targets could be:
0.03254 USDT
0.04627 USDT
0.06289 USDT
This breakout could signal a trend reversal in the medium term, especially if accompanied by strong volume.
---
📉 Bearish Scenario
However, if the price gets rejected at this resistance area:
It could pull back toward:
The minor support at 0.01200 USDT
The major support at 0.00698 USDT
A rejection at this trendline would confirm the continuation of the bearish descending triangle pattern, which traditionally favors further downside.
---
🧠 Conclusion:
REZUSDT is currently in a make-or-break zone. The market’s reaction to the descending trendline will be crucial in determining the next move. Traders should monitor volume and wait for a solid candle confirmation before entering any position.
#REZUSDT #CryptoAnalysis #TechnicalAnalysis #AltcoinBreakout #DescendingTriangle #CryptoTrading #TrendlineBreak #SupportResistance #REZAnalysis #BreakoutWatch