REZ MACRO DOWNTREND BREAKOUT – PAY CLOSE ATTENTION! 🔥 #REZ MACRO DOWNTREND BREAKOUT – PAY CLOSE ATTENTION! 🚀📈
AMEX:REZ (Renzo/USDT) is officially breaking out of a multi-month descending resistance trendline on the 1W timeframe! After consolidating above its macro low at $0.002295, price has pushed cleanly past the diagonal resistance, signaling a potential trend reversal after a prolonged downtrend.
Holding firmly above this trendline support zone sets up a high-reward expansion wave toward major upper targets! 🎯
📊 Technical Snapshot:
• Tim
In-depth trading ideas
REZ Bullish Breakout — Will the Retest Hold?📊 Technical Analysis — AMEX:REZ
⏱️ Time Frame: 4D
📐 Pattern: Descending Channel — Bullish Breakout & Retest
---
🔎 Pattern Structure
📉 REZ previously traded within a Descending Channel, characterized by a series of lower highs and lower lows. Price consistently moved between the upper and lower trendlines of the channel.
🚀 The structure is now beginning to change after price successfully broke above the major resistance line of the Descending Channel.
🔄 Following the breakout, price is now
REZ — Critical Resistance: Breakout or Rejection?📊 Technical Analysis — REZ/USDT
⏳ Time Frame: 4D
📈 Pattern: Descending Trendline / Long-Term Downtrend
💵 Current Price Area: ~0.0032 USDT
---
🔻 DESCENDING TRENDLINE
REZ/USDT remains within a long-term bearish structure, clearly illustrated by the Descending Trendline connecting a series of lower highs since 2024.
📉 As long as price remains below the yellow trendline, bearish pressure remains dominant.
However, the current chart structure is becoming increasingly interesting as price approac
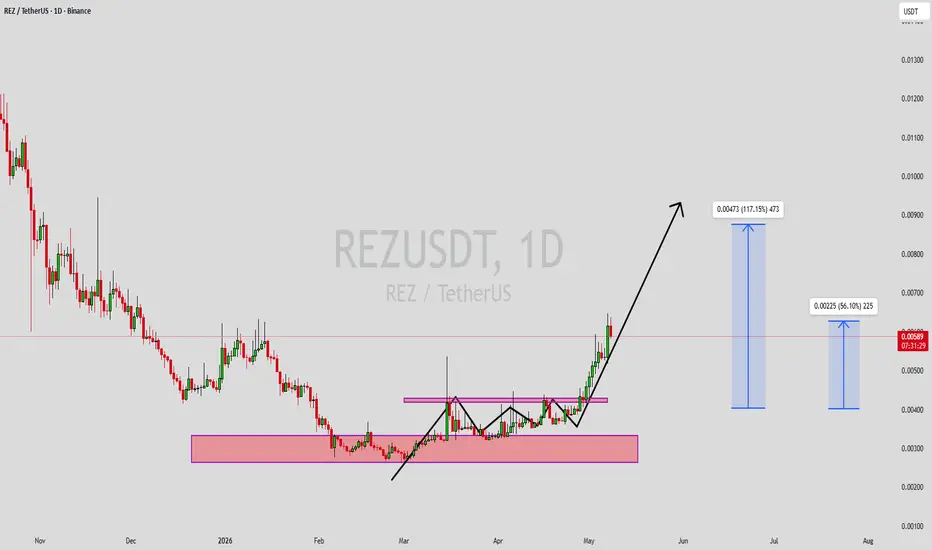
REZUSDT Forming Bullish MomentumREZUSDT is forming a clear bullish Momentum pattern, a classic bullish reversal signal that often indicates an upcoming breakout. The price has been consolidating within a narrowing range, suggesting that selling pressure is weakening while buyers are beginning to regain control. With consistent volume confirming accumulation at lower levels, the setup hints at a potential bullish breakout soon. The projected move could lead to an impressive gain of around 90% to 100% once the price breaks above
REZUSDT | Downtrend Exhaustion → Accumulation → Multi-StageREZUSDT | Downtrend Exhaustion → Accumulation → Multi-Stage Expansion Setup 🚀
REZUSDT has been in a prolonged bearish structure, respecting a clear descending trendline with consistent lower highs and controlled downside pressure. However, recent price action suggests that this trend is approaching exhaustion , with price stabilizing near a key accumulation zone.
━━━━━━━━━━━━━━━
📊 Market Structure Breakdown
• Extended downtrend with strong trendline respect
• Price compressing near low
REZUSDT Forming Bullish MomentumREZUSDT is forming a clear bullish momentum pattern, a classic bullish wave signal that often indicates an upcoming breakout. The price has been consolidating within a narrowing range, suggesting that selling pressure is weakening while buyers are beginning to regain control. With consistent volume confirming accumulation at lower levels, the setup hints at a potential bullish breakout soon. The projected move could lead to an impressive gain of around 40% to 50% once the price breaks above the
REZ/USDT - Breakout or Fake Move?The REZ/USDT (3D) chart is still in a medium–long term downtrend structure, clearly visible from the descending trendline resistance (yellow line) that has been consistently pushing price down since the early distribution phase. 📉
However, there are early signs that selling pressure is starting to weaken, and a potential accumulation phase may be forming. 🔄
---
📊 Structure & Patterns Forming
🔻 Descending Trendline (Major Resistance)
Price continues to fail breaking this line → indicating st
Renzo (REZ) Enters Bullish Territory w/320% Easy TargetThe low process in 2025 lasted one month and it was followed by a bullish wave. The bullish wave was relatively small, showing that a lack of consolidation and accumulation at support leads to poor performance.
In 2026 the bottom process lasted three months—there is more. The bottom lasted three months and the decline five months. Here we have a total of 8 months or more without bullish action. There is plenty of consolidation at the bottom and also above water. A long period of accumulation ca
REZUSDT Forming Bullish MomentumREZUSDT is currently forming a clear bullish momentum pattern, a classic wave structure that often signals an upcoming breakout. The price has been consolidating within a narrowing range, indicating that selling pressure is gradually weakening while buyers are beginning to regain control. With consistent volume supporting accumulation at lower levels, the setup suggests a strong potential for a bullish breakout in the near term.
If the price breaks above the wedge resistance, the projected move
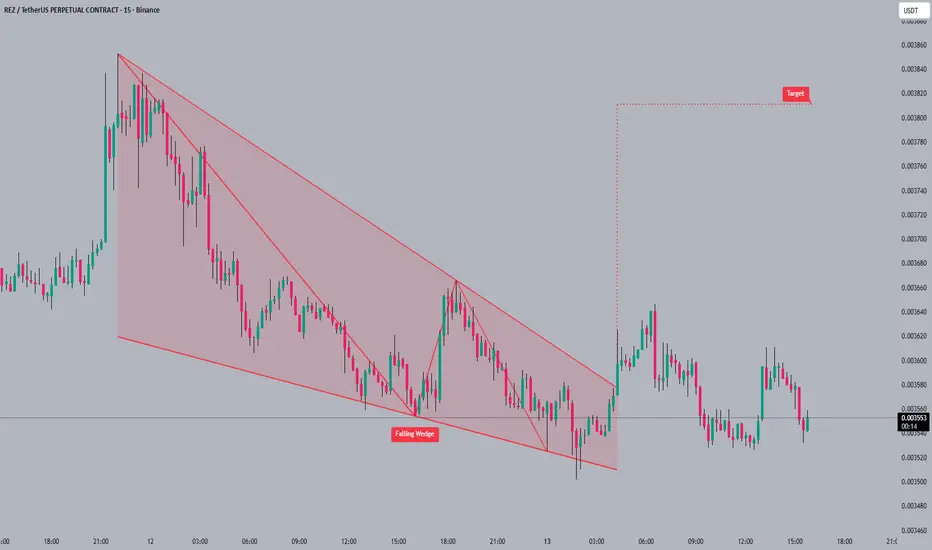
#REZ#REZ has broken out of a falling wedge pattern 🚀 and is currently consolidating near the breakout point. The falling wedge suggests a potential bullish reversal 📈 after a period of downward price action. The next target for #REZ is around 0.003820 which is the projected height of the wedge📐.
Be patient; not every trade is a winner, and risk management is crucial to long-term success🧠.
#REZ #crypto #trading #altcoin
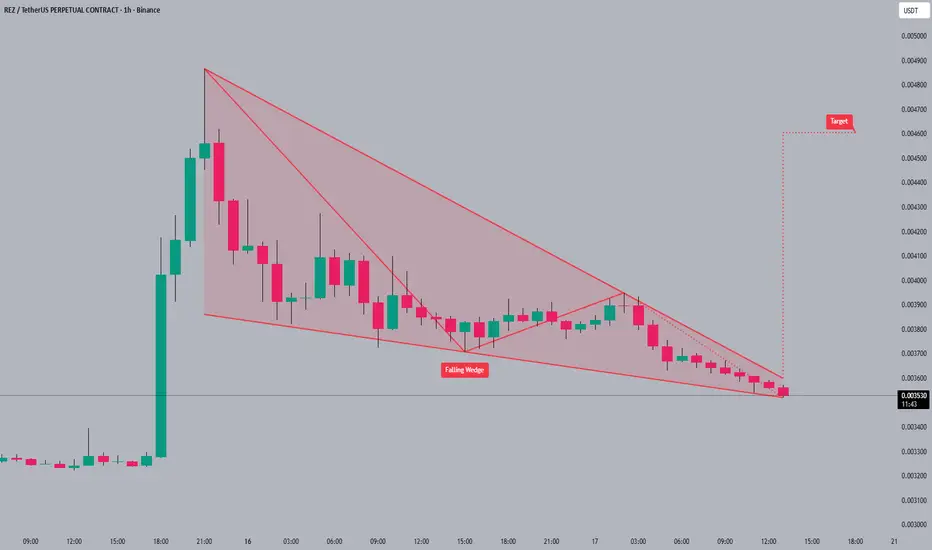
#REZ#REZ is currently trading within a falling wedge pattern 📉, hinting at a potential reversal. The falling wedge formation 📐 suggests decreasing selling pressure, which could lead to a breakout. The next target for #REZ is around 0.0046 USDT, if the breakout is confirmed 🚀.
A breakout from a falling wedge can lead to a rapid price increase as trapped shorts cover their positions 🐂.
#REZ #crypto #trading #altcoin
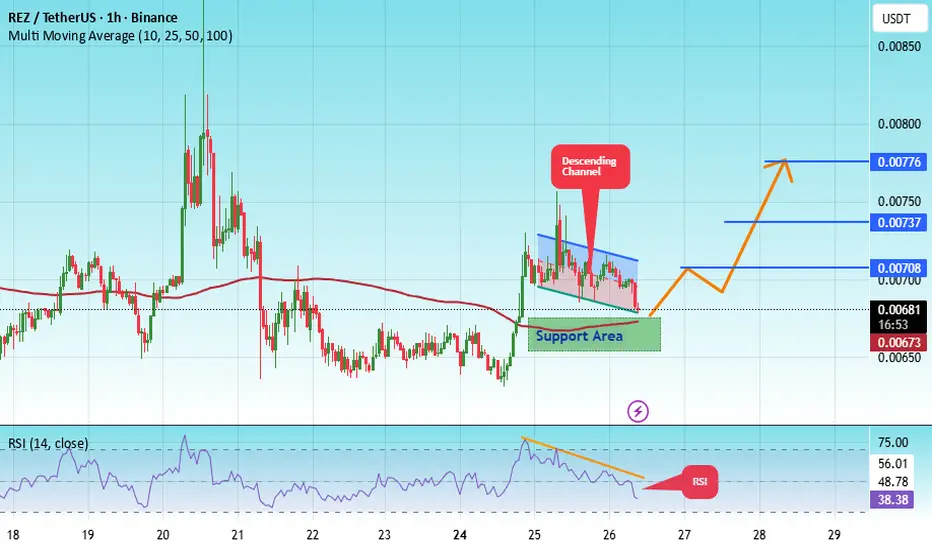
#REZ/USDT - BULLISH WAVE LOADING!!#REZ
The price is moving within an ascending channel on the 1-hour timeframe and is adhering to it well. It is poised to break out strongly and retest the channel.
We have a downtrend line on the RSI indicator that is about to break and retest, which supports the upward move.
There is a key support zone in green at 0.00663, representing a strong support point.
We have a trend of consolidation above the 100-period moving average.
Entry price: 0.00683
First target: 0.00708
Second target: 0.00
$REZ/USDT 4H CHART UPDATE: #REZ is currently consolidating $REZ/USDT 4H CHART UPDATE:
#REZ is currently consolidating inside a symmetrical triangle, showing clear signs of compression before a possible breakout. A move above the upper trendline around $0.0132 could trigger bullish momentum toward $0.015–$0.017.
As long as REZ holds above $0.012 support, the structure remains positive. Watch for volume confirmation on the breakout that’s when the real move begins.
REZ / USDT : Approaching Trendline resistance with potentialREZ / USDT is approaching trend line resistance with strong potential. A successful breakout from this level could trigger a bullish rally of 50–60% in the short term.
Keep a close watch and always wait for confirmation before entering. Manage risk wisely.
REZUSDT UPDATE#REZ
UPDATE
REZ Technical Setup
Pattern: Bullish falling wedge pattern
Current Price: $0.037
Target Price: $0.057
Target % Gain: 55.12%
AMEX:REZ is breaking out of a falling wedge pattern on the 1D timeframe. Current price is $0.037 with a target near $0.057, showing about 55% potential upside. The breakout signals renewed bullish momentum with structure favoring further continuation. Always use proper risk management.
Time Frame: 1D
Risk Management Tip: Always use proper risk management.
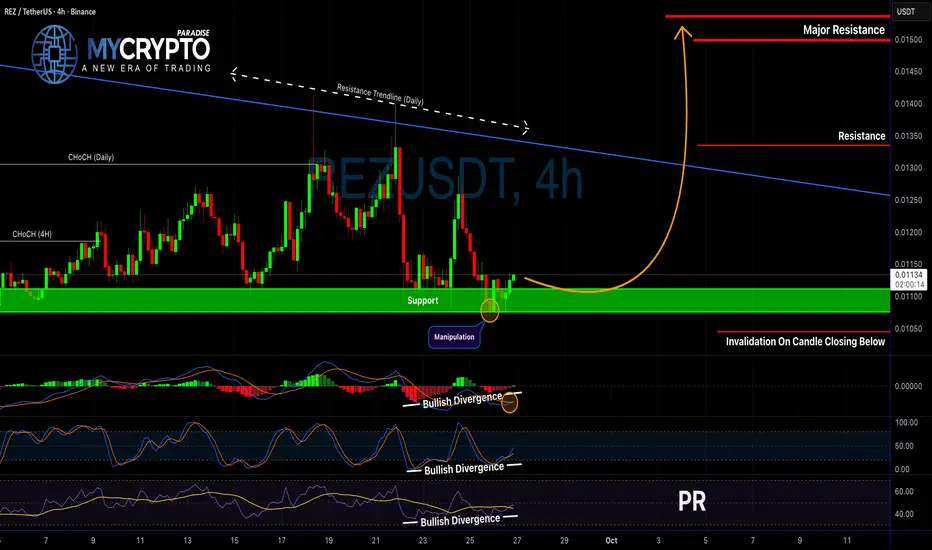
Is REZUSDT About to Explode or Collapse?Yello Paradisers! Have you been paying attention to REZUSDT lately? If not, you could be missing out on a major move that may catch many traders off guard. The pair has recently shown signs of manipulation following a clear accumulation phase, which significantly increases the probability that a distribution phase is now underway.
💎Price is currently sitting at a crucial support level, and before the manipulation occurred, we observed a clear Change of Character (CHoCH) on both the Daily and l