ROBO BREAKOUT OR REJECTION? CRITICAL DESCENDING TRENDLINE TEST!📊 Technical Analysis — $ROBO/USDT
💵 Coin: AMEX:ROBO #ROBO
⏳ Time Frame: 1D
📉 Pattern: Descending Trendline 🔻
💰 Current Price: ~0.01384
🎯 Key Resistance: 0.01450
🚀 Breakout Levels: 0.01620 → 0.01750
🎯 Major Target Zone: 0.02000 – 0.02180
---
📉🔻 Pattern: Descending Trendline
🔻 Price is currently moving beneath a clear Descending Trendline, indicating that the overall market structure remains bearish. 📉
📉 The trendline has repeatedly acted as dynamic resistance, creating a series of Lower Highs (LH).
🟢 However, price has recently bounced strongly from the ~0.01035 low area, showing that buyers are beginning to defend the lower zone. 💪🔥
👀 The current price is approaching the important 0.01450 resistance, which is also positioned close to the Descending Trendline.
---
🟢🚀 BULLISH SCENARIO
💥 The key confirmation is a breakout above the Descending Trendline.
📈 If AMEX:ROBO manages to achieve a Daily Candle Close above 0.01450 and the Descending Trendline, this could signal a temporary or potentially stronger reversal of the current bearish structure. 🚀🔥
🎯 First Resistance: 0.01620
🎯 Next Target: 0.01750
🎯 Major Resistance Zone: 0.02000 – 0.02180
🔥 A sustained breakout above 0.01750 would strengthen the bullish momentum and open the possibility of a move toward the 0.02000–0.02180 zone. 🚀📈
📌 Important: A simple wick above the trendline is not enough. ❌
✅ A confirmed Daily Close + Follow-through would provide stronger breakout confirmation.
---
🔴📉 BEARISH SCENARIO
⚠️ If AMEX:ROBO fails to break the Descending Trendline and gets rejected around 0.01450, sellers could regain control. 🐻📉
🔻 A rejection followed by a break below the recent support structure could send price back toward the lower levels.
🎯 Potential Downside Area: 0.01250 → 0.01110
🛑 Critical Low: ~0.01035
💀 If 0.01035 is decisively broken, the current bullish rebound would be significantly weakened and the bearish trend could continue. 📉🔻
---
🧠🔍 KEY LEVELS TO WATCH
🔴 0.01450 — Immediate breakout / resistance area 🚨
🟡 0.01620 — First important bullish target 🎯
🟡 0.01750 — Major resistance / breakout confirmation zone 🔥
🟡 0.02000 – 0.02180 — Major target & resistance zone 🚀
🟢 0.01035 — Critical swing low / key support area 🛡️
---
📌🔥 CONCLUSION
AMEX:ROBO remains bearish while price stays below the Descending Trendline. 📉🐻
However, the recent recovery from 0.01035 shows increasing buying pressure. 🟢💪
👀 The most important moment will be the reaction around 0.01450 + the Descending Trendline.
🚀 Breakout & Daily Close above the trendline → Bullish scenario activated.
🔻 Rejection from the trendline → Bearish continuation remains possible.
⚡ The chart currently presents a BREAKOUT-OR-REJECTION setup, so confirmation is more important than entering purely on anticipation. 🎯🧠
---
#ROBO #ROBOUSDT #FabricProtocol #Crypto #CryptoAnalysis #TechnicalAnalysis #CryptoTrading #Altcoins #AltcoinAnalysis #PriceAction #DescendingTrendline #TrendlineBreakout #BullishBreakout #BearishTrend #CryptoSignals 🚀📊
ROBOUSDT Perpetual Contract
No trades
No trades
In-depth trading ideas
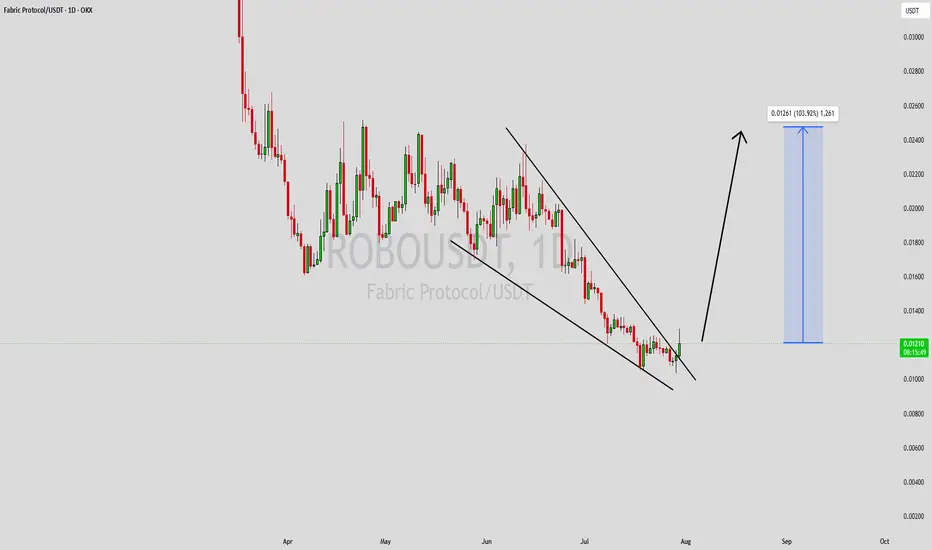
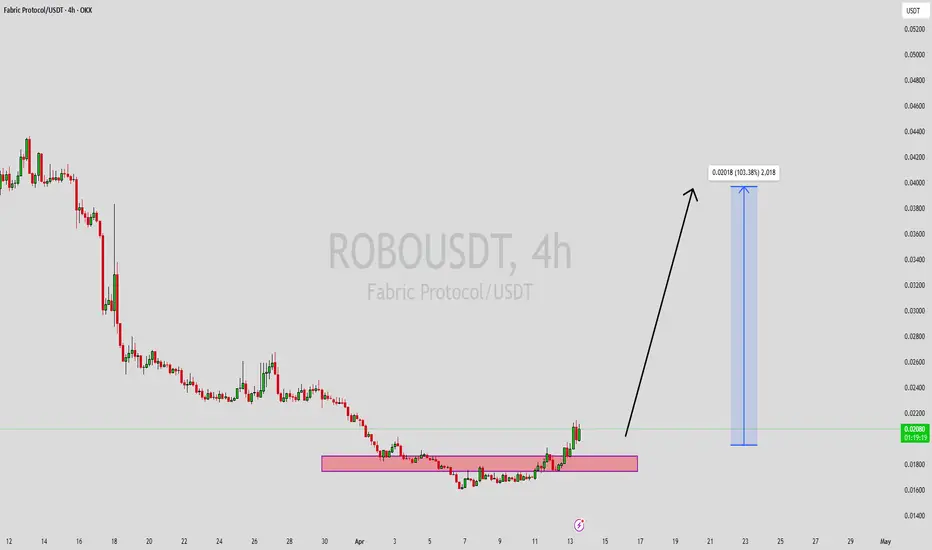
ROBOUSDT Forming Falling WedgeROBOUSDT is forming a clear falling wedge pattern, a classic bullish wave signal that often indicates an upcoming breakout. The price has been consolidating within a narrowing range, suggesting that selling pressure is weakening while buyers are beginning to regain control. With consistent volume confirming accumulation at lower levels, the setup hints at a potential bullish breakout soon. The projected move could lead to an impressive gain of around 90% to 100% once the price breaks above the wedge resistance.
This falling wedge pattern is typically seen at the end of downtrends or corrective phases, and it represents a potential shift in market sentiment from bearish to bullish. Traders closely watching ROBOUSDT are noting the strengthening momentum as it nears a breakout zone. The healthy trading volume adds confidence to this pattern, showing that market participants are positioning early in anticipation of a reversal.
Investors' growing interest in ROBOUSDT reflects rising confidence in the project's long-term fundamentals and current technical strength. If the breakout confirms with sustained buying volume, this could mark the start of a fresh bullish leg. Traders might find this a valuable setup for medium-term gains, especially as the falling wedge pattern completes and buying momentum continues to accelerate.
✅ Show your support by hitting the like button and
✅ Leaving a comment below! (What is You opinion about this Coin)
Your feedback and engagement keep me inspired to share more insightful market analysis with you!
ROBOBINANCE:ROBOUSDT
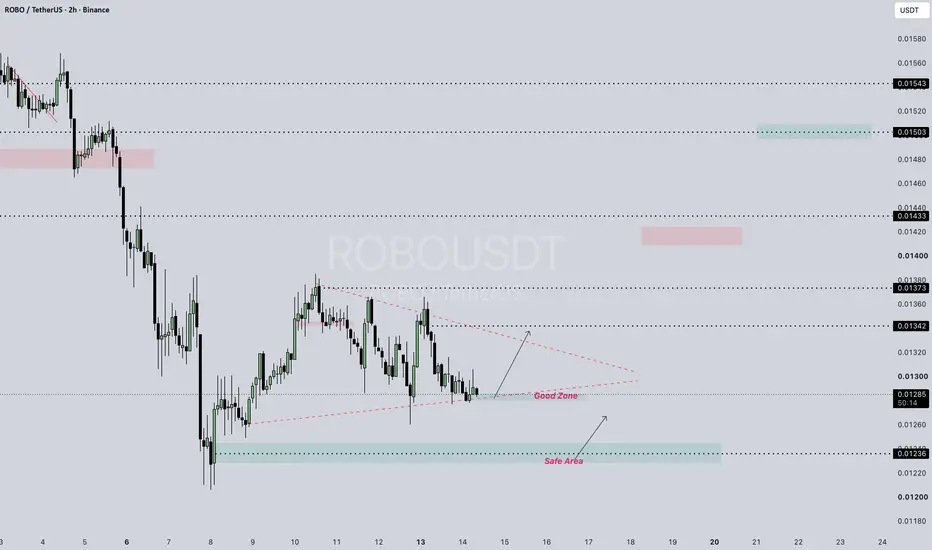
**Analysis:** 📊
- Current price: **~0.01287 USDT** 🔍
- Resistance: **0.01342 – 0.01360** 🚧
- Major resistance: **0.01433 – 0.01460** ⛰️
- Support: **0.01300 – 0.01287** 🛡️
- Major support: **0.01260 – 0.01343-0.01434- 0.01533** ⚓
**Bounce Zone:** 🔁
- Price is sitting near support around **0.01300 – 0.01287** 📍
- Bounce possible from current area if support holds ✅
Disclaimer: Not Financial Advice. Low Cap. ⚠️
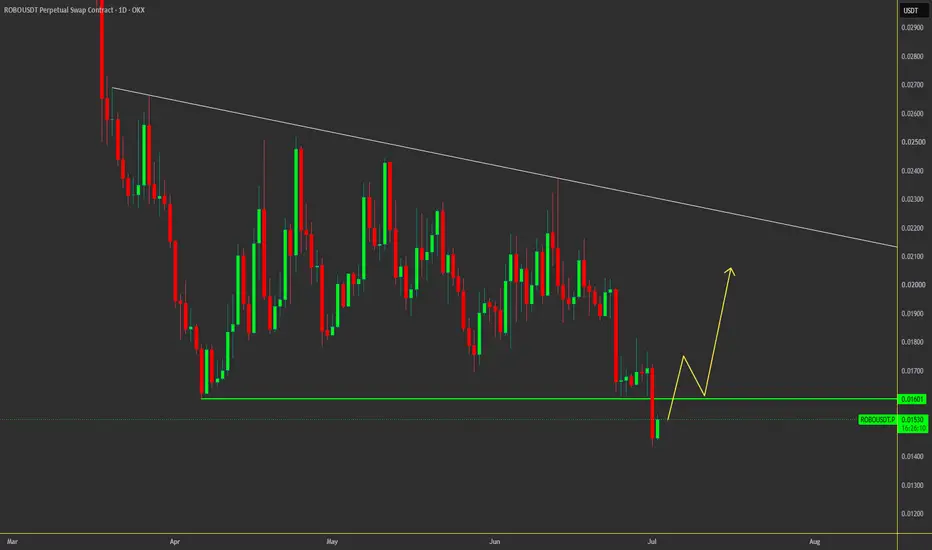
ROBO - Waiting for Reclaim of 0.01601 to Target Descending TrendI am waiting for a daily close above the green support line at 0.01601 to confirm that the breakdown was indeed a fakeout. If ROBO successfully reclaims and holds above this level, I will look for a long entry on the retest.
The primary target for this setup will be the major descending trendline shown on the chart.
* **Entry Zone:** 0.01601 – 0.01650 (On a successful reclaim and retest)
* **Stop Loss (Aggressive):** 0.01480 (Below the local consolidation/support reclaim zone)
* **Stop Loss (Conservative):** 0.01380 (Below the recent liquidity sweep low)
**Targets (Take Profits):**
* **TP1:** 0.01780 (Local minor resistance)
* **TP2:** 0.01950 (Previous swing high)
* **TP3 (Main Target):** 0.02100 – 0.02150 (Descending trendline resistance area)
Please apply proper risk management to protect your capital. This analysis represents my personal perspective and is not financial advice. Good luck!
Fabric Protocol (ROBO): The Cryptocurrency Market ConspiracyI keep wondering, and feel free to wonder with me; this project isn't cashing either. What is happening?
I was hearing an argument that can be taken as some kind of conspiracy, a positive one for us Cryptocurrency lovers, holders, buyers, investors and traders, and it goes like this.
There is a fight between the Cryptocurrency market and the establishment, the market participants, the whales, are putting pressure on the system so that the necessary law that they want passed gets through and this is related to the present crash on the big projects. This one isn't crashing though.
Everybody is already invested in the market and they want to see it grow. With the institutions unloading, it puts pressure on the politicians to get things going, to get things rolling but... There is no need to go into conspiracy theories since a bear market always happens after a bull market. After the ATH on BTC, we get a correction, and this happens with or without external pressures.
Anyway, the law will get passed, interest rates will be lowered and there will be a major boom in the coming years. All this has already been decided.
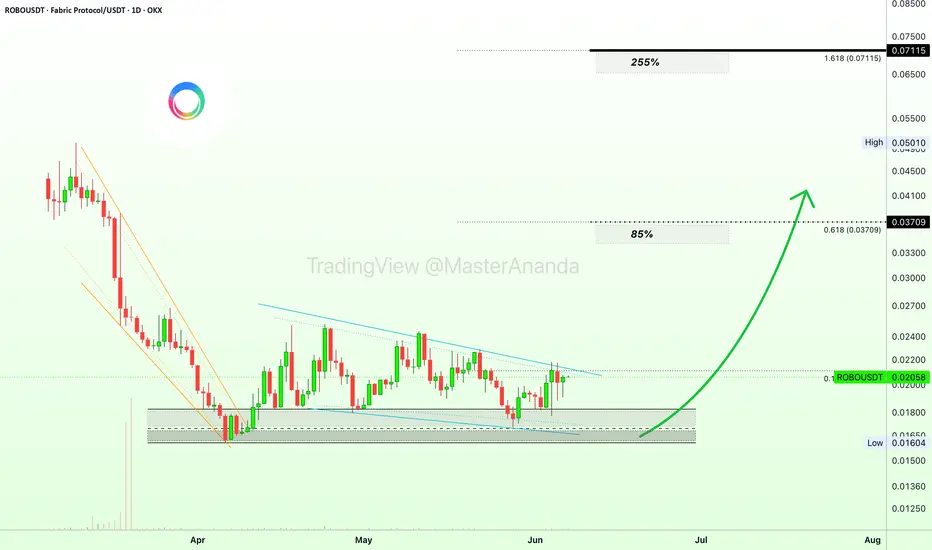
Here ROBOUSDT is looking good and this project managed to stay intact while the big altcoins crashed, and this is a very strong bullish signal. I am showing some short-term to mid-term targets but the current trading range can also be approached for long-term gains.
Thank you for reading.
Namaste.
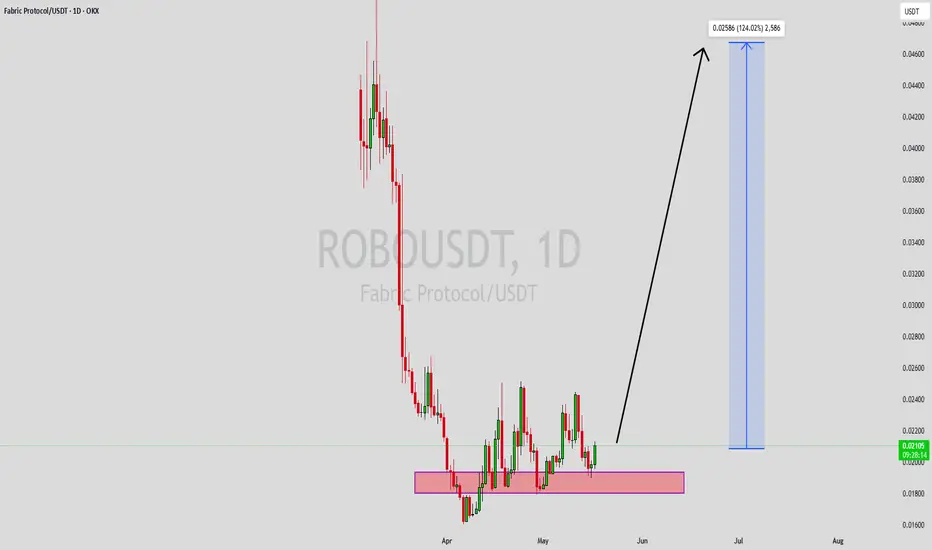
ROBOUSDT Forming Bullish MomentumROBOUSDT is forming a clear bullish momentum pattern, a classic bullish continuation signal that often points toward a strong breakout in the near future. The price has been consolidating within a tightening range, suggesting that selling pressure is gradually weakening while buyers continue to regain control around key support levels. This type of setup is commonly associated with accumulation phases before a major bullish move begins
The projected breakout from this bullish momentum structure could lead to an impressive gain of around 90% to 100% if the price confirms above the resistance zone with strong volume support. This pattern is frequently observed after corrective phases and may signal a transition from bearish sentiment into a fresh bullish trend.
Traders closely watching ROBOUSDT are noticing strengthening momentum as the price approaches a critical breakout area. The consistent trading volume adds confidence to the setup, showing that buyers may already be accumulating positions in anticipation of a bullish continuation move.
Growing investor interest in ROBOUSDT reflects increasing confidence in both its technical structure and long-term upside potential. If the breakout confirms with sustained buying pressure and strong follow-through momentum, this could mark the beginning of a powerful bullish wave.
✅ Show your support by hitting the like button and
✅ Leaving a comment below! (What is your opinion about this coin?)
Your feedback and engagement keep me inspired to share more insightful market analysis with you!
$ROBOUSDT | 1H – Bullish Pullback SetupBINANCE:ROBOUSDT is currently in a healthy pullback phase after a strong impulsive move to the upside, respecting a clear ascending trend structure.
After tapping the local high near $0.0215, price is retracing into a key support + Fibonacci confluence zone, which aligns with prior structure and moving averages.
Key Support Zone:
$0.01892 – $0.01856
(0.5 – 0.618 Fib retracement + dynamic EMA support)
Entry Zone:
$0.0189 – $0.0192 (on confirmation / bounce)
Targets:
• TP1: $0.02048
• TP2: $0.02192
Stop Loss:
$0.01832
Technical Confluence:
Price respecting Fib retracement (0.5–0.618)
Ascending trendline intact (higher highs & higher lows)
EMA cluster acting as dynamic support
Prior breakout zone now flipping into support
Risk Note:
Break below $0.0183 invalidates bullish structure and may lead to deeper retracement.
Summary:
This is a classic trend continuation setup, where buyers may step in at discount levels. Watch for confirmation before entry as momentum is cooling short-term.
ROBOUSDT Forming Bullish MomentumROBOUSDT is forming a clear bullish momentum pattern, a classic bullish reversal signal that often indicates an upcoming breakout. The price has been consolidating within a narrowing range, suggesting that selling pressure is weakening while buyers are beginning to regain control. With consistent volume confirming accumulation at lower levels, the setup hints at a potential bullish breakout soon. The projected move could lead to an impressive gain of around 90% to 100% once the price breaks above the wedge resistance.
This bullish momentum pattern is typically seen at the end of downtrends or corrective phases, and it represents a potential shift in market sentiment from bearish to bullish. Traders closely watching ROBOUSDT are noting the strengthening momentum as it nears a breakout zone. The good trading volume adds confidence to this pattern, showing that market participants are positioning early in anticipation of a reversal.
Investors’ growing interest in ROBOUSDT reflects rising confidence in the project’s long-term fundamentals and current technical strength. If the breakout confirms with sustained volume, this could mark the start of a fresh bullish leg. Traders might find this a valuable setup for medium-term gains, especially as the pattern completes and buying momentum accelerates.
✅ Show your support by hitting the like button and
✅ Leaving a comment below! (What is your opinion about this Coin?)
Your feedback and engagement keep me inspired to share more insightful market analysis with you!
Massive Target in RobousdtHello Traders!
There is a massive buy trade in Robousdt and Robo is now at the bottom of bearish trend. This is not a pattern analyzed trade but its analyzed with many different methods.
The target is massive in ROBO
Stoploss 0.01754(-11.6%)
Target 0.03243(+64%)
My aim is to achieve highest win rate in tradingview trading community :) and we will definitely do that.
Trade Analysis Based On:
• A1000x Master Reversal Strategy
• A1000x Secret S/R Strategy
• Candlestick Patterns
• A1000x Stop Loss & Target Strategy
We trade using carefully developed strategies and disciplined market analysis, always seeking the best possible accuracy while remembering that ultimate success comes only by the will of Allah.
In some trades, you may notice a relatively larger stop loss or a risk-to-reward ratio that may appear unusual at first glance. However, every trade is taken with proper planning and calculated analysis, not random entries.
Before entering any position, we perform detailed calculations and market evaluation. Based on this analysis, we carefully determine our stop loss and target levels.
I personally apply one of my specialized stop-loss and target strategies, designed to place the stop loss at a logical market level where price is less likely to reach before moving toward the intended target — InshaAllah.
Trading always involves risk, but with discipline, patience, and proper strategy, we aim for consistent and responsible decision-making.
Feel free to share your thoughts, leave a comment, or contact me.
Re Entering in RoboHello Traders!
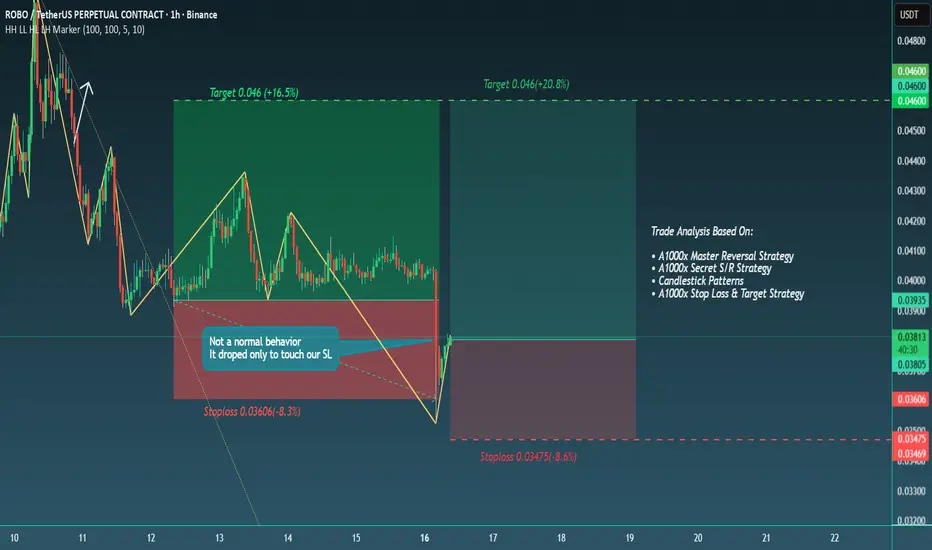
We are entering ROBOUSDT once again with same Target but different stoploss
First of all, let me clarify that we are not trading with basic strategies. Our approach is based on advanced market analysis and precise calculations. When analyzed correctly, the probability of the market reaching our target is 99%.
In the previous losing trade, the short setup was affected by human error during the analysis, which is always a possibility in trading. However, this time the structure and market behavior are very clear.
The previous move was not a normal market movement. The price dropped sharply and hit our stoploss with precision, which clearly indicates the nature of that move. Now the situation is much clearer, and we are re-entering the market.
My aim is to achieve highest win rate in tradingview trading community :) and we will definitely do that.
Trade Analysis Based On:
• A1000x Master Reversal Strategy
• A1000x Secret S/R Strategy
• Candlestick Patterns
• A1000x Stop Loss & Target Strategy
We trade using carefully developed strategies and disciplined market analysis, always seeking the best possible accuracy while remembering that ultimate success comes only by the will of Allah.
In some trades, you may notice a relatively larger stop loss or a risk-to-reward ratio that may appear unusual at first glance. However, every trade is taken with proper planning and calculated analysis, not random entries.
Before entering any position, we perform detailed calculations and market evaluation. Based on this analysis, we carefully determine our stop loss and target levels.
I personally apply one of my specialized stop-loss and target strategies, designed to place the stop loss at a logical market level where price is less likely to reach before moving toward the intended target — InshaAllah.
Trading always involves risk, but with discipline, patience, and proper strategy, we aim for consistent and responsible decision-making.
Feel free to share your thoughts, leave a comment, or contact me.
Bulls turn in RobousdtHello Traders!
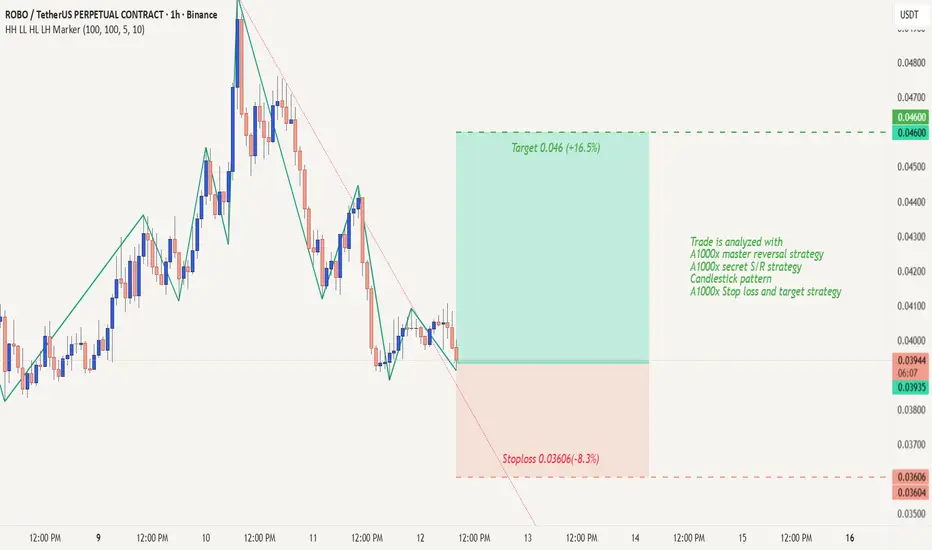
Robousdt is almost at the bottom of this bearish trend and now its ready to skyrocket towards the target.
Stoploss 0.03606(-8.5%)
Target 0.046 (+16.5%)
My aim is to achieve highest win rate in tradingview trading community :) and we will definitely do that.
Trade is analyzed with
A1000x master reversal strategy
A1000x secret S/R strategy
Candlestick pattern
A1000x Stop loss and target strategy
We trade using carefully developed strategies and disciplined market analysis, always seeking the best possible accuracy while remembering that ultimate success comes only by the will of Allah.
In some trades, you may notice a relatively larger stop loss or a risk-to-reward ratio that may appear unusual at first glance. However, every trade is taken with proper planning and calculated analysis, not random entries.
Before entering any position, we perform detailed calculations and market evaluation. Based on this analysis, we carefully determine our stop loss and target levels.
I personally apply one of my specialized stop-loss and target strategies, designed to place the stop loss at a logical market level where price is less likely to reach before moving toward the intended target — InshaAllah.
Trading always involves risk, but with discipline, patience, and proper strategy, we aim for consistent and responsible decision-making.
Feel free to share your thoughts, leave a comment, or contact me.
ROBOUSDT strong bullish move incommingHello Traders!
It has formed strong bullish structure and it is about to explode. our Target is at perfect position and stoploss is also at the perfect position.
March- Trade no 03
Robousdt buy now at 0.0408
Stoploss 0.03849(-5.6%)
Target 0.0439 (+7.5%)
My aim is to achieve highest win rate in tradingview trading community :) and we will definitely do that.
Trade is analyzed with
A1000x master reversal strategy
A1000x secret S/R strategy
Candlestick pattern
A1000x Stop loss and target strategy
We are trading with most powerful methods in Market that can easily achieve unbeatable accuracy.
In Some trades you might see big stoploss or bad RR but you don't have to worry about that because we don't jump in the trade which will hit sl. We make some calculation and after that calculation we set our SL and target according to that. I use one of my Stoploss and target strategy and we make sure stoploss is at the price where market will not touch before hitting target.
Follow, Share and feel free to comment or contact me.