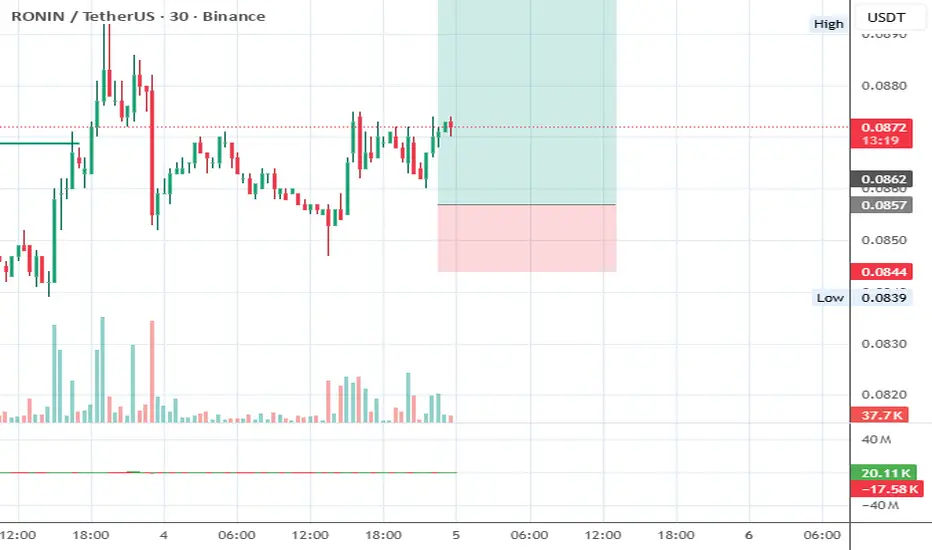
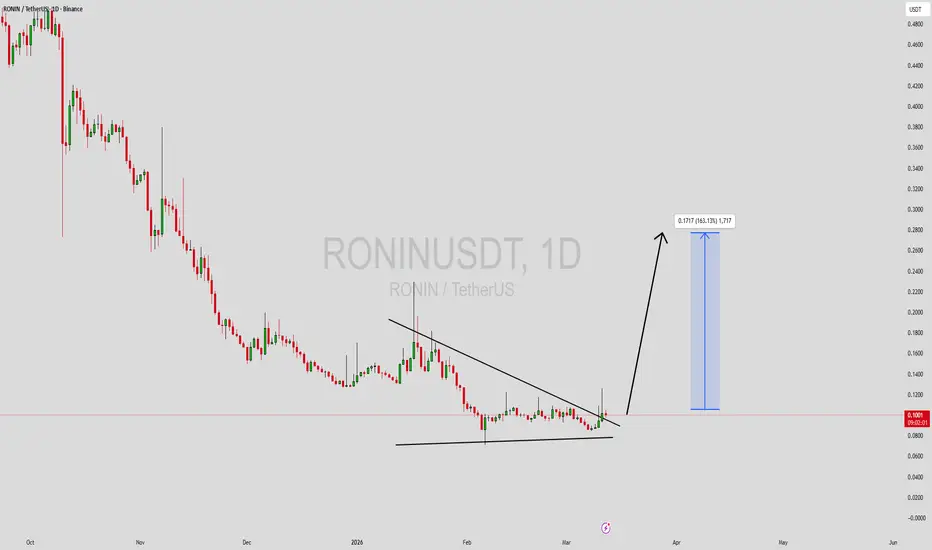
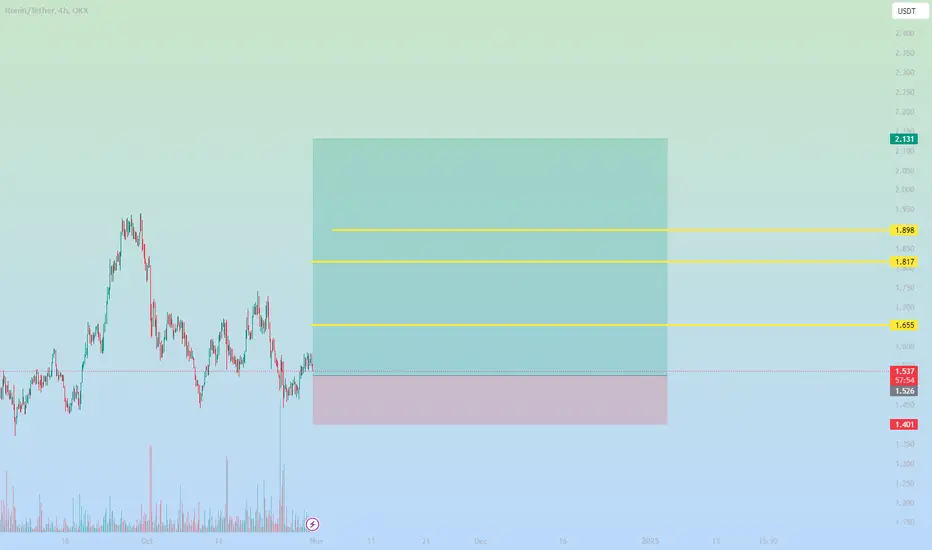
RONINUSDT Forming Bullish MomentumRONINUSDT is forming a clear bullish momentum pattern, a classic bullish wave signal that often indicates an upcoming breakout. The price has been consolidating within a narrowing range, suggesting that selling pressure is weakening while buyers are beginning to regain control. With consistent volume confirming accumulation at lower levels, the setup hints at a potential bullish breakout soon. The projected move could lead to an impressive gain of around 90% to 100% once the price breaks above the wedge resistance.
This bullish momentum pattern is typically seen at the end of downtrends or corrective phases, and it represents a potential shift in market sentiment from bearish to bullish. Traders closely watching RONINUSDT are noting the strengthening momentum as it nears a breakout zone. The good trading volume adds confidence to this pattern, showing that market participants are positioning early in anticipation of a reversal.
Investors’ growing interest in RONINUSDT reflects rising confidence in the project’s long-term fundamentals and current technical strength. If the breakout confirms with sustained volume, this could mark the start of a fresh bullish leg. Traders might find this a valuable setup for medium-term gains, especially as the wedge pattern completes and buying momentum accelerates.
✅ Show your support by hitting the like button!
✅ Leaving a comment below! (What is your opinion about this Coin?)
Your feedback and engagement keep me inspired to share more insightful market analysis with you!
In-depth trading ideas
RONINUSDT UPDATE
$RONIN Technical Setup
Pattern: Descending Triangle Breakout
Current Price: $0.1193
Target Price: $0.2100
Target % Gain: 90.18%
Technical Analysis: RONIN has broken out of a descending triangle pattern on the 1D timeframe with a strong bullish candle and momentum expansion. Price reclaimed the key resistance trendline near $0.11, signaling potential continuation toward the $0.21 target zone. Sustained buying volume could support further upside movement in the coming sessions.
RONINUSDT 1D#RONIN is ranging inside a box and moving above the Ichimoku cloud and the daily SMA100. It looks promising. In case of a breakout above the rectangle, the potential upside targets are:
🎯 $0.1163
🎯 $0.1268
🎯 $0.1372
🎯 $0.1520
🎯 $0.1709
⚠️ Always remember to use a tight stop-loss and maintain proper risk management.
RONINUSDT Forming Bullish MomentumRONINUSDT is forming a clear bullish momentum pattern, a classic bullish wave signal that often indicates an upcoming breakout. The price has been consolidating within a narrowing range, suggesting that selling pressure is weakening while buyers are beginning to regain control. With consistent volume confirming accumulation at lower levels, the setup hints at a potential bullish breakout soon. The projected move could lead to an impressive gain of around 60% to 70% once the price breaks above the wedge resistance.
This bullish momentum pattern is typically seen at the end of downtrends or corrective phases, and it represents a potential shift in market sentiment from bearish to bullish. Traders closely watching RONINUSDT are noting the strengthening momentum as it nears a breakout zone. The strong trading volume adds confidence to this pattern, showing that market participants may already be positioning early in anticipation of a reversal.
Investors’ growing interest in RONINUSDT reflects rising confidence in the project’s long-term fundamentals and current technical strength. If the breakout confirms with sustained volume, this could mark the start of a fresh bullish leg. Traders might find this a valuable setup for medium-term gains, especially as the momentum pattern completes and buying pressure accelerates.
✅ Show your support by hitting the like button and
✅ Leaving a comment below! (What is your opinion about this coin?)
Your feedback and engagement keep me inspired to share more insightful market analysis with you!
RONINUSDT Forming Bullish PennantRONINUSDT is forming a clear bullish pennant pattern, a classic bullish continuation signal that often indicates an upcoming breakout. The price has been consolidating within a narrowing range after a strong prior move, suggesting that selling pressure is fading while buyers build strength for the next leg up. With solid volume supporting the consolidation and showing accumulation, this setup points to a potential bullish breakout in the near term. The projected move could deliver an impressive gain of around 140% to 150% once the price breaks above the pennant resistance.
This bullish pennant pattern is typically seen after sharp upward advances, acting as a brief pause before resuming the bullish trend. Traders closely watching RONINUSDT are noting the tightening momentum as it approaches the breakout zone. The healthy trading volume adds real confidence here, indicating that participants are positioning themselves early for the continuation.
✅ Show your support by hitting the like button and
✅ Leaving a comment below! (What is your opinion about this Coin)
Your feedback and engagement keep me inspired to share more insightful market analysis with you!
RONINUSDT 1D#RONIN is trading within a falling wedge on the daily chart. It is currently sitting on the support and looks ready for a potential bounce. In case of a breakout above the daily SMA50 and the wedge resistance, the potential targets are:
🎯 $0.581
🎯 $0.718
🎯 $0.828
🎯 $0.938
🎯 $1.096
🎯 $1.296
⚠️ Always remember to use a tight stop-loss and maintain proper risk management.
RONINUSDT Forming Falling WedgeRONINUSDT is forming a falling wedge pattern, which is considered one of the strongest bullish reversal signals in technical analysis. The price action has been consolidating with lower highs and lower lows, but the decreasing slope of the wedge highlights a weakening bearish trend. With solid trading volume supporting the setup, the potential for a breakout to the upside is looking favorable. This technical structure suggests that the market could soon witness a significant shift in momentum.
Based on the current formation, the expected gain for RONINUSDT is projected to be around 30% to 40%+. Such gains are consistent with wedge breakouts, where prices typically surge after breaking above resistance. If bullish momentum continues, RONINUSDT could retest higher resistance levels, offering traders an attractive opportunity to ride the next bullish wave.
Investor interest in RONIN is also growing, adding strength to the overall outlook. As more participants focus on this project, liquidity and market sentiment continue to improve. This combination of technical signals and rising investor attention makes RONINUSDT an appealing pair to watch for both short-term traders and long-term holders.
✅ Show your support by hitting the like button and
✅ Leaving a comment below! (What is You opinion about this Coin)
Your feedback and engagement keep me inspired to share more insightful market analysis with you!
RONINUSDT.PAs i promised the more you follow the more analysis ill post here.
If you want to buy now you can this is a swing trade,, Buy now, hold and manage.
The price will likely to make a inverse head and shoulder.
I am not setting any target for this.. or s.l
This might be risky.. so only buy if you want to.
I will buy and suggest you to by only after trendline breakout with a strong volume and candles..
Just preparing you guys for the alts bull run.. one day we will wake up and see huge green day..
Follow me and support me..
Ronin: Low Risk vs High Reward Potential It is interesting the large amount of volume that has been coming in recently. Just yesterday it was the highest on a daily basis since November 2024 and we know November 2024 was a bullish month.
There is a very strong wipeout candle here, 30-May. These can be taken as a strong reversal signal but only at this juncture of course.
3-Feb we had a wipeout candle but there was no clear bottom in sight yet, and bearish volume was high and thus the market continued lower.
The one from 30-May is preceded by a bottom formation, so we know this one is the final low. Also, this candle is not present on other exchanges which is quite revealing. It means this exchange wanted to liquidate all its leveraged trades and activate all stop-loss orders. It certainly did.
So we ignore this candle but take from it that the bottom is already in. Confirmed. This means that growth will happen next and the high buy volume yesterday confirms this second statement. All in all, we can go LONG with a high probability of success.
Low risk vs a high potential for reward.
Namaste.
RONIN at Decision PointRONIN is currently reacting within a well defined immediate demand zone after completing a clear five-wave decline, marked by an extended corrective structure labeled WXY. This drop has brought price action into a technical exhaustion area, where buying interest is starting to emerge.
The confluence of channel support, wave completion, and horizontal demand makes this level a valid candidate for a short-term bullish bounce. A potential rally toward the $0.957 handle is likely if buyers can sustain momentum from here. This zone may act as a relief checkpoint before any further upside toward the $1.461 main supply area—where significant resistance is expected.
However, a failure to hold above this demand could open the door for a continuation lower, targeting the base support zone around $0.18–$0.21. This would signal deeper structural weakness and potentially complete a broader accumulation phase.
For now, eyes are on whether this bounce evolves into a meaningful move or remains a corrective pop in a larger bearish cycle. Stay sharp RONIN is at a pivotal inflection.
RONIN/USDTKey Level Zone: 0.4770 - 0.4800
HMT v8.1 detected. The setup looks promising, supported by a previous upward/downward trend with increasing volume and momentum, presenting an excellent reward-to-risk opportunity.
HMT (High Momentum Trending):
HMT is based on trend, momentum, volume, and market structure across multiple timeframes. It highlights setups with strong potential for upward movement and higher rewards.
Whenever I spot a signal for my own trading, I’ll share it. Please note that conducting a comprehensive analysis on a single timeframe chart can be quite challenging and sometimes confusing. I appreciate your understanding of the effort involved.
Important Note :
Role of Key Levels:
- These zones are critical for analyzing price trends. If the key level zone holds, the price may continue trending in the expected direction. However, momentum may increase or decrease based on subsequent patterns.
- Breakouts: If the key level zone breaks, it signals a stop-out. For reversal traders, this presents an opportunity to consider switching direction, as the price often retests these zones, which may act as strong support-turned-resistance (or vice versa).
My Trading Rules
Risk Management
- Maximum risk per trade: 2.5%.
- Leverage: 5x.
Exit Strategy
Profit-Taking:
- Sell at least 70% on the 3rd wave up (LTF Wave 5).
- Typically, sell 50% during a high-volume spike.
- Adjust stop-loss to breakeven once the trade achieves a 1.5:1 reward-to-risk ratio.
- If the market shows signs of losing momentum or divergence, ill will exit at breakeven.
The market is highly dynamic and constantly changing. HMT signals and target profit (TP) levels are based on the current price and movement, but market conditions can shift instantly, so it is crucial to remain adaptable and follow the market's movement.
If you find this signal/analysis meaningful, kindly like and share it.
Thank you for your support~
Sharing this with love!
HMT v2.0:
- Major update to the Momentum indicator
- Reduced false signals from inaccurate momentum detection
- New screener with improved accuracy and fewer signals
HMT v3.0:
- Added liquidity factor to enhance trend continuation
- Improved potential for momentum-based plays
- Increased winning probability by reducing entries during peaks
HMT v3.1:
- Enhanced entry confirmation for improved reward-to-risk ratios
HMT v4.0:
- Incorporated buying and selling pressure in lower timeframes to enhance the probability of trending moves while optimizing entry timing and scaling
HMT v4.1:
- Enhanced take-profit (TP) target by incorporating market structure analysis
HMT v5 :
Date: 23/01/2025
- Refined wave analysis for trending conditions
- Incorporated lower timeframe (LTF) momentum to strengthen trend reliability
- Re-aligned and re-balanced entry conditions for improved accuracy
HMT v6 :
Date : 15/02/2025
- Integrated strong accumulation activity into in-depth wave analysis
HMT v7 :
Date : 20/03/2025
- Refined wave analysis along with accumulation and market sentiment
HMT v8 :
Date : 16/04/2025
- Fully restructured strategy logic
HMT v8.1 :
Date : 18/04/2025
- Refined Take Profit (TP) logic to be more conservative for improved win consistency
Ron Who?What is the 4th most used blockchain after Btc, Eth and Sol?
That's right it's the gaming platform Ronin, but of course you knew that
The 1 day chart is forming a nice descending wedge - Confirmation of a breakout would be a candle opening above the wedge
We can expect a standard retracement to the 50% fib as a first target, but who knows, maybe the 4th most used blockchain could do much better
RONIN/USDTKey Level Zone : 1.8720 - 1.8780
HMT v4.1 detected. The setup looks promising, supported by a previous upward/downward trend with increasing volume and momentum, presenting an excellent reward-to-risk opportunity.
HMT (High Momentum Trending):
HMT is based on trend, momentum, volume, and market structure across multiple timeframes. It highlights setups with strong potential for upward movement and higher rewards.
Whenever I spot a signal for my own trading, I’ll share it. Please note that conducting a comprehensive analysis on a single timeframe chart can be quite challenging and sometimes confusing. I appreciate your understanding of the effort involved.
Important Note :
Role of Key Levels:
- These zones are critical for analyzing price trends. If the key level zone holds, the price may continue trending in the expected direction. However, momentum may increase or decrease based on subsequent patterns.
- Breakouts: If the key level zone breaks, it signals a stop-out. For reversal traders, this presents an opportunity to consider switching direction, as the price often retests these zones, which may act as strong support-turned-resistance (or vice versa).
My Trading Rules
Risk Management
- Maximum risk per trade: 2.5%.
- Leverage: 5x.
Exit Strategy
Profit-Taking:
- Sell at least 70% on the 3rd wave up (LTF Wave 5).
- Typically, sell 50% during a high-volume spike.
- Adjust stop-loss to breakeven once the trade achieves a 1.5:1 reward-to-risk ratio.
- If the market shows signs of losing momentum or divergence, ill will exit at breakeven.
The market is highly dynamic and constantly changing. HMT signals and target profit (TP) levels are based on the current price and movement, but market conditions can shift instantly, so it is crucial to remain adaptable and follow the market's movement.
If you find this signal/analysis meaningful, kindly like and share it.
Thank you for your support~
Sharing this with love!
HMT v2.0:
- Major update to the Momentum indicator
- Reduced false signals from inaccurate momentum detection
- New screener with improved accuracy and fewer signals
HMT v3.0:
- Added liquidity factor to enhance trend continuation
- Improved potential for momentum-based plays
- Increased winning probability by reducing entries during peaks
HMT v3.1:
- Enhanced entry confirmation for improved reward-to-risk ratios
HMT v4.0:
- Incorporated buying and selling pressure in lower timeframes to enhance the probability of trending moves while optimizing entry timing and scaling
HMT v4.1:
- Enhanced take-profit (TP) target by incorporating market structure analysis