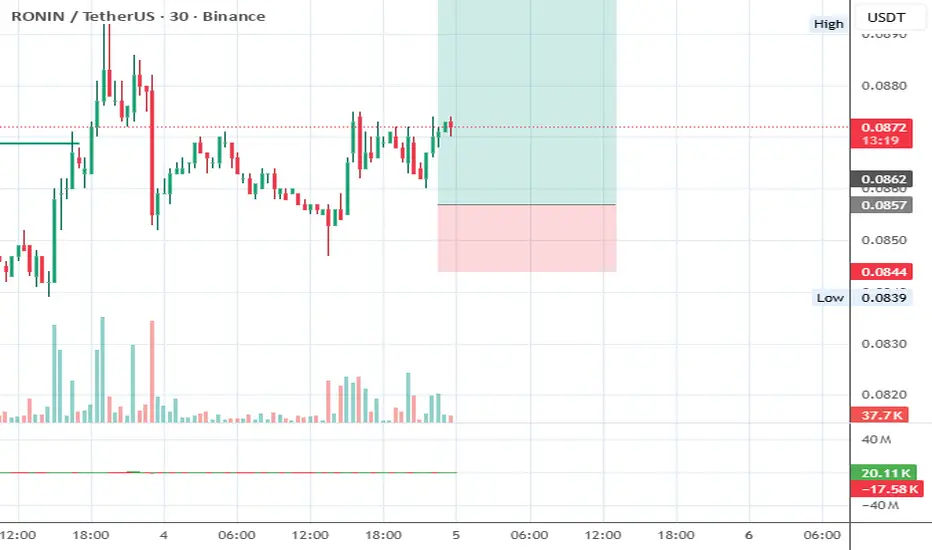
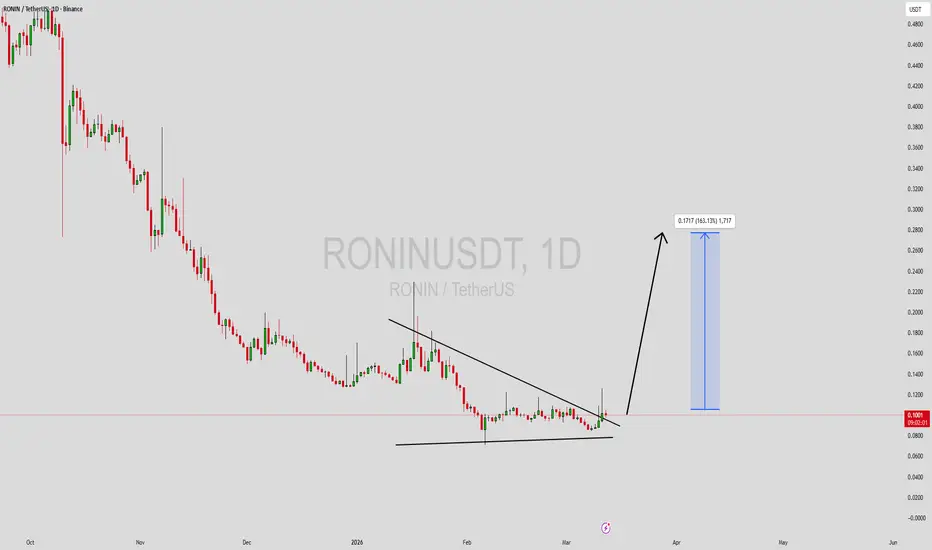
RONINUSDT Forming Bullish MomentumRONINUSDT is forming a clear bullish momentum pattern, a classic bullish wave signal that often indicates an upcoming breakout. The price has been consolidating within a narrowing range, suggesting that selling pressure is weakening while buyers are beginning to regain control. With consistent volum
Compare with RON/USDT
RONINUSDT UPDATE
$RONIN Technical Setup
Pattern: Descending Triangle Breakout
Current Price: $0.1193
Target Price: $0.2100
Target % Gain: 90.18%
Technical Analysis: RONIN has broken out of a descending triangle pattern on the 1D timeframe with a strong bullish candle and momentum expansion. Price reclaimed the k
RONINUSDT 1D#RONIN is ranging inside a box and moving above the Ichimoku cloud and the daily SMA100. It looks promising. In case of a breakout above the rectangle, the potential upside targets are:
🎯 $0.1163
🎯 $0.1268
🎯 $0.1372
🎯 $0.1520
🎯 $0.1709
⚠️ Always remember to use a tight stop-loss and maintain prope
RONINUSDT Forming Bullish MomentumRONINUSDT is forming a clear bullish momentum pattern, a classic bullish wave signal that often indicates an upcoming breakout. The price has been consolidating within a narrowing range, suggesting that selling pressure is weakening while buyers are beginning to regain control. With consistent volum
RONINUSDT Forming Bullish PennantRONINUSDT is forming a clear bullish pennant pattern, a classic bullish continuation signal that often indicates an upcoming breakout. The price has been consolidating within a narrowing range after a strong prior move, suggesting that selling pressure is fading while buyers build strength for the n
RONINUSDT 1D#RONIN is trading within a falling wedge on the daily chart. It is currently sitting on the support and looks ready for a potential bounce. In case of a breakout above the daily SMA50 and the wedge resistance, the potential targets are:
🎯 $0.581
🎯 $0.718
🎯 $0.828
🎯 $0.938
🎯 $1.096
🎯 $1.296
⚠️ Alwa
RONINUSDT Forming Falling WedgeRONINUSDT is forming a falling wedge pattern, which is considered one of the strongest bullish reversal signals in technical analysis. The price action has been consolidating with lower highs and lower lows, but the decreasing slope of the wedge highlights a weakening bearish trend. With solid tradi
See all ideas
Summarizing what the indicators are suggesting.
Oscillators
Neutral
SellBuy
Strong sellStrong buy
Strong sellSellNeutralBuyStrong buy
Oscillators
Neutral
SellBuy
Strong sellStrong buy
Strong sellSellNeutralBuyStrong buy
Summary
Neutral
SellBuy
Strong sellStrong buy
Strong sellSellNeutralBuyStrong buy
Summary
Neutral
SellBuy
Strong sellStrong buy
Strong sellSellNeutralBuyStrong buy
Summary
Neutral
SellBuy
Strong sellStrong buy
Strong sellSellNeutralBuyStrong buy
Moving Averages
Neutral
SellBuy
Strong sellStrong buy
Strong sellSellNeutralBuyStrong buy
Moving Averages
Neutral
SellBuy
Strong sellStrong buy
Strong sellSellNeutralBuyStrong buy
Displays a symbol's price movements over previous years to identify recurring trends.
Frequently asked questions
The current price of RONIN / USDT (RON) is 0.04779 USDT — it has fallen −2.85% in the past 24 hours. Try placing this info into the context by checking out what coins are also gaining and losing at the moment and seeing RON price chart.
RONIN / USDT price has fallen by −13.46% over the last week, its month performance shows a −15.12% decrease, and as for the last year, RONIN / USDT has decreased by −91.36%. See more dynamics on RON price chart.
Keep track of coins' changes with our Crypto Coins Heatmap.
RONIN / USDT (RON) reached its highest price on Mar 13, 2024 — it amounted to 4.53600 USDT. Find more insights on the RON price chart.
See the list of crypto gainers and choose what best fits your strategy.
RONIN / USDT (RON) reached the lowest price of 0.02300 USDT on Oct 20, 2024. View more RONIN / USDT dynamics on the price chart.
See the list of crypto losers to find unexpected opportunities.
The safest choice when buying RON is to go to a well-known crypto exchange. Some of the popular names are Binance, Coinbase, Kraken. But you'll have to find a reliable broker and create an account first. You can trade RON right from TradingView charts — just choose a broker and connect to your account.
Crypto markets are famous for their volatility, so one should study all the available stats before adding crypto assets to their portfolio. Very often it's technical analysis that comes in handy. We prepared technical ratings for RONIN / USDT (RON): today its technical analysis shows the strong sell signal, and according to the 1 week rating RON shows the strong sell signal. And you'd better dig deeper and study 1 month rating too — it's strong sell. Find inspiration in RONIN / USDT trading ideas and keep track of what's moving crypto markets with our crypto news feed.
RONIN / USDT (RON) is just as reliable as any other crypto asset — this corner of the world market is highly volatile. Today, for instance, RONIN / USDT is estimated as 4.39% volatile. The only thing it means is that you must prepare and examine all available information before making a decision. And if you're not sure about RONIN / USDT, you can find more inspiration in our curated watchlists.
You can discuss RONIN / USDT (RON) with other users in our public chats, Minds or in the comments to Ideas.