ROSE at macro floor: base recovery toward $0.0069The Macro Picture 🗺️
ROSE unwound a long downtrend from the $0.012190 highs down to the $0.005239 macro floor and has stopped falling right on it. RSI is pressed near 40 and the selling has flattened — the shape of exhaustion, not continuation.
The Setup ⚙️
The Accumulation Zone 🟢
$0.005239–0.005583 is where the selling has dried up. The macro floor has held on retest, and this is the demand shelf a recovery would build from.
The Decision Point 🔴
$0.012190 (Local High) is the far structural gate. Before it, the $0.006917 measured-move target is the first objective — reclaiming it proves buyers are stepping back in.
The Roadmap 🛣️
Hold the $0.005239 floor → recover toward $0.006917 → then work higher. Invalidation is a clean daily close below $0.005239 — that voids the accumulation thesis.
This is a textbook DCA Accumulation Zone setup: scale in across the $0.005239–0.005583 band and let the base do the work.
More setups in profile.
#ROSE #Oasis #crypto #trading #TA #3Commas #DCA
In-depth trading ideas
$rose is heading north according to plan.I mentioned LSE:ROSE going to $0.006 almost three months ago. We went through the noise until the US and Iran finally signed the MOU yesterday (6/17/26). The Strait of Hormuz blockade has been lifted, and ships are moving again. The oil market is dropping, and the crypto market is rebounding.
Finally, my patience has paid off. The price target has been reached, and I’ve collected plenty of LSE:ROSE under $0.007. I initially bought at $0.011 in small amounts to test the waters, based on my monthly candlestick analysis.
I wouldn’t be surprised if Bitcoin slips toward $55k and drags altcoins lower in the short term. However, the truth is that CRYPTOCAP:BTC.D is dropping, which could be an early positive sign that altseason is beginning in the near future. There’s no 100% guarantee it will happen anytime soon, but I still believe it could start at any moment, no matter where we stand right now.
Based on the above, my chart analysis shows that LSE:ROSE has broken out of a falling wedge and recently retested it on the weekly chart. The candlestick patterns look very bullish to me. I’m now targeting $0.015 in the near term, and possibly $0.02 if the Clarity Act finally passes before or after September. In addition, I have cash on the side ready in case LSE:ROSE slips below $0.006.
ROSE:USDT THE ALT THAT CAN SUPRISE THE MOST... 3xDepending on last study trend Rose:USDT seems to enter new uptrend depending low time frame study, and in the same time, it seems also a trend holding token which can let finally tis ready seen. who knowns if this is the start of alt season, which rose can play as one of the first tokens out.
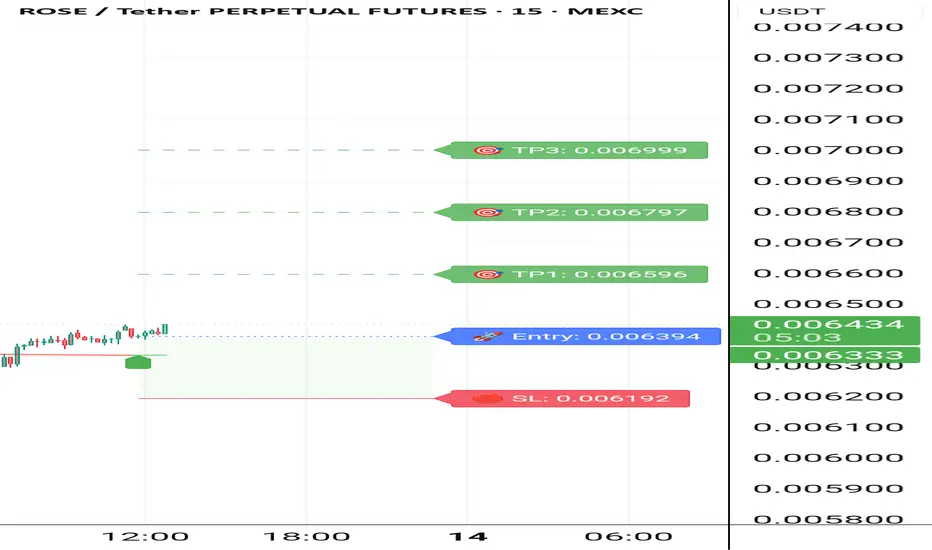
Roseusdt long Roddy01-SIGNALSPROVIDER Instructions:
Entry point: yellow
Stop loss: red
Take profit: green
👉Leverage x 5-10-20 for crypto
👉Leverage x 20-50-100 for commodities, stocks, indices, and forex
👉Margin 1-5% max.
Always practice risk and money management.
Invest a maximum of 5% on any trade or across all your trades.
Invest only what you can afford to lose, as no one is in control of the market.
👉Our analyses are primarily based on:
breakouts: two trend lines (ascending and descending) and a line indicating a horizontal breakout.
chart patterns: shoulders and head, triangle parttern, elliott impulse, etc etc.
We don't always have the time to track them at all times or to represent them visibly, given the numerous signals, the number of channels to manage, and especially because of the often rapid pace of market movements.
indicators: We associate at least two indicators with this technique.
👉Depending on the circumstances, we use specific indicators, often setting 3 or more take profit levels.
👉Indeed, there are good days in trading and also bad days. No one can promise to win every trade, and like all traders worldwide, we also experience stop-loss orders. However, we win more than we lose and remain positive.
👉You can close the position before or after the take profit orders indicated by the green lines if you are personally satisfied; the same applies to stop loss orders.
👉We must stay positive, clear-headed, and humble.
we cannot provide all instructions or all trades here on this channel.
Good luck to us all, and may God guide us. Amen.
$rose dead kitty anyone?not sure what happened to this bubba unless its just doing what the old coins are all prettu much doing
wonder how many even have a dead cat bounce
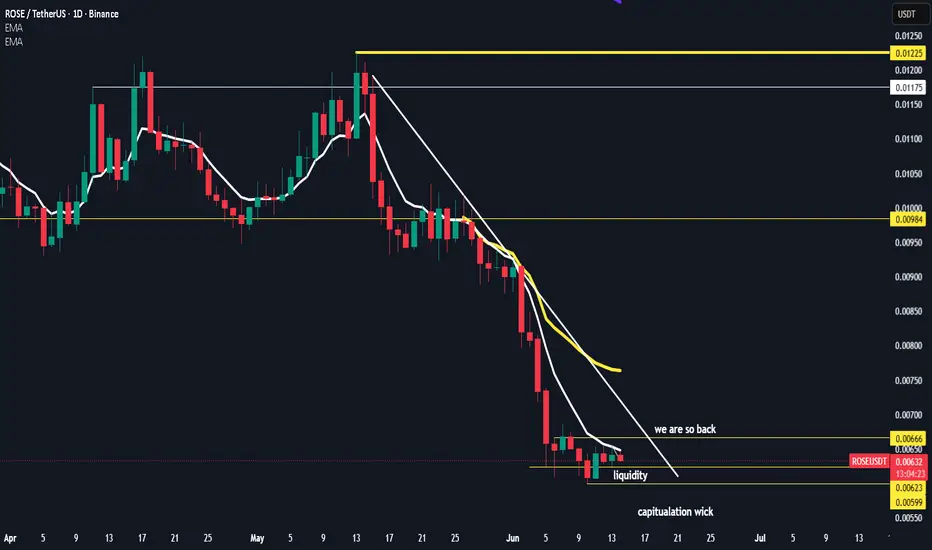
21 reaclaim and we attempt the 50 above . loose our local low and we capitulate pretty quick i mean surely rip off the bandage time
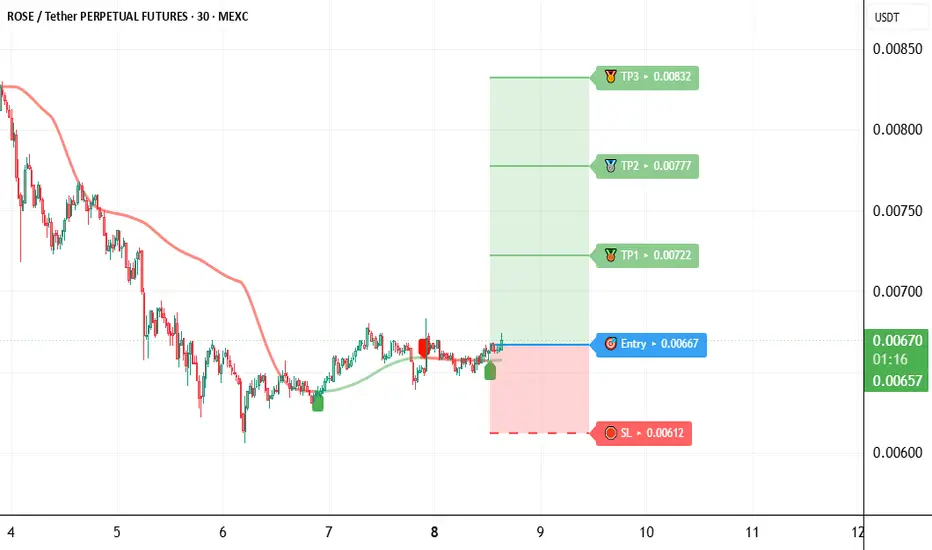
roseusdt long Roddy01-SIGNALSPROVIDERInstructions:
Entry point: yellow
Stop loss: red
Take profit: green
👉Leverage x 5-10-20 for crypto
👉Leverage x 20-50-100 for commodities, stocks, indices, and forex
👉Margin 1-5% max.
Always practice risk and money management.
Invest a maximum of 5% on any trade or across all your trades.
Invest only what you can afford to lose, as no one is in control of the market.
👉Our analyses are primarily based on:
breakouts: two trend lines (ascending and descending) and a line indicating a horizontal breakout.
chart patterns: shoulders and head, triangle parttern, elliott impulse, etc etc.
We don't always have the time to track them at all times or to represent them visibly, given the numerous signals, the number of channels to manage, and especially because of the often rapid pace of market movements.
indicators: We associate at least two indicators with this technique.
👉Depending on the circumstances, we use specific indicators, often setting 3 or more take profit levels.
👉Indeed, there are good days in trading and also bad days. No one can promise to win every trade, and like all traders worldwide, we also experience stop-loss orders. However, we win more than we lose and remain positive.
👉You can close the position before or after the take profit orders indicated by the green lines if you are personally satisfied; the same applies to stop loss orders.
👉We must stay positive, clear-headed, and humble.
we cannot provide all instructions or all trades here on this channel.
Good luck to us all, and may God guide us. Amen.
Roddy01-SignalProvider Instructions:
Entry point: yellow
Stop loss: red
Take profit: green
👉Leverage x 5-10-20 for crypto
👉Leverage x 20-50-100 for commodities, stocks, indices, and forex
👉Margin 1-5% max.
Always practice risk and money management.
Invest a maximum of 5% on any trade or across all your trades.
Invest only what you can afford to lose, as no one is in control of the market.
👉Our analyses are primarily based on:
breakouts: two trend lines (ascending and descending) and a line indicating a horizontal breakout.
chart patterns: shoulders and head, triangle parttern, elliott impulse, etc etc.
We don't always have the time to track them at all times or to represent them visibly, given the numerous signals, the number of channels to manage, and especially because of the often rapid pace of market movements.
indicators: We associate at least two indicators with this technique.
👉Depending on the circumstances, we use specific indicators, often setting 3 or more take profit levels.
👉Indeed, there are good days in trading and also bad days. No one can promise to win every trade, and like all traders worldwide, we also experience stop-loss orders. However, we win more than we lose and remain positive.
👉You can close the position before or after the take profit orders indicated by the green lines if you are personally satisfied; the same applies to stop loss orders.
👉We must stay positive, clear-headed, and humble.
we cannot provide all instructions or all trades here on this channel.
Good luck to us all, and may God guide us. Amen.
Roseusdt shortInstructions:
Entry point: yellow
Stop loss: red
Take profit: green
👉Leverage x 5-10-20 for crypto
👉Leverage x 20-50-100 for commodities, stocks, indices, and forex
👉Margin 1-5% max.
Always practice risk and money management.
Invest a maximum of 5% on any trade or across all your trades.
Invest only what you can afford to lose, as no one is in control of the market.
👉Our analyses are primarily based on:
breakouts: two trend lines (ascending and descending) and a line indicating a horizontal breakout.
chart patterns: shoulders and head, triangle parttern, elliott impulse, etc etc.
We don't always have the time to track them at all times or to represent them visibly, given the numerous signals, the number of channels to manage, and especially because of the often rapid pace of market movements.
indicators: We associate at least two indicators with this technique.
👉Depending on the circumstances, we use specific indicators, often setting 3 or more take profit levels.
👉Indeed, there are good days in trading and also bad days. No one can promise to win every trade, and like all traders worldwide, we also experience stop-loss orders. However, we win more than we lose and remain positive.
👉You can close the position before or after the take profit orders indicated by the green lines if you are personally satisfied; the same applies to stop loss orders.
👉We must stay positive, clear-headed, and humble.
we cannot provide all instructions or all trades here on this channel.
Good luck to us all, and may God guide us. Amen.
ROSE/USDT –ROSE ON WAY TO RUNNER📊 ROSE/USDT – Update
ROSE is showing early signs of recovery after holding key support and slowly rebuilding momentum from the recent bottom structure. The current setup suggests a potential continuation move if buyers maintain control and volume keeps increasing.
🎯 TP 1: 0.01113
🎯 TP 2: 0.01214
🚀 TP 3: Runner target open — allowing the trend to capture maximum upside potential.
👉 As long as price remains above support, the bullish scenario stays active.
This is our trading expectation and not financial advice everything depends on confirmed trend continuation.
roseusdt longInstructions:
Entry point: yellow
Stop loss: red
Take profit: green
👉Leverage x 5-10-20 for crypto
👉Leverage x 20-50-100 for commodities, stocks, indices, and forex
👉Margin 1-5% max.
Always practice risk and money management.
Invest a maximum of 5% on any trade or across all your trades.
Invest only what you can afford to lose, as no one is in control of the market.
👉Our analyses are primarily based on:
breakouts: two trend lines (ascending and descending) and a line indicating a horizontal breakout.
chart patterns: shoulders and head, triangle parttern, elliott impulse, etc etc.
We don't always have the time to track them at all times or to represent them visibly, given the numerous signals, the number of channels to manage, and especially because of the often rapid pace of market movements.
indicators: We associate at least two indicators with this technique.
👉Depending on the circumstances, we use specific indicators, often setting 3 or more take profit levels.
👉Indeed, there are good days in trading and also bad days. No one can promise to win every trade, and like all traders worldwide, we also experience stop-loss orders. However, we win more than we lose and remain positive.
👉You can close the position before or after the take profit orders indicated by the green lines if you are personally satisfied; the same applies to stop loss orders.
👉We must stay positive, clear-headed, and humble.
we cannot provide all instructions or all trades here on this channel.
Good luck to us all, and may God guide us. Amen.
roseusdt shortInstructions:
Entry point: yellow
Stop loss: red
Take profit: green
👉Leverage x 5-10-20 for crypto
👉Leverage x 20-50-100 for commodities, stocks, indices, and forex
👉Margin 1-5% max.
Always practice risk and money management.
Invest a maximum of 5% on any trade or across all your trades.
Invest only what you can afford to lose, as no one is in control of the market.
👉Our analyses are primarily based on:
breakouts: two trend lines (ascending and descending) and a line indicating a horizontal breakout.
chart patterns: shoulders and head, triangle parttern, elliott impulse, etc etc.
We don't always have the time to track them at all times or to represent them visibly, given the numerous signals, the number of channels to manage, and especially because of the often rapid pace of market movements.
indicators: We associate at least two indicators with this technique.
👉Depending on the circumstances, we use specific indicators, often setting 3 or more take profit levels.
👉Indeed, there are good days in trading and also bad days. No one can promise to win every trade, and like all traders worldwide, we also experience stop-loss orders. However, we win more than we lose and remain positive.
👉You can close the position before or after the take profit orders indicated by the green lines if you are personally satisfied; the same applies to stop loss orders.
👉We must stay positive, clear-headed, and humble.
we cannot provide all instructions or all trades here on this channel.
Good luck to us all, and may God guide us. Amen.
$rose is heading south according to plan.We failed to flip at $0.019 two months ago. Now, I see the price is going to continue dropping to around $0.006 due to heavy market noise such as war, oil prices, inflation, and recession fears, blah blah.
First, I need to watch the liquidation zone at $0.0098. If it fails, I’ll start a position lower for a buying opportunity.
I still believe LSE:ROSE is a great project, and I personally think it can hit $0.045 in Q3 or so.
Please do your own research. This is not financial advice. Sharing my ideas doesn’t guarantee where the price will go.
ROSEUSDT UPDATELSE:ROSE Technical Setup Pattern: Falling Wedge Breakout Current Price: $0.01100 Target Price: $0.0170, $0.0180 Target % Gain: 70.99% ROSE is breaking out of a falling wedge on the 1D timeframe with price bouncing from support and pushing above the descending resistance, indicating a potential bullish reversal as momentum starts to build Time Frame: 1D
Oasis Network—ROSE · Astrology, Subtle Signals & Bullish CryptoI think it is different now. Can you perceive change? A change in the atmosphere, the space around us. Change in the behavior of the people and the market. A change in the mentality, the thinking, the consciousness.
I think people are more active now, more dynamic, more alive. There is more activity. More activity will manifest. From introspection to outward expression. It is the time to take action.
It is not only the fact that Bitcoin trades above $70,000 and the bears lost. No. It is a change within us. It comes from outside, the stimulation, the impulse, but we change inside. Like winter turning into spring. Like changing from Mars being in Pisces to entering Aries. That's action, but it all starts today.
Remember, all the planets are now forward—all of them—and this reality will be easily felt all across the market. Everything moves forward.
When five of the main planets turned retrograde last year, the bull market ended and we saw the development of a bearish phase. It is happening in reverse; we see the end of the bearish cycle and at the same time, all the planets ended their retrograde cycle, interesting.
Mars is the planet of action and it moved today. Immediately I saw changes in how the altcoins behave. And also the people across the market. That giddy energy, that impulse that pushes you to move. It is only starting now, Mars, but the rest has been going for weeks or more.
It is already here. We do not take this signal in isolation and much is open to interpretation. We couple this with the chart, the subtle signals, that being the qualitative aspects of the market, geopolitics, also the DXY, even Gold and the SPX. We can consider all these things combined to make a perfect picture, one that reveals without a shadow of doubt what comes next.
Oasis Network (ROSEUSDT) is trading at bottom prices with all the usual suspects: MACD, RSI, double-bottom, volume, etc.
The chart will easily reveal the direction and resistance zones. Only astrology can help you predict dates. When will the bullish wave end for the big projects? When is the market likely to reverse? When will things speed up or slow down? Another great tool to have.
Thank you for reading.
Namaste.
RLong
ROSE/USDT Time To Buy !**ROSE/USDT – Simple Method, Clear Opportunity**
This analysis uses a very simple method. No complicated indicators, just observing price structure and identifying areas where the market shows potential interest.
Sometimes, the simplest approach works surprisingly well. By focusing on clear price behavior instead of overloading the chart with tools, it becomes easier to spot opportunities.
At the moment, **ROSE/USDT is approaching a zone that presents a potential buy opportunity**, as long as the current structure remains intact.
Simple methods do not mean weak methods. In many cases, a clean and disciplined approach can perform very effectively.
**Disclaimer:**
This analysis reflects personal opinions and is not financial advice. Cryptocurrency markets are highly volatile and involve significant risk. Always do your own research (DYOR) and practice proper risk management before making any trading decisions.
$ROSE Testing Supply Zone — Rejection Setup Forming?
ROSE is currently trading around the $0.0127 region after bouncing from recent lows. However, the higher timeframe structure still shows a broader downtrend with price forming lower highs since the previous rally peak.
On the 4H chart, price is now approaching a resistance area around the $0.0130–$0.0140 region where previous selling pressure appeared. Liquidity is building above this range, which means the market could sweep this zone before rejecting and rotating back toward the value area near $0.0121.
RSI has recovered during the bounce and is now approaching the upper range on lower timeframes. When momentum rises into resistance during a bearish structure, it often leads to a rejection move. If sellers defend the $0.0130 zone, ROSE could move back toward the $0.0120–$0.0110 support area. 🔥💸
ROSE looks ready to explode to the upside (4H)It appears that ROSE is consolidating around a key level and is currently trading within this important zone.
A Diametric pattern also seems to be forming and nearing completion, and we may soon see the completion of wave F
From the current price, or after a pullback to the green zone the price could move upward toward the targets shown on the chart, which are marked with white and yellow lines
In this volatile market, it is better to move your position to breakeven at the first target
A daily candle closing below the invalidation level would invalidate this analysis.
If you have a coin or altcoin you want analyzed, first hit the like button and then comment its name so I can review it for you.
Do you also think ROSE is bullish?
Roseusdt trading ideaROSEUSDT continues to respect the prevailing bearish structure, maintaining its downward trajectory as price remains under sustained selling pressure. The primary supply zone overhead is acting as a firm resistance area, making it a key region to monitor for potential short setups if price revisits the zone. As long as price remains below this supply region, the broader downside bias remains intact.
On the lower side, the demand zone highlighted on the chart could provide a potential accumulation area if price reaches that level, where buyers may attempt to stabilize the market. For now, the structure favors short opportunities at supply, while demand below remains the area of interest for accumulation, as illustrated on the chart.
ROSEUSDT Key Inflection Zone Amidst WXY Corrective StructureROSEUSDT is currently exhibiting a broad bearish corrective structure, taking the form of a potential WXY complex correction. Price action has been coiling within a structurally significant range, with the immediate demand zone acting as the current base of accumulation. This area presents a favorable risk-reward opportunity for strategic long positions.
The broader outlook hinges on the behavior of price upon retesting the overhanging supply zone. A rejection at this critical resistance could trigger a sharp bearish continuation, with downside targets aligned with the projected bear zone, as depicted on the chart.
Conversely, a confirmed breakout above this structural ceiling would invalidate the bearish thesis and pave the way for an impulsive bullish leg toward the upper bull target area, establishing a potential trend reversal.
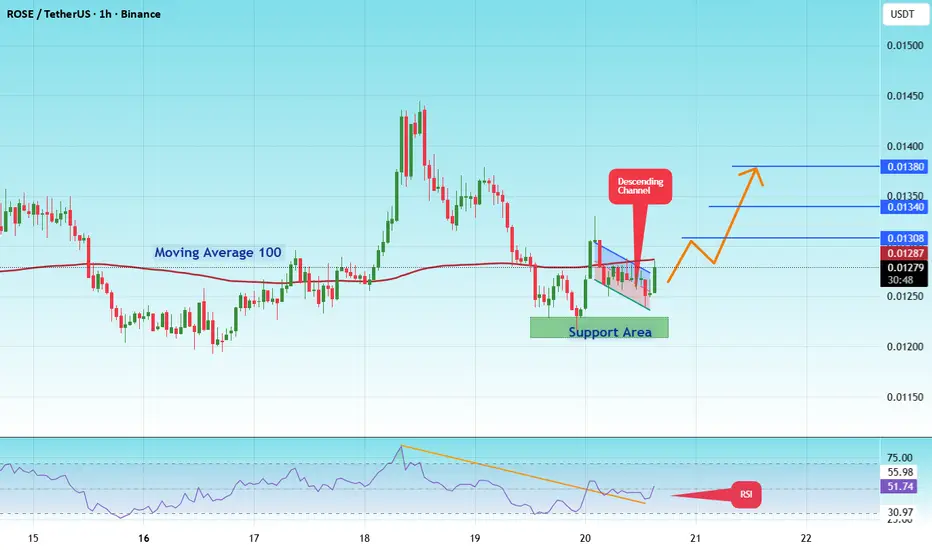
#ROSE/USDT Ready to go higher#ROSE
The price is moving within a descending channel on the hourly timeframe. It has reached the lower boundary and is heading towards breaking it. A retest of this boundary is expected.
The Relative Strength Index (RSI) is showing a downward trend, moving in a downtrend and likely to continue due to overbought conditions.
There is a key resistance zone in green at 0.01220. The price has bounced off this zone several times, making it a strong support level.
A consolidation trend is observed above the 100-period moving average, which we are approaching. This trend supports a decline towards this level.
Entry Price: 0.01282
Target 1: 0.01300
Target 2: 0.01340
Target 3: 0.01380
Stop Loss: At the resistance zone in green.
Don't forget one simple thing: Money Management.
For any questions, please leave a comment.
Thank you.
$rose19 sats on btc pair just a tad above the 7 ema on the weekly so assuming we close above this week
this should move up as well
thick yellow line above our hurlde for 1775 and above
scaling in and out is a 3$@#$@ with rose so careful of slippage
dominance closed below the 7 ema on the daily and well below on the weekly with the rsi just about ready to go down . for now slight up and we see at NY what happens
all the best !