Rocket Pool (RPL) —A New Market Cycle is UnderwayWe start with a two years long downtrend reaching its end. Here we cannot say that Rocket Pool is likely to produce a small jump, an inverted correction, weak bullish action, etc. It is 100% clear that a new bullish cycle is starting now for this project, an uptrend.
In February RPLUSDT printed one of the biggest candle in all of its history coupled with the highest volume ever.
Resistance has been challenged and the market is now sideways with no new lows.
"Rocket Pool is a decentralized ETH liquid staking derivative provider. Rocket Pool pairs smart node operators with stakers to pool ETH for staking, then returns rETH to stakers for maintaining liquidity and control of their staked tokens. RPL is the utility and governance token, it is required for becoming a node operator."
This is a very nice project. This adds to our list of no longer bearish, downtrend no-more, the start of a bullish cycle confirmed. One by one, we are getting there. The bullish case strengthens day by day.
Thank you for reading.
The best is yet to come!
Namaste.
In-depth trading ideas
#RPL About to End Its Downtrend? H&S Pattern Signals Reversal
Yello Paradisers! Are you really going to ignore #RPL, a potential multi-month reversal setup, just because the market has been quiet lately?
💎#RPLUSDT is forming a classic inverse head and shoulders pattern on the 3-month timeframe, and this is important. Higher timeframes mean stronger signals, and this is not just random noise; it is a structure that often marks the end of a downtrend and the beginning of a new bullish phase.
💎After a long period of decline, the first major shift already happened. Price broke above its descending resistance trendline with a strong bullish candle and noticeable volume. This is the kind of move that tells us sellers are losing control and buyers are slowly stepping in.
💎Even more interesting is what happened before that breakout. The market formed a divergence between the left shoulder and the head, meaning price was making lower lows, but momentum was getting weaker. In simple terms, sellers were pushing the price down, but with less and less strength. This is often one of the earliest signs that a trend is about to reverse.
💎Now we are seeing the right shoulder forming, and it is respecting almost the exact same support level as the left shoulder. This kind of symmetry is not a coincidence. It shows that the market is building a structured base, which increases the probability of a valid reversal pattern forming.
💎But here is where most traders make mistakes; they jump in too early. This pattern is still not confirmed. It only becomes valid once the price clearly breaks and holds above the neckline. Until then, this is just a high-probability setup, not a guaranteed move.
💎If price approaches the neckline and starts forming tighter consolidations, also known as a volatility contraction, it would be an even stronger sign. That kind of behavior usually leads to explosive breakouts and offers much better risk-to-reward opportunities for patient traders.
💎From a key level perspective, the area around $1.75 is acting as the immediate support, as it represents the right shoulder low. Below that, the $1.37 zone is the major support where the head was formed. On the upside, the first challenge for price will be around $4, and if momentum continues, the next major level to watch is around $5.75.
💎Right now, this is a transition phase. The market is moving from a downtrend into a potential accumulation and then expansion—but only if confirmation comes. The opportunity here is not about being first; it is about being right.
Paradisers, strive for consistency and not just quick profits. Treat the market as a businessman, not as a gambler.
MyCryptoParadise
iFeel the success🌴
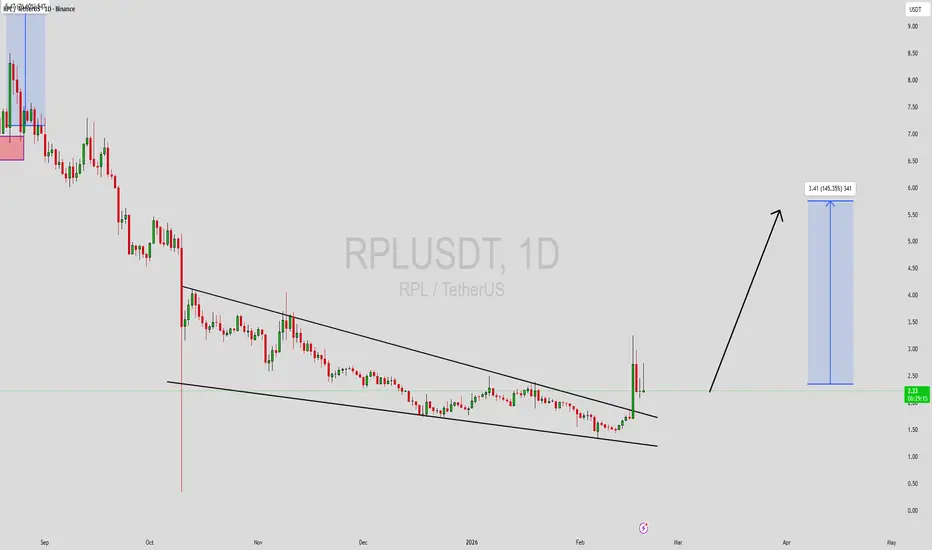
#RPL is currently trading within a falling wedge pattern #RPL is currently trading within a falling wedge pattern , suggesting a potential bullish reversal. The wedge formation indicates decreasing volatility and the potential for a breakout. If #RPL breaks out of the wedge, the next target is around 2.065 .
#RPL Patience #crypto #trading #altcoins
RPLUSDT Forming Descending ChannelRPLUSDT is forming a clear descending channel pattern, a classic bullish reversal signal that often indicates an upcoming breakout. The price has been consolidating within a narrowing range, suggesting that selling pressure is weakening while buyers are beginning to regain control. With consistent volume confirming accumulation at lower levels, the setup hints at a potential bullish breakout soon. The projected move could lead to an impressive gain of around 90% to 100% once the price breaks above the channel resistance.
This descending channel pattern is typically seen at the end of downtrends or corrective phases, and it represents a potential shift in market sentiment from bearish to bullish. Traders closely watching RPLUSDT are noting the strengthening momentum as it nears a breakout zone. The good trading volume adds confidence to this pattern, showing that market participants are positioning early in anticipation of a reversal.
Investors’ growing interest in RPLUSDT reflects rising confidence in the project’s long-term fundamentals and current technical strength. If the breakout confirms with sustained volume, this could mark the start of a fresh bullish leg. Traders might find this a valuable setup for medium-term gains, especially as the channel pattern completes and buying momentum accelerates.
✅ Show your support by hitting the like button and
✅ Leaving a comment below! (What is your opinion about this Coin?)
Your feedback and engagement keep me inspired to share more insightful market analysis with you!
Rocket Pool —New market cycle & long-term bull market starts nowWe start with a two years long downtrend reaching its end. Here we cannot say that Rocket Pool is likely to produce a small jump, an inverted correction, weak bullish action, etc. It is 100% clear that a new bullish cycle is starting now for this project, an uptrend.
This week is only halfway through and RPLUSDT has one of the biggest candle in all of its history coupled with the highest volume ever.
Three months of bearish action have been nullified in a single week. All the losses in the past three months have been recovered in a matter of days. This is how easy, how fast and how sudden everything can change. And this is only the start.
"Rocket Pool is a decentralized ETH liquid staking derivative provider. Rocket Pool pairs smart node operators with stakers to pool ETH for staking, then returns rETH to stakers for maintaining liquidity and control of their staked tokens. RPL is the utility and governance token, it is required for becoming a node operator."
This is a very nice project. This adds to our list of no longer bearish, downtrend no-more, the start of a bullish cycle—confirmed. One by one, we are getting there. The bullish case strengthens day by day.
Thank you for reading.
The best is yet to come!
Namaste.
RPL/USDT Enters Prime Buy Zone: Accumulation Before Next Leg Up?Firstly, our Algo-based indicators are used to create this analysis. Please Follow, Boost and leave your comments if you profited with our posts, so we may continue:
This 4-hour chart for RPL/USDT highlights a key support area that could serve as a launchpad for the next bullish impulse.
Analysis:
Corrective Pullback: After a strong rally that peaked near $8.72, the price has entered a corrective phase, pulling back to a significant area of interest.
The "BUY ZONE": A critical support zone has been identified between $6.48 and $6.80. This area represents a confluence of technical support:
Horizontal Structure: It aligns with a previous support/resistance level, where price has reacted multiple times.
Moving Averages: The price is currently testing the EMA 200 and is hovering just above the longer-term EMA 800, both of which often act as dynamic support during uptrends.
Indicator Confirmation: The custom indicator at the bottom of the chart shows the price has dipped into the oversold "BUY" territory, and a fresh "B" (Buy) signal has just appeared. This suggests that selling pressure is exhausting and buyers are beginning to step in.
Price Projection: The drawn black line illustrates a potential scenario where the price consolidates and accumulates within the "BUY ZONE." This period of sideways action would build a base before a strong continuation of the primary uptrend, targeting a retest and potential break of the recent high at $8.72.
Strategy:
Idea: Look for buying opportunities within the defined support zone.
Entry: The area between $6.48 and $6.80 is the designated "BUY ZONE." Traders might look for signs of consolidation or bullish price action within this range to initiate long positions.
Target: The initial target would be the recent high of $8.72.
Conclusion:
The current price action presents a classic dip-buying opportunity. The confluence of structural support, key moving averages, and a bullish indicator signal in the "BUY ZONE" suggests a high probability of a bullish reversal. Accumulation in this zone could fuel the next significant move upwards for RPL.
Disclaimer: This analysis is for educational purposes only and should not be considered financial advice. Always conduct your own research and manage risk appropriately.
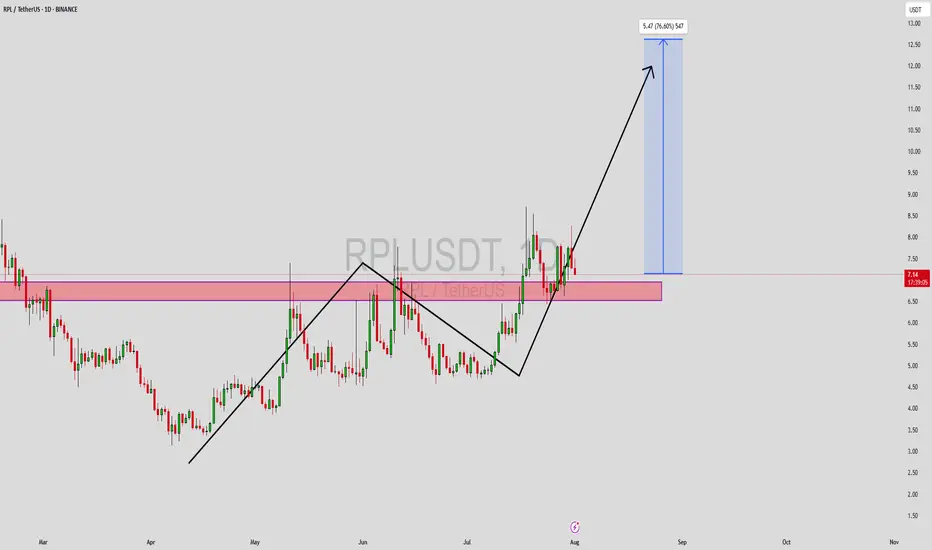
RPLUSDT Forming Strong Bullish StructureRPLUSDT is currently showing a strong bullish structure, with price action reclaiming a key support zone after a temporary retracement. The chart reveals a textbook market cycle with higher highs and higher lows, indicating a possible continuation of the uptrend. The current price level is sitting just above a key demand zone, previously tested and confirmed as strong support. This confluence area may act as a springboard for a potential move toward the 60% to 70% target gain zone, aligning with broader bullish sentiment seen across mid-cap altcoins.
Volume indicators are supportive of this move, suggesting that accumulation is underway. Increased investor interest in RPL is likely tied to its integral role in Ethereum’s liquid staking ecosystem, as Rocket Pool continues to gain adoption. With ETH staking steadily growing, projects like RPL tend to benefit from fundamental tailwinds. This kind of sector strength combined with favorable technicals gives the current setup more credibility and potential for follow-through.
The technical projection suggests that if momentum holds and buyers maintain control above the support range around $6.70–$7.00, then the next leg could push RPLUSDT beyond $12.00. That represents a 70%+ move from current levels, which aligns with the Fibonacci extension and measured move projections derived from previous breakout zones. Traders should keep a close eye on volume confirmation and potential breakout candles above minor resistance near $7.50.
This setup offers a well-defined risk-to-reward ratio for swing traders and position holders alike. With the current crypto market regaining traction, RPL is positioned as a high-potential candidate for strong upside if broader conditions remain favorable.
✅ Show your support by hitting the like button and
✅ Leaving a comment below! (What is You opinion about this Coin)
Your feedback and engagement keep me inspired to share more insightful market analysis with you!
RPL/USDThas spent over 100 days in consolidation, and is now beginning to break through major resistance levels, signaling a structural shift in momentum. Price is currently forming a new base support above the breakout zone, indicating strong buyer interest and commitment to higher prices.
This behavior reflects a classic breakout-retest pattern, where bulls defend newly claimed levels, aiming to build a bullish continuation structure. With market strength aligning, RPL looks poised for a sustained upcoming rally.
RPLUSDT 1D#RPL is currently sitting on a key support zone, which is further strengthened by the daily EMA200. If the daily candle closes above this zone, we expect the bullish momentum to continue. In that case, the potential upside targets are:
🎯 $8.64
🎯 $10.35
🎯 $12.05
🎯 $14.47
🎯 $17.55
However, if BTC drops further and BTC dominance rises, causing RPL to lose this support zone, we’ll place another buy ladder near the $5.93 support level to average down the entry.
⚠️ As always, use a tight stop-loss and apply proper risk management.
RPL | Waiting to Reclaim PivotRPL appears to be at a critical juncture on the weekly timeframe, having recently broken below its long-term descending trendline. The price is currently consolidating near the pivot level, which represents a key technical inflection point.
Current Setup:
Price trading below descending trendline resistance
RSI showing oversold conditions with potential for bounce
Critical pivot level at acting as immediate resistance
Bullish Scenario:
Reclaim of the pivot could trigger the projected upward path
Target the resistance zone around $28-32 (marked in red)
A break above the descending trendline would confirm trend reversal
Risk Factors:
Failure to reclaim pivot could lead to further downside
Overall crypto market sentiment remains a key factor
The setup suggests RPL is waiting for a decisive move above the pivot to initiate the bullish trajectory outlined in the chart projection.
$RPL 4H AnalysisGETTEX:RPL 4H Analysis 🔥
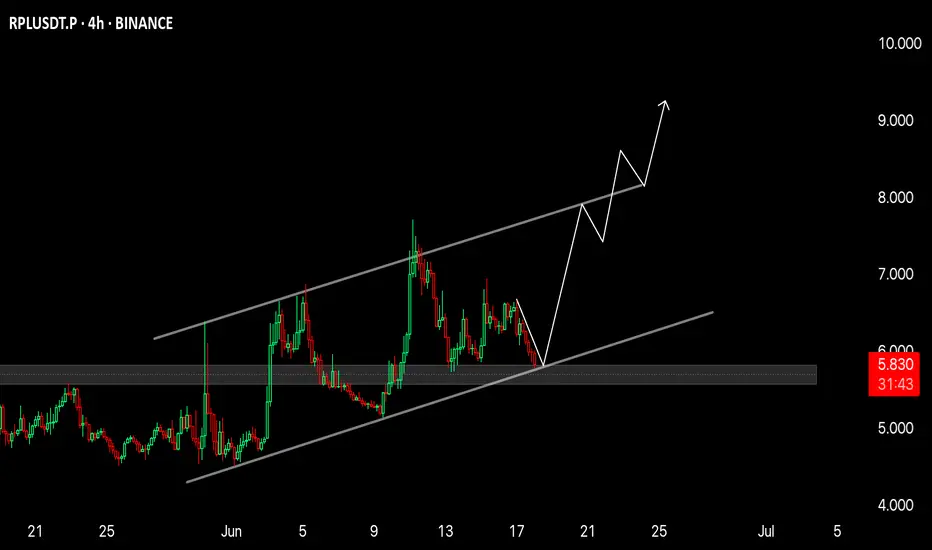
RPL is currently trading at the lower boundary of a parallel ascending channel, which has acted as strong support multiple times in the past. The price action shows a clear higher high, higher low structure, indicating an ongoing uptrend.
Currently, the price is hovering around the key horizontal demand zone ($5.5–$5.8). This level has previously acted as a launchpad for aggressive bullish moves, and we are seeing early signs of accumulation again.
Bullish Scenario:
If the support holds, RPL is likely to retest the midline of the channel around $7, followed by a potential breakout toward the upper trendline near $9 – $9.5.
The risk/reward setup here is highly favorable for swing traders.
What to watch:
Hold above $5.5 = bullish continuation likely 🚀
Break below $5.5 = invalidation of structure ⚠️
📈 Conclusion:
Structure remains bullish. This is a textbook channel bounce setup with targets of $7 → $8.5 → $9.5 if momentum kicks in. Volume confirmation will be key.
#RPL #RocketPool #CryptoTrading #Altcoins #BreakoutSetup #TechnicalAnalysis
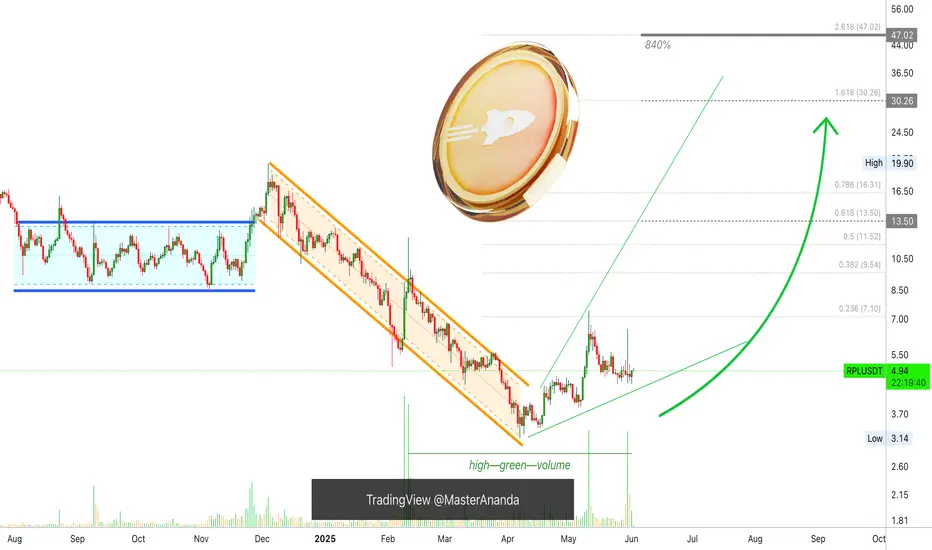
840% Rocket Pool—500% Potential Profits @$30 Conservative TargetI found a good chart setup. Rocket Pool peaked its initial bullish breakout 11-May and has been sideways for the past few weeks. The chart is showing that the retrace is over/complete.
The initial breakout, between 7-April and 11-May, produced a total of ~135% growth. This happened in a little over a month.
The retrace ended as a clear-classic higher low and trading volume has been very high leaning towards the bullish side. This is a strong giveaway signal.
Market conditions are bullish for this pair. A continuation can happen anytime.
One thing though, there can be lower prices. Say a little more retrace and drop above the 6-May low at $3.85. There can be another drop if there isn't enough momentum to move higher and the higher low ends at $3.90. This is something that we have to wait and see. Both scenarios are high probability; straight up next week, or more consolidation before additional growth. Both scenarios are bullish on all timeframes. Regardless of the short-term, Rocket Pool (RPLUSDT) is set to grow.
A very nice target here goes for 840%. This is a strong target but also easy to achieve later this year. Another target, strong but more conservative, is found around $30 for a 500% potential profits.
Thank you for reading.
Namaste.
$RPLUSDT broken out BINANCE:RPLUSDT has broken out! 🚀
Clean breakout from descending trendline triangle with volume.
Targeting $17.72 (+263%).
Retest zone: $4.60–$5.00
Momentum looks strong, don’t sleep on this move!
DYRO, NFA
RLong
Backtesting RPL Signal on Spot Trading by Rainbow MG3🔹 RPL is one of the signals generated from a TradingView watchlist, which sends alerts to Telegram.
🔹 After receiving the alerts, I used historical data to validate the indicator’s performance.
📈 Backtest Setup
✅ Pair: RPLUSDT (Spot)
✅ Timeframe 1: M15 (Entry)
✅ Timeframe 2: D1
RPL/USDTKey Level Zone: 10.66 - 10.73
HMT v4.1 detected. The setup looks promising, supported by a previous upward/downward trend with increasing volume and momentum, presenting an excellent reward-to-risk opportunity.
HMT (High Momentum Trending):
HMT is based on trend, momentum, volume, and market structure across multiple timeframes. It highlights setups with strong potential for upward movement and higher rewards.
Whenever I spot a signal for my own trading, I’ll share it. Please note that conducting a comprehensive analysis on a single timeframe chart can be quite challenging and sometimes confusing. I appreciate your understanding of the effort involved.
Important Note :
Role of Key Levels:
- These zones are critical for analyzing price trends. If the key level zone holds, the price may continue trending in the expected direction. However, momentum may increase or decrease based on subsequent patterns.
- Breakouts: If the key level zone breaks, it signals a stop-out. For reversal traders, this presents an opportunity to consider switching direction, as the price often retests these zones, which may act as strong support-turned-resistance (or vice versa).
My Trading Rules
Risk Management
- Maximum risk per trade: 2.5%.
- Leverage: 5x.
Exit Strategy
Profit-Taking:
- Sell at least 70% on the 3rd wave up (LTF Wave 5).
- Typically, sell 50% during a high-volume spike.
- Adjust stop-loss to breakeven once the trade achieves a 1.5:1 reward-to-risk ratio.
- If the market shows signs of losing momentum or divergence, ill will exit at breakeven.
The market is highly dynamic and constantly changing. HMT signals and target profit (TP) levels are based on the current price and movement, but market conditions can shift instantly, so it is crucial to remain adaptable and follow the market's movement.
If you find this signal/analysis meaningful, kindly like and share it.
Thank you for your support~
Sharing this with love!
HMT v2.0:
- Major update to the Momentum indicator
- Reduced false signals from inaccurate momentum detection
- New screener with improved accuracy and fewer signals
HMT v3.0:
- Added liquidity factor to enhance trend continuation
- Improved potential for momentum-based plays
- Increased winning probability by reducing entries during peaks
HMT v3.1:
- Enhanced entry confirmation for improved reward-to-risk ratios
HMT v4.0:
- Incorporated buying and selling pressure in lower timeframes to enhance the probability of trending moves while optimizing entry timing and scaling
HMT v4.1:
- Enhanced take-profit (TP) target by incorporating market structure analysis
#RPL UPDATE 🌟#RPL Update 🌟
🛫 What an incredible journey it's been! 🛫
#RPL is on the verge of an exciting breakthrough! With strong support around $11.5 and an ambitious target of $19, we're witnessing impressive volume in this week's candle. If #RPL s to break above $19, we could be gearing up for a powerful surge toward the $30 mark! 🚀
Remember, the trend is closely linked to #BTC 's positive momentum, so keep an eye on those candlestick patterns and market fluctuations. CRYPTOCAP:BTC 's moves will have a direct impact on GETTEX:RPL 's performance! Stay tuned for more updates! 📈✨ #SRFXGlobal