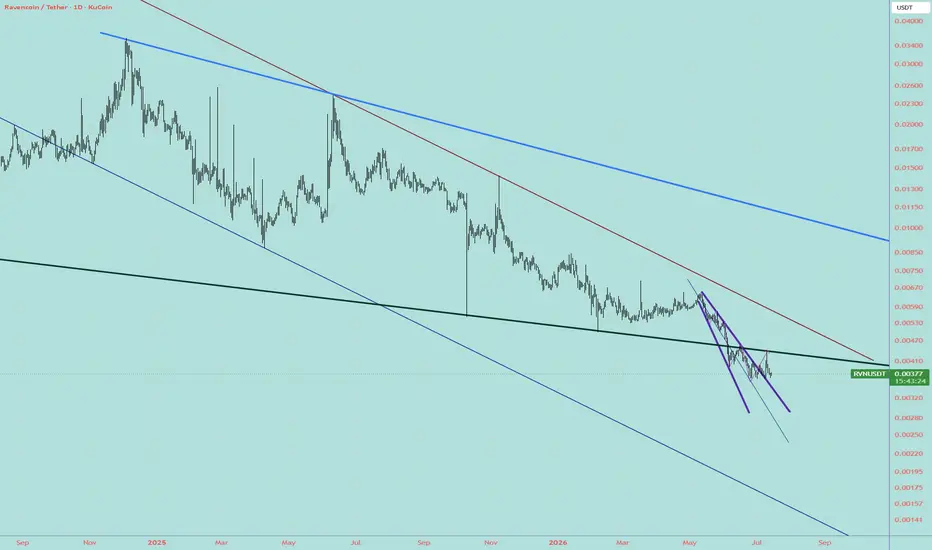
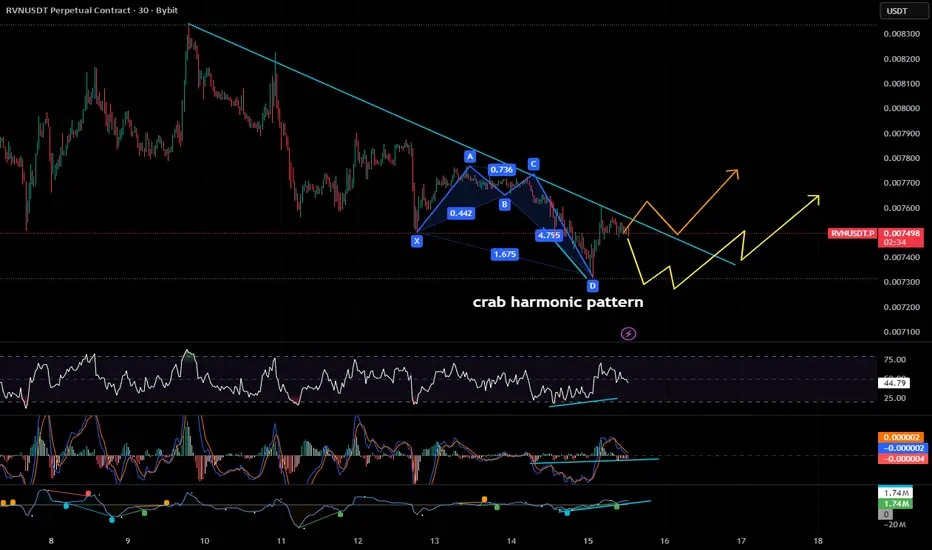
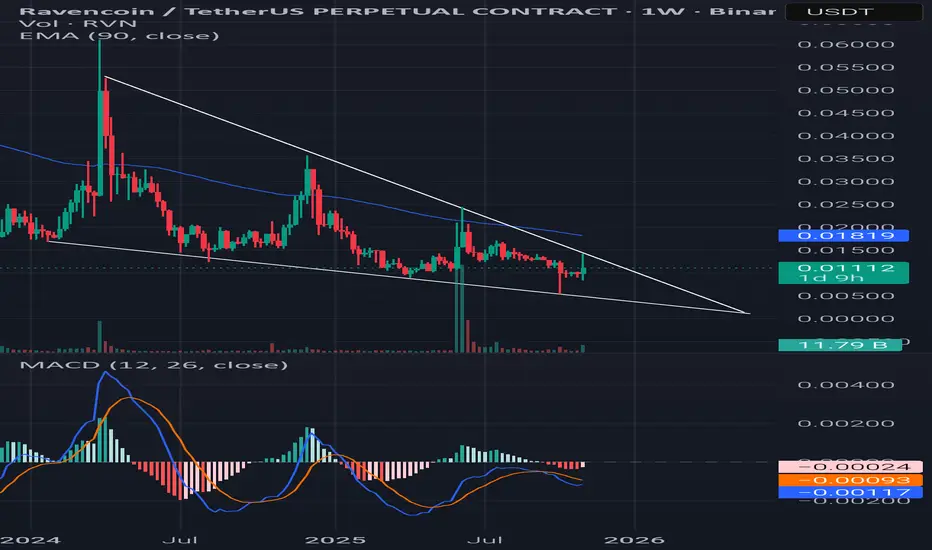
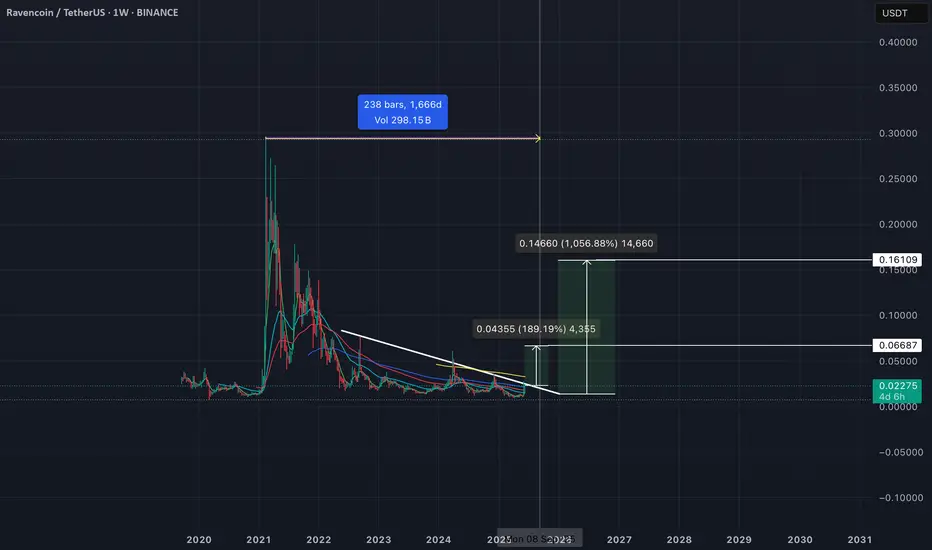
Ravencoin | Potential Bullish ReversalRVN is forming a falling wedge pattern, which could signal a potential bullish reversal. Looking for a daily close above the upper trendline, followed by a successful retest.
🎯 Potential targets: $0.001500 → $0.001900 → $0.002400–$0.003000
Watching closely for a potential breakout.
📚 Educational: Falling wedges often develop as selling pressure weakens, potentially setting the stage for a bullish reversal.
⚠️ Always manage risk accordingly.
Ravencoin / TetherUS
No trades
No trades
In-depth trading ideas
RVN/USDT: +250% Macro Expansion SetupRavencoin ( CRYPTOCAP:RVN ) is displaying macro accumulation characteristics as price compresses near the **$0.012 – $0.014** primary demand zone. With sell-side volume waning across higher timeframes and market structure reflecting steady bottom-level absorption, the pair is preparing for a high-volatility expansion. A confirmed daily/H4 push above the primary pivot level clears overhead resistance for a multi-leg short squeeze toward major macro supply nodes.
A sustained H4 close above the $0
Rave coin (RVN:USDT) ON WAY TO NEW HIGHDepending on last trend, RVN showing an interesting building volume, which are positive on the daily range, and exactly now RVN are at R line, on of the most import trend lines, which has high chance to increase further, we will follow in the coming time RVN:USDT.
RVNUSDT Forming Bullish MomentumRVNUSDT is forming a clear bullish momentum pattern, a classic bullish reversal signal that often indicates an upcoming breakout. The price has been consolidating within a narrowing range, suggesting that selling pressure is weakening while buyers are beginning to regain control. With consistent volume confirming accumulation at lower levels, the setup hints at a potential bullish breakout soon. The projected move could lead to an impressive gain of around 20% to 30% once the price breaks above
RVNUSDT Facing a Critical Bear Flag – Breakdown or Bull Trap?📊🔍 Technical Analysis
💰 Coin: CRYPTOCAP:RVN #RVNUSDT
⏳ Time Frame: 12H
📉 Pattern: Bear Flag 🐻🚩
RVNUSDT is currently trading within a Bear Flag, a bearish continuation pattern that forms after a strong impulsive decline (Flagpole), followed by a temporary consolidation inside a slightly ascending channel (Flag). 📊
At the moment, price remains inside the Bear Flag and has not yet managed to break above the upper resistance. As long as price continues trading within this structure, selling pre
R
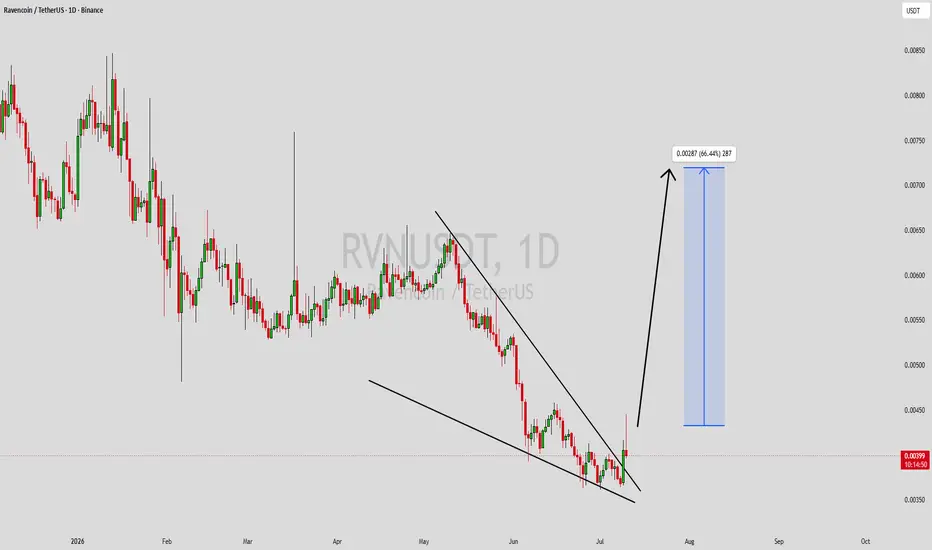
RVNUSDT Forming Falling WedgeRVNUSDT is forming a clear falling wedge pattern, a classic bullish wave signal that often indicates an upcoming breakout. The price has been consolidating within a narrowing range, suggesting that selling pressure is weakening while buyers are gradually regaining control. With consistent volume confirming accumulation at lower levels, the current setup hints at a potential bullish breakout in the near term. The projected move could lead to an impressive gain of around 50% to 60% once the price
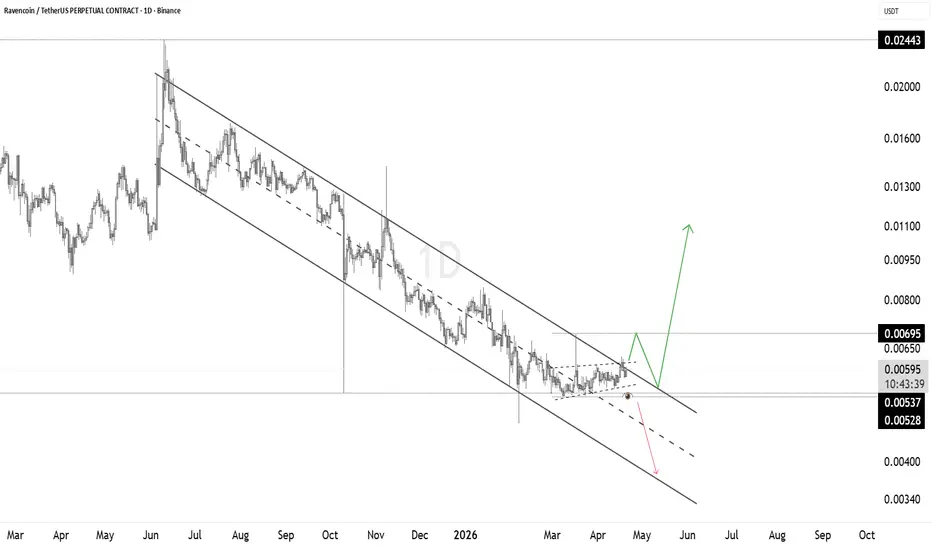
RVN Compression at Channel Resistance – Breakout or RejectionRVN is trading inside a long-term descending channel and is now compressing right below the upper trendline resistance.
This tightening structure shows pressure building, with price attempting to push higher but still respecting the overall bearish trend.
A clean breakout above the channel could trigger a strong upside move toward the 0.009–0.011 region and potentially higher.
However, failure here would likely lead to rejection and continuation toward the channel lows.
This is a key decisio
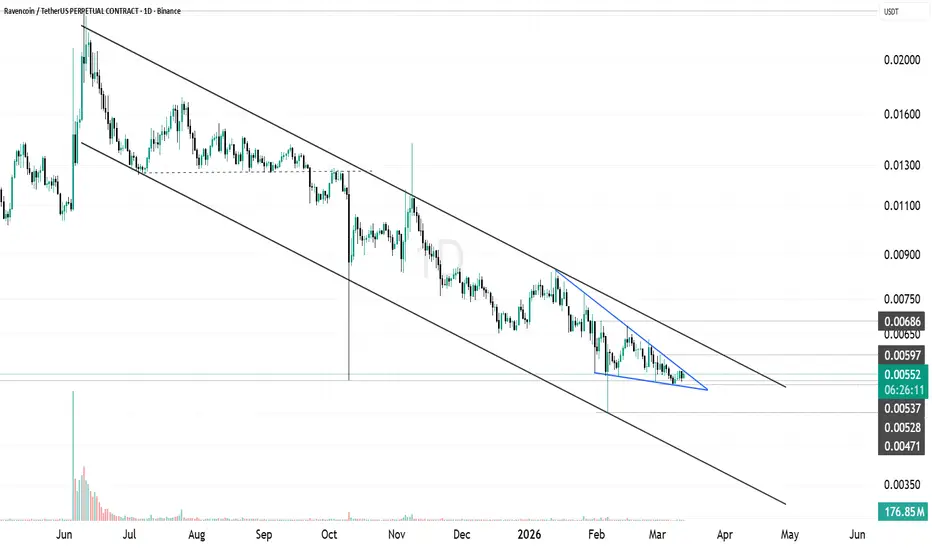
RVN Forming Triangle Structure Inside Major Descending Channel#RVN continues to trade inside a long-term descending channel, maintaining the broader bearish market structure with consistent lower highs and lower lows. Price has now reached the lower boundary of the channel, where selling pressure is starting to slow.
Within this area, the market is forming a small triangle pattern, indicating compression as volatility contracts near support. This structure suggests the market is preparing for a directional move while testing the lower edge of the broader
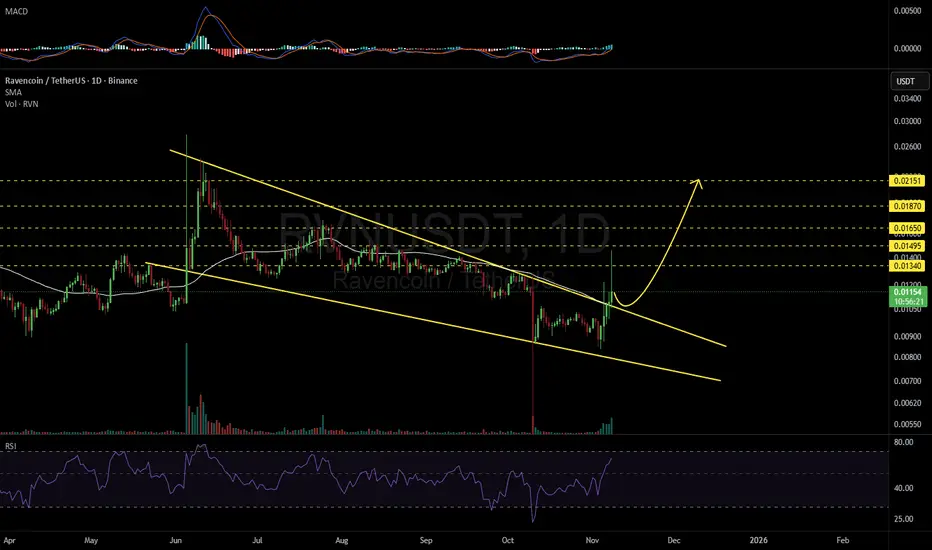
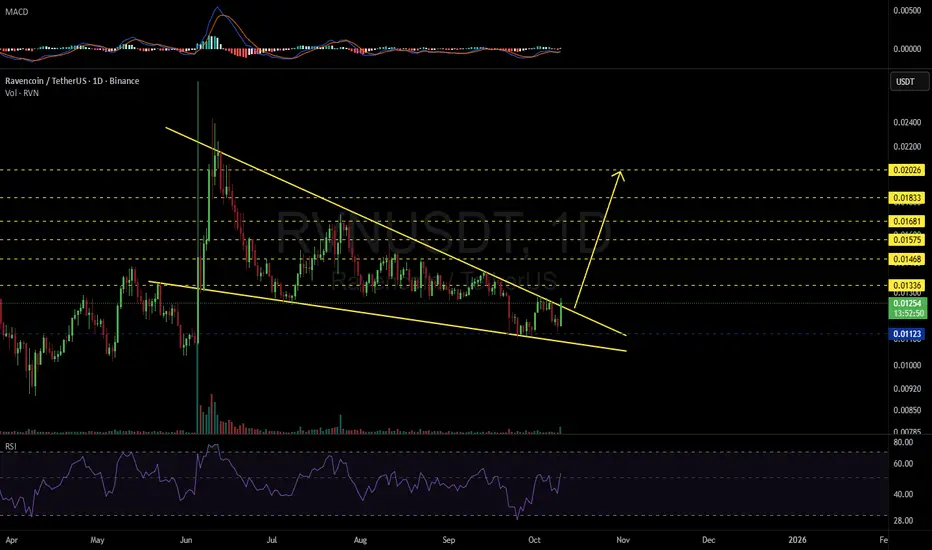
RVNUSDT 1D#RVN is trading within a falling wedge pattern on the daily chart. In case of a breakout above the wedge resistance, the potential targets are:
🎯 $0.01336
🎯 $0.01468
🎯 $0.01575
🎯 $0.01681
🎯 $0.01833
🎯 $0.02026
⚠️ Always remember to use a tight stop-loss and maintain proper risk management.
#RVN Ready for an Explosive Bullish Move | Must Watch For BullsYello Paradisers! #RVN just broke out of the descending channel exactly as we expected... but will it hold this time, or is this another fakeout? Let’s break down this #Ravencoin setup:
💎#RVNUSDT has been trading inside a well-respected falling wedge since July. After multiple rejections from the descending resistance, the price is about to break out and close above the structure. This move will also reclaim the 50EMA, which will act as support. If this EMA continues to hold, it will increase t
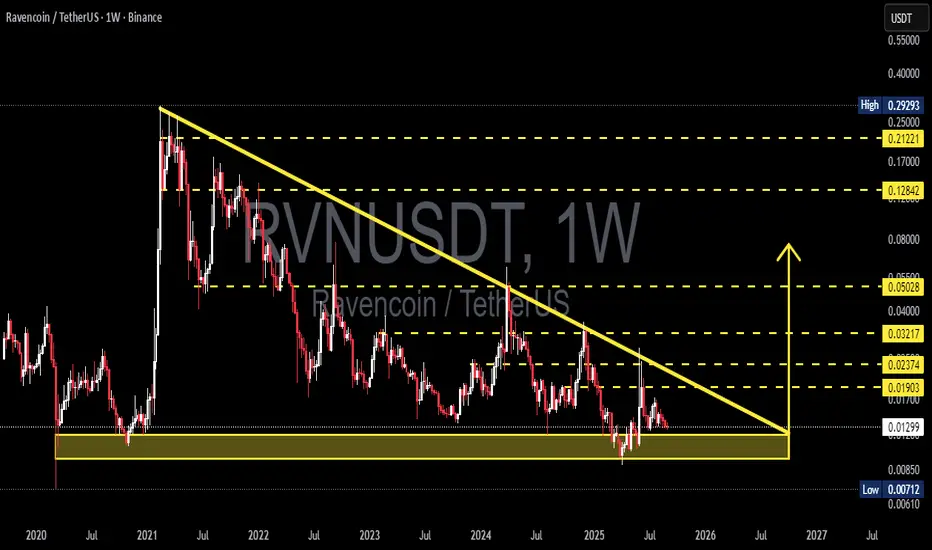
RVN/USDT — Descending Triangle: Breakout or Breakdown?Ravencoin (RVN) is now standing at one of its most critical levels since 2021. On the weekly chart, we clearly see a Descending Triangle pattern:
Lower Highs pressing the price down for years.
Strong demand zone around 0.00712 – 0.0130 USDT still holding as the last defense for buyers.
Price is now sitting right at the triangle’s apex, which means a major move is coming soon — either breakout or breakdown.
---
🔎 Technical Breakdown
Main pattern: Descending Triangle (statistically bearish,
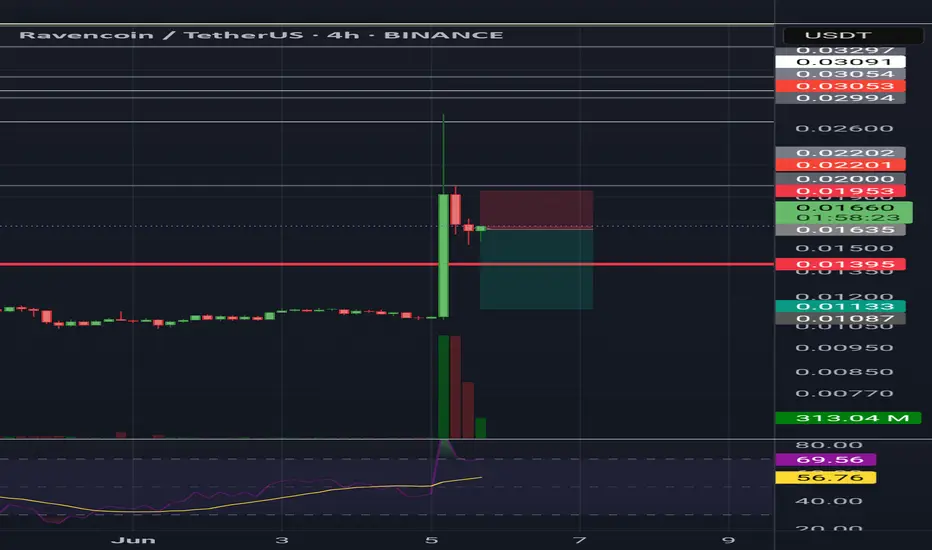
Ravencoin · Bullish Altcoins & Futures Trading Trade-NumbersRemember Ravencoin? At one point this project worked as a very strong signal and confirmation in support of our late 2025 altcoins market bull market thesis. The strong bullish jump and high volume in early June reveals a bottom, and a bottom reveals the end of a bearish period, and the end of a bearish period is followed by the inverse, a bullish cycle.
These pairs that move strongly in this way tend to perform strongly during the entire cycle. That is, RVNUSDT already produced a strong bullis
RLong
RVNUSDT Massive Breakout Loading? After 2 Years of Compression!
📈 Weekly Technical Analysis: Ravencoin (RVN/USDT)
🧠 Main Pattern: Descending Triangle ⚠️
Ravencoin has been consolidating within a Descending Triangle since early 2021 — typically a bearish continuation pattern, but one that can lead to a massive trend reversal if the upper boundary is broken.
🟨 Key Accumulation Zone:
📍 Support Area: $0.01280 – $0.01080
This zone has been tested multiple times and has shown strong buyer defense since 2022.
📏 Dynamic Resistance:
📍 Downward sloping trendline
Ravencoin Bullish Continuation, Altcoins Bull Market ConfirmedRavencoin produced a major bullish breakout, we've seen many of those. It happens that you get one of these breakouts but the following week bullish action is dead. That was all, end of story. This isn't the case here and this is truly great news.
First, Ravencoin produced some of the biggest volume ever, only once was there a week with higher volume and the volume in the last two weeks is higher even than in the 2021 bull market. This clearly reveals the start of the next bullish phase, at lea
RVN/USDT – Ascending Trendline Breakdown in Play
**Pair:** RVN/USDT 💱
**Timeframe:** 1H ⏱️
**Pattern:** Ascending Trendline Breakdown Attempt ⚠️
RVN is currently attempting to break below a key ascending trendline near **0.0209**. This level has held several times, but selling pressure is increasing 📉.
**Bearish Scenario ❌**
A confirmed 1H close below **0.0205** could trigger downside momentum:
🎯 Target 1: 0.0195
🎯 Target 2: 0.0180
📉 Breakdown may accelerate if volume increases.
**Bullish Defense ✅**
If bulls reclaim **0.0220** and defend