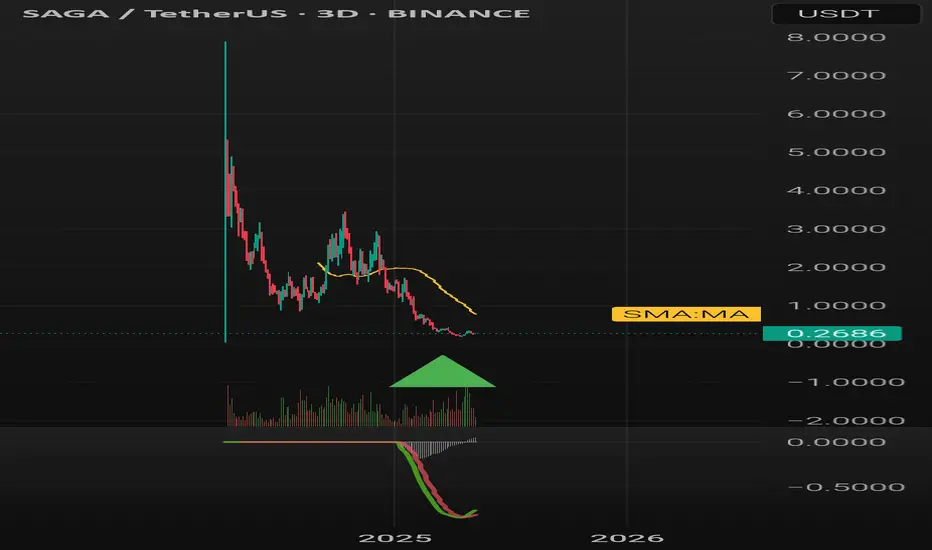
SAGAUSDT – Bear Flag, Is a Breakdown Getting Closer?📊📈 Technical Analysis
💵 Coin: LSE:SAGA #SAGA
⏳ Time Frame: 1D
📉 Pattern: 🚩 Bear Flag (Bearish Continuation Pattern)
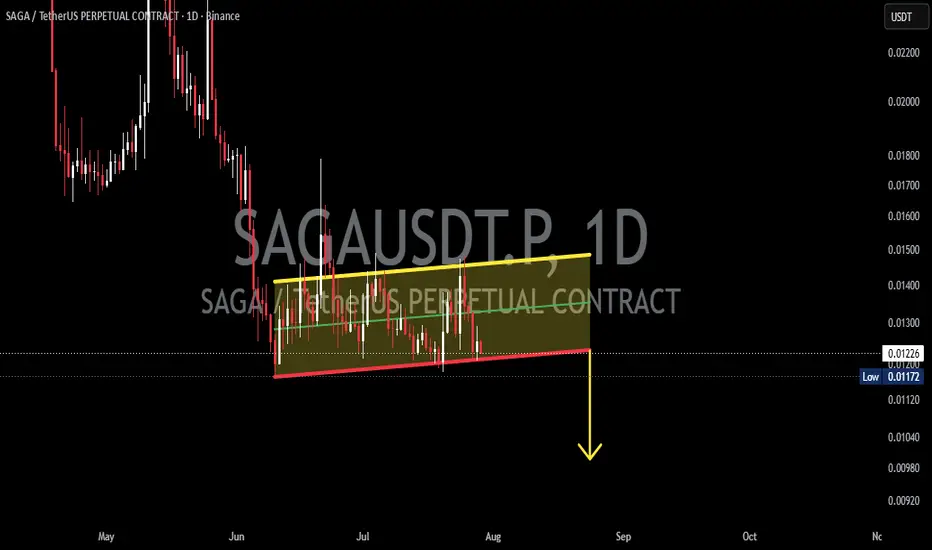
📌 SAGAUSDT remains in a clear downtrend. After experiencing a sharp decline (Flagpole), the price has started to move gradually higher within an ascending channel, forming a classic 🚩 Bear Flag pattern.
📚 From a technical perspective, this pattern is recognized as a Bearish Continuation Pattern, suggesting that the current upward movement is likely a temporary consolidation phase before the primary downtrend resumes if the support level is broken.
---
🚩📚 Bear Flag Pattern Explanation
🔻 🚩 Flagpole
📉 A sharp decline occurred before the channel was formed.
🐻 This indicates strong selling pressure and seller dominance.
⚡ It serves as the foundation of the Bear Flag pattern.
📈 🚩 Flag
↗️ Price is gradually moving higher within a slightly ascending channel.
⚠️ The bullish momentum appears weaker than the previous bearish impulse.
📊 Trading volume typically decreases during this consolidation phase, indicating that buyers have not yet gained control of the market.
🚨 📍 Bearish Confirmation
✅ The bearish setup will only be confirmed if the price breaks down below the lower support trendline with a valid Daily candle close.
📉 Such a breakdown could signal the continuation of the prevailing downtrend.
---
🐻📉 Bearish Scenario (Higher Probability)
✅ As long as the price remains below the channel resistance, selling pressure continues to dominate.
📉 If the lower channel support is broken:
🔻 The Bear Flag pattern will be confirmed.
🐻 Sellers may regain full control of the market.
📉 The price could continue declining in line with the primary bearish trend.
🎯 The downside target is generally projected using the height of the previous Flagpole, although further confirmation from price action is still required.
🚨 A breakdown accompanied by strong trading volume would significantly strengthen the bearish signal.
---
🐂📈 Bullish Scenario (Bear Flag Invalidation)
✅ The bearish outlook will begin to weaken if:
📈 The price successfully breaks above the channel resistance trendline.
🚀 A breakout supported by strong trading volume could shift the short-term market structure into a bullish trend.
💪 Buyers may regain momentum if the breakout is sustained.
⚠️ However, until a confirmed breakout occurs, the current upward movement should still be considered part of the Bear Flag consolidation.
---
🎯📌 Conclusion
📍 The primary trend of SAGAUSDT remains bearish. 🐻
🚩 The Bear Flag pattern is still valid and is approaching a key area that could determine the next major price movement.
🛡️ The lower channel support is the most critical level to monitor.
📉 A confirmed support breakdown could trigger another leg lower.
📈 A confirmed resistance breakout would invalidate the Bear Flag and open the door for a potential trend reversal.
⚠️🕯️ Always wait for candle confirmation before making any trading decisions, as false breakouts and false breakdowns can still occur.
---
#SAGA #SAGAUSDT #Crypto #Cryptocurrency #Trading #TradingView #TechnicalAnalysis #ChartAnalysis #PriceAction #BearFlag #Bearish #Downtrend #Altcoins #Binance #CryptoTrading #Support #Resistance #Breakdown #TrendFollowing #MarketAnalysis
In-depth trading ideas
Crypto - Sagausdt - Bullish diverhence - Decending wedge - long As you can see on 1H time frame SAGAUSDT formed a bullish divergence, A descending wedge is also formed on 1H time frame. Wedge upper side already broken - going in right direction - perfect bullish sign if it braked previous LH. (only for educational purpose)
$SAGA AnalysisOn-demand analysis. 👇
Higher timeframe trend is bearish overall. 📉
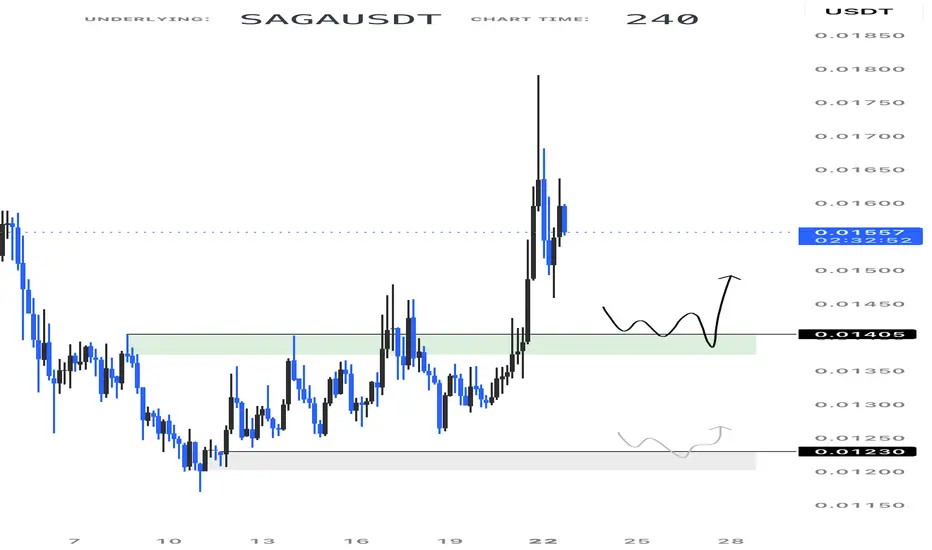
However 4H trend has shifted bullish, which is a positive sign in the short term. 📈
I’ve marked key demand zone on the chart. If price pulls back into that area and holds, we could see another bounce from there. 👀
Follow @HamzaTheInsider for more analysis.
SAGA Preparing for Major Breakout 60% Pump?SAGA is showing strong bullish momentum and holding key support levels nicely. Volume is increasing and buyers are stepping in. If breakout confirms, we could see a strong upward move in the coming days. Keep an eye on resistance zones and manage risk properly.
SAGA SHORT TP1 : 0.0257. TP2: 0.0162.Jeremiah 2:13 — "For my people have committed two evils; they have forsaken me the fountain of living waters, and hewed them out cisterns, broken cisterns, that can hold no water."
SAGA could not hold its waters.
Transfer at 0.0257. Target: 0.0162.
The cistern is broken. The descent is sealed.
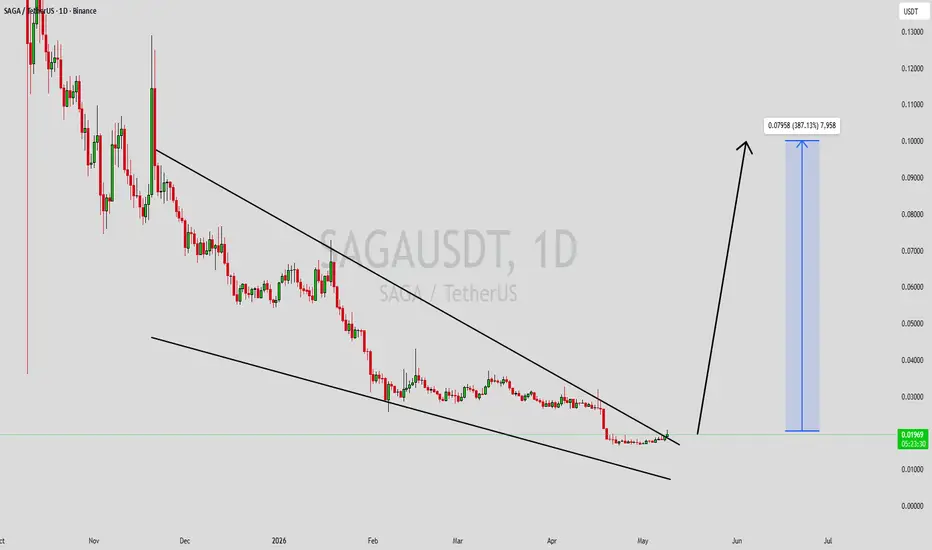
SAGAUSDT Forming Falling WedgeSAGAUSDT is forming a clear falling wedge pattern, a classic bullish wave signal that often indicates an upcoming breakout. The price has been consolidating within a narrowing range, suggesting that selling pressure is weakening while buyers are beginning to regain control. With consistent volume confirming accumulation at lower levels, the setup hints at a potential bullish breakout soon. The projected move could lead to an impressive gain of around 340% to 350% once the price breaks above the wedge resistance.
This falling wedge pattern is typically seen at the end of downtrends or corrective phases, and it represents a potential shift in market sentiment from bearish to bullish. Traders closely watching SAGAUSDT are noting the strengthening momentum as it nears a breakout zone. The strong trading volume adds confidence to this pattern, showing that market participants may already be positioning early in anticipation of a reversal.
Investors’ growing interest in SAGAUSDT reflects rising confidence in the project’s long-term fundamentals and current technical strength. If the breakout confirms with sustained volume, this could mark the start of a fresh bullish leg. Traders might find this a valuable setup for medium-term gains, especially as the falling wedge pattern completes and buying pressure accelerates.
✅ Show your support by hitting the like button and
✅ Leaving a comment below! (What is your opinion about this coin?)
Your feedback and engagement keep me inspired to share more insightful market analysis with you!
SAGAUSDT Forming Falling WedgeSAGAUSDT is forming a clear falling wedge pattern, a classic bullish wave signal that often indicates an upcoming breakout. The price has been consolidating within a narrowing range, suggesting that selling pressure is weakening while buyers are beginning to regain control. With consistent volume confirming accumulation at lower levels, the setup hints at a potential bullish breakout soon. The projected move could lead to an impressive gain of around 290% to 300% once the price breaks above the wedge resistance.
This falling wedge pattern is typically seen at the end of downtrends or corrective phases, and it represents a potential shift in market sentiment from bearish to bullish. Traders closely watching SAGAUSDT are noting the strengthening momentum as it nears a breakout zone. The strong trading volume adds confidence to this pattern, showing that market participants may already be positioning early in anticipation of a reversal.
Investors’ growing interest in SAGAUSDT reflects rising confidence in the project’s long-term fundamentals and current technical strength. If the breakout confirms with sustained volume, this could mark the start of a fresh bullish leg. Traders might find this a valuable setup for medium-term gains, especially as the wedge pattern completes and buying momentum accelerates.
✅ Show your support by hitting the like button and
✅ Leaving a comment below! (What is your opinion about this coin?)
Your feedback and engagement keep me inspired to share more insightful market analysis with you!
KEEP YOUR EYES ON SAGA🔥 Fortune AI Radar — LSE:SAGA
Fresh activity detected on LSE:SAGA today.
Data suggests increasing market interest & buyers stepping in.
Technicals currently lean bullish, with momentum trending upward.
Whales showing hints of accumulation and hype rising among traders.
This coin is flashing strong signals on short-term charts — worth keeping an eye on 👀
Not financial advice — always research before taking decisions
SAGA/USDT - Market StructureSAGA remains in a persistent downtrend.
During the flash crash, price lost its support and is now trading roughly –65% below it.
There is a chance this deviation gets filled:
— a clear bullish divergence has formed on RSI,
— on the weekly RSI, price is sitting at levels that previously produced a ~130% bounce.
If you choose to trade this setup, a stop-loss is mandatory.
Last time, the stop saved the position from a –90% drawdown.
Consider taking most profits in the $0.12–0.19 range.
Risk in Global Events and Geopolitical News1. Understanding Geopolitical Risk
Geopolitical risk is fundamentally tied to countries, governments, conflict, policy, and global relationships. It involves evaluating how political decisions or international disputes may impact economic conditions.
Common sources of geopolitical risk include:
Wars and military conflicts
Terror attacks or large-scale violence
Trade wars and tariff disputes
Sanctions and diplomatic tensions
Elections and political instability
Shifts in alliances and treaties
Border conflicts
Energy supply disruptions
Natural disasters with political implications
Markets dislike uncertainty, and geopolitical news creates exactly that. Even a small headline can trigger massive market reactions if it suggests potential disruption to economic activity or global trade.
2. Major Categories of Global Event Risks
a) Political Instability and Elections
Elections, leadership changes, coups, or political protests can quickly impact markets. Investors prefer stable governments, predictable policies, and clear regulatory environments.
For example:
A surprise election result can shift a country’s economic policy direction.
Political unrest can affect tourism, investment, and consumer confidence.
Countries with weak institutions often face market sell-offs during instability.
b) Wars and Military Conflicts
Armed conflicts are among the most severe geopolitical risks. They disrupt trade routes, destroy infrastructure, create inflationary pressures, and affect global commodity markets.
Conflicts in key regions like the Middle East can instantly affect global oil prices, while tensions between major powers (like the US, China, or Russia) can shake global markets.
c) Trade Wars and Economic Sanctions
Modern geopolitical tensions often play out through tariffs, sanctions, and economic restrictions instead of full-scale wars.
Examples:
US–China trade war caused supply chain disruptions worldwide.
Sanctions on Russia affected energy markets and global inflation.
Restrictions on semiconductor exports changed technology investments.
Trade barriers make goods more expensive, limit production, and reduce GDP growth — all of which increase market volatility.
d) Global Health Crises and Pandemics
Events like COVID-19 demonstrate how a health crisis can become a global economic shock.
Impact areas:
Lockdowns disrupt supply chains.
Travel and tourism collapse.
Labor shortages slow production.
Governments increase fiscal spending.
Pandemics are rare but extremely high-impact risks.
e) Natural Disasters
Earthquakes, floods, hurricanes, and climate-related disasters also create geopolitical and economic ripple effects.
For example:
A major earthquake in Japan affects global automobile and electronics supply chains.
Floods in agricultural regions push food prices higher.
Climate change policies alter energy markets and industrial investments.
f) Currency and Debt Crises
A country’s financial instability can also spark global panic.
Events include:
Sovereign debt defaults
Currency devaluation
Banking crises
Such crises reduce investor confidence, harm trade partners, and can lead to capital flight from emerging markets.
3. How Geopolitical News Impacts Financial Markets
a) Stock Markets
Equity markets react immediately to global events. Negative geopolitical news often triggers:
Market sell-offs
Flight to safety (investors move money to safer assets)
Increased volatility (VIX index spikes)
Sectors directly related to global risk — defense, energy, cyber security — sometimes rise during geopolitical tensions.
b) Currency Markets
Forex markets are extremely sensitive to geopolitical instability.
Safe-haven currencies like USD, JPY, and CHF strengthen.
Currencies of unstable or exposed countries weaken.
Currency volatility increases trading opportunities but also risk.
For example, during conflicts in Europe, the Euro often faces downward pressure.
c) Commodity Markets
Commodities like crude oil, natural gas, gold, wheat, and metals react sharply to global events.
Oil prices rise when conflict threatens supply in the Middle East.
Gold becomes a safe-haven during uncertainty.
Agricultural prices rise after climate disasters or geopolitical disruptions.
d) Bond Markets
Government bonds, especially US Treasuries, become highly attractive during geopolitical crises. Investors seek safety and stable returns, causing bond yields to fall as prices rise.
4. Sector-Wise Impact of Geopolitical Risk
Energy Sector
Among the most sensitive sectors. Conflicts in oil-producing nations cause:
Supply disruptions
Price spikes
Inflation in importing countries
Technology Sector
Geopolitics affects:
Semiconductor supply chains
Data security regulations
Cyber-security threats
Export restrictions on advanced technology
Defense & Aerospace
Risks and conflicts often boost:
Defense budgets
Weapon system demand
Military research investments
Agriculture
Weather, climate, political instability, and war all shape global food supply. Sanctions or blockades affect trade routes and prices.
5. How Traders and Investors Manage Geopolitical Risk
a) Diversification
Holding a variety of assets (stocks, bonds, commodities, currencies) reduces exposure to any single geopolitical event.
b) Hedging Strategies
Using derivatives like:
Options
Futures
Currency hedges
These protect portfolios from sudden market swings.
c) Monitoring Global News
Professional traders constantly track:
Government decisions
Diplomatic meetings
Conflict zones
Major speeches
Data releases
Timely information is the key to navigating geopolitical risk.
d) Investing in Safe Havens
During turmoil, traders often shift to:
Gold
US Treasury bonds
Swiss franc
Japanese yen
Defensive stocks (utilities, healthcare)
e) Scenario Analysis
Institutions often simulate “what if” scenarios:
What if oil supply drops by 20%?
What if a conflict intensifies?
What if sanctions expand?
This helps them prepare in advance.
6. Long-Term Economic Impact of Geopolitical Risks
Geopolitical tensions can reshape global economics for decades. Examples include:
Redefined trade routes (like India–Middle East–Europe corridor)
New energy alliances (shift to renewables)
Rise of regional manufacturing (China+1 strategy)
Increased defense expenditure worldwide
These long-term shifts create opportunities as well as risks.
Conclusion
Global events and geopolitical news are powerful drivers of market movements, economic decisions, and investor behavior. From wars and elections to trade wars and natural disasters, these events bring both risks and opportunities. Successful traders and businesses understand these dynamics, monitor trends closely, diversify their exposure, and adapt strategies to manage uncertainty.
In a world where information travels instantly and economies are deeply interconnected, geopolitical awareness has become essential for anyone involved in markets. Understanding and preparing for these risks not only prevents losses but also allows individuals and institutions to make smarter, more confident decisions in a constantly changing global landscape.
SAGAUSDT Forming Falling WedgeSAGA/USDT is developing a classic falling-wedge formation, signaling that downside pressure may be easing and a bullish reversal could be near. The compression in price — with lower highs slowly tightening — suggests that sellers are running out of steam, while buyers may be building a base. Volume behavior is healthy, and a breakout above the wedge’s upper trendline could confirm a reversal and lead to a strong upward leg.
On the fundamentals side, SAGA is a Layer-1 blockchain built for on-chain gaming and social applications, with a focus on NFT marketplaces, web3 identity, and low-latency scalability. This aligns well with themes like “play-to-earn”, web3 gaming infrastructure, and multichain social metaverse, which are increasingly popular among developers and investors. Its token, SAGA, is used for staking, governance, and transaction fees in the network, giving it multifaceted utility.
Tokenomics also favor a potential breakout: SAGA has a capped or controlled supply with a portion allocated to ecosystem incentives, validator rewards, and community programs. A meaningful share of tokens are locked or vested, reducing active circulation and potentially creating supply-side tailwinds as ecosystem adoption grows. As more developers build on SAGA, staking demand could increase, putting upward pressure on the token.
From a trading perspective, the ideal setup would be to wait for a clean breakout above the upper trendline of the wedge, confirmed by a strong volume candle. A retest of that breakout point could offer a favorable entry, while a stop should be placed just below the recent swing low or the lower wedge boundary. If the breakout holds, the risk-reward is very attractive given SAGA’s strong use case and structural setup.
SAGAUSDT 1D#SAGA is moving inside a falling wedge pattern on the daily chart. For the bullish scenario to play out, it must bounce from the wedge support line and break above the pattern. So, wait for a solid breakout before entering this coin. If that happens, the potential targets are:
🎯 $0.1992
🎯 $0.2620
🎯 $0.3564
🎯 $0.4327
🎯 $0.5090
🎯 $0.6176
🎯 $0.7560
⚠️ Always remember to use a tight stop-loss and maintain proper risk management.
Saga = 2025 version of AAVE?
Back in 2020, very few people paid attention to $LEND.
Then it rebranded to EURONEXT:AAVE , and in Q4 2020 the real run began:
📈 from $0.40 → $600+ in less than a year.
Fast forward to today:
• Rebecca (Saga co-founder) just confirmed their DeFi layer is being built with ideas similar to AAVE’s early innovations:
🔹 integrated liquidity across L1s
🔹 on-chain carry trading
🔹 stacked stablecoin yields
🔹 flash loans as inspiration
But here’s the kicker 👀
Saga isn’t just DeFi.
It’s a general L1 blockchain, meaning the upside isn’t limited to lending/borrowing protocols — the ecosystem can expand way beyond.
💡 History doesn’t repeat, but it rhymes.
If AAVE was the DeFi star of 2020, Saga could be setting up as one of the L1 stars of 2025.
👉 Not saying Saga will pull a $600 AAVE move…
But with everything being built, can we at least expect a return to its ATH of $8–10? 🤔🔥
SAGAUSDT — Descending Triangle: Preparing for a Major Move?📌 Market Context
On the 2D timeframe, SAGA/USDT has been in a prolonged downtrend since late 2024 into early 2025. Recently, price action has formed a descending triangle: consistent lower highs pressing down against a flat demand zone at 0.22–0.24.
This structure reflects seller dominance (lower highs) while buyers continue to defend the same support. As price compresses into the apex of the triangle, volatility shrinks — signaling that a major move is imminent, either bullish breakout or bearish breakdown.
---
📊 Technical Structure & Key Levels
Key Demand Zone: 0.22 – 0.24 (highlighted in yellow)
Next Supports: 0.1835 (previous low), extension toward ~0.135 if breakdown accelerates
Stepwise Resistances:
0.3056 → first bullish validation
0.3993 → strong horizontal resistance
0.6508 → measured move confluence from triangle height
1.2263 → higher timeframe resistance
1.6265 → major resistance zone
2.7333 & 3.2828 → ambitious targets if macro bullish cycle resumes
Downtrend Line: descending resistance from multi-month highs, currently near 0.26–0.28
---
🟢 Bullish Scenario
Trigger:
Breakout above the downtrend line and a 2D close above 0.3056
Confirmation:
Increased volume + successful retest turning 0.27–0.305 into support
Targets:
T1: 0.3993
T2: 0.6508 (measured move projection)
T3: 1.2263 if momentum extends further
Alternative setup:
A fake breakdown below 0.22 followed by a quick reclaim above 0.23–0.24 could trigger a bear trap and squeeze price towards 0.3056/0.3993
Invalidation:
Failure above 0.3056 with price falling back under 0.26
---
🔴 Bearish Scenario
Trigger:
A decisive 2D close below 0.22 (triangle floor breakdown)
Confirmation:
Retest into 0.22–0.24 fails, flipping the zone into supply
Targets:
T1: 0.1835 (prior low)
T2: ~0.135 if sellers maintain pressure
Invalidation:
Price reclaims 0.24–0.26 with sustained strength
---
⚖️ Conclusion
The descending triangle on SAGAUSDT is now nearing completion, with price action coiling tightly around the 0.22–0.24 demand zone. Historically, this pattern favors continuation to the downside, but a bullish reversal remains possible if buyers reclaim control with a breakout above 0.3056.
In setups like this, traders often prepare for both scenarios instead of guessing direction:
React to the confirmed breakout or breakdown
Define clear invalidation levels for strict risk management
The market is reaching its decision point — the next move could be explosive.
#SAGA #SAGAUSDT #CryptoAnalysis #DescendingTriangle #PriceAction #ChartPattern #Breakout #Breakdown #CryptoTrading #SupportResistance #RiskManagement
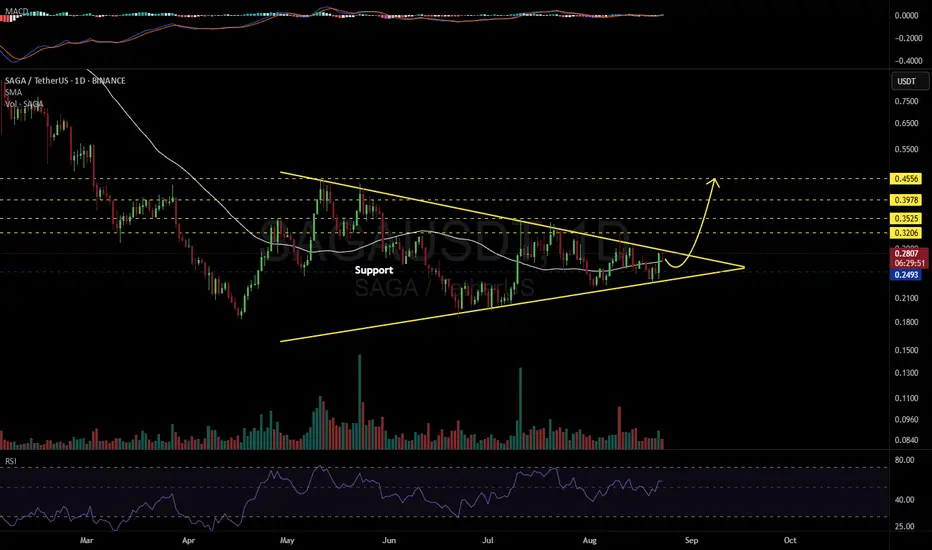
SAGAUSDT 1D#SAGA is moving inside a symmetrical triangle on the daily chart. Consider buying some #SAGA at the current price and near the support level of $0.2493.
In case of a breakout, the potential targets are:
🎯 $0.3206
🎯 $0.3525
🎯 $0.3978
🎯 $0.4556
⚠️ As always, use a tight stop-loss and apply proper risk management.
SAGA/USDT – Endgame of Descending Triangle, Big Move Coming!🧠 Overview:
SAGA/USDT has been forming a Descending Triangle pattern for nearly 6 months, reflecting sustained selling pressure while maintaining strong horizontal support between $0.2352 – $0.1835. The price is now approaching the apex of the triangle, suggesting that a major move is imminent — either a bullish breakout or a bearish breakdown.
This setup is a classic “make or break” moment that often precedes explosive price action.
---
🔍 Technical Pattern: Descending Triangle
Dynamic Resistance: Lower highs forming a clear downtrend since February 2025.
Strong Support: The base of the triangle is solidified in the $0.2352–$0.1835 zone, which has been tested multiple times.
This pattern shows increasing sell pressure, but also persistent buyer defense — tension is rising.
---
🟢 Bullish Scenario: Breakout and Trend Reversal?
A confirmed breakout above the descending trendline and resistance at $0.3260 would signal a potential trend reversal and the start of bullish momentum.
📌 Bullish Target Levels:
1. $0.4082 – first local resistance
2. $0.5682 – volume-heavy area
3. $0.6607 – measured breakout target
4. $1.1656 – medium-term resistance
5. $1.6576 to $2.34 – possible if strong altcoin rally occurs
📈 Bullish Confirmation Signals:
Strong bullish candle close above trendline
Significant volume spike
RSI bouncing from neutral or oversold area
---
🔴 Bearish Scenario: Breakdown from Support
If the price breaks below $0.2352 and fails to hold the critical level at $0.1835, it may trigger a deeper continuation of the long-term downtrend.
📌 Bearish Target Zones:
$0.1500 psychological level
Possibly lower, depending on macro sentiment
⚠️ Caution:
Watch out for false breakdowns — wait for daily candle confirmation before reacting emotionally.
---
📊 Strategic Summary:
SAGA is at a critical inflection point — either it breaks out to reverse the trend or continues the downtrend with new lows. While descending triangles are typically bearish patterns, bullish breakouts can invalidate the structure, especially if supported by volume and sentiment.
💡 Pro Tip:
Always wait for daily candle close confirmation
Use RSI/MACD to confirm momentum shifts
Set tight stop-losses, especially near support/resistance
#SAGAUSDT #CryptoAnalysis #TechnicalBreakout #DescendingTriangle #BullishSetup #Altcoins #TrendReversal #CryptoChart #BreakoutWatch #VolumeAnalysis #PriceAction
SAGAUSDTNow is the time to buy and hold with low risk.
Target: 0.70
Stop-loss: Weekly candle close below 0.17
I'm just sharing my personal opinion to help us all better understand the market’s potential.
Always do your own research before investing — don’t rely solely on my view as a beginner, or anyone else's, even top analysts.
No one can predict the future with certainty.
Wishing peace and clarity to everyone.