In-depth trading ideas
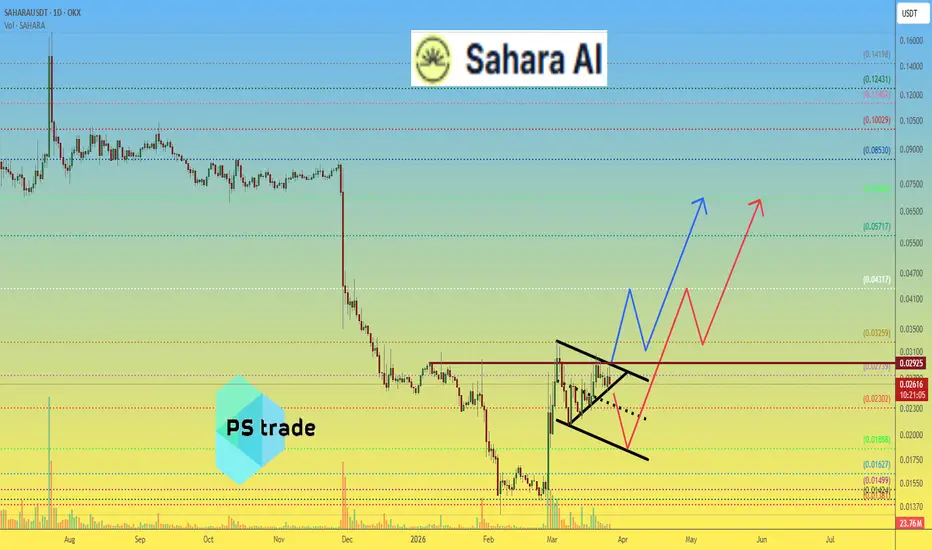
SAHARA price analysisDespite overall market weakness, CRYPTOCAP:SAHARA looks suspiciously strong
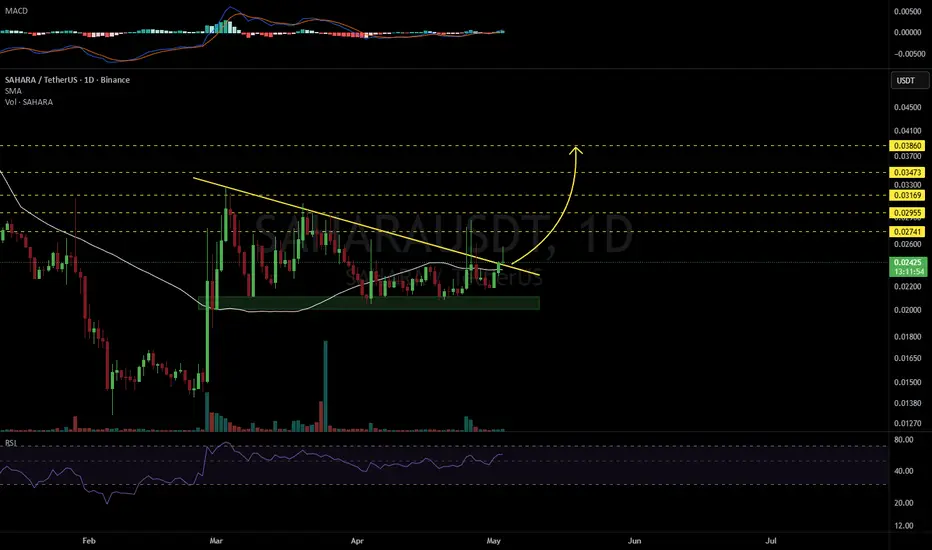
You look at OKX:SAHARAUSDT — and it’s clear the price is being held.
Not dumping with the rest of the market → something is likely being prepared.
An impulse is coming. The only question is — which direction?
📌 The next 1–3 days could be decisive:
🔼 Holding above $0.029 → opens the way for a faster move up
🔽 Dropping below $0.025 → then the logical buy zone is around $0.0185
Structurally, nothing has changed:
Mid-term target for #SaharaAI still sits around $0.070–0.072
In simple terms:
🔹 either the move starts now
🔹 or we get one more dip before the upside
❓Do you think they’ll give a lower entry, or is the move about to start?
______________
◆ Follow us ❤️ for daily crypto insights & updates!
🚀 Don’t miss out on important market moves
🧠 DYOR | This is not financial advice, just thinking out loud
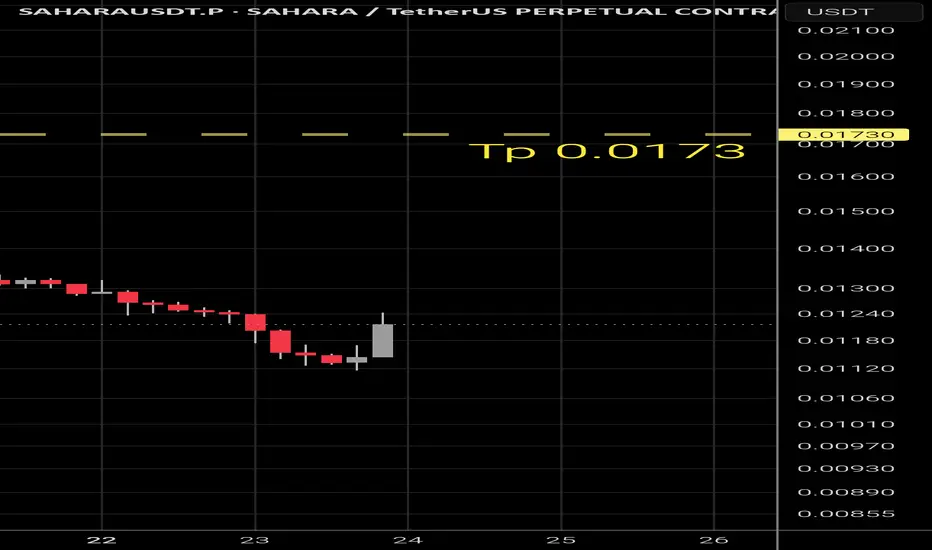
Title: SAHARA/USDT: Consolidation and Liquidity Hunting – Long Analysis:
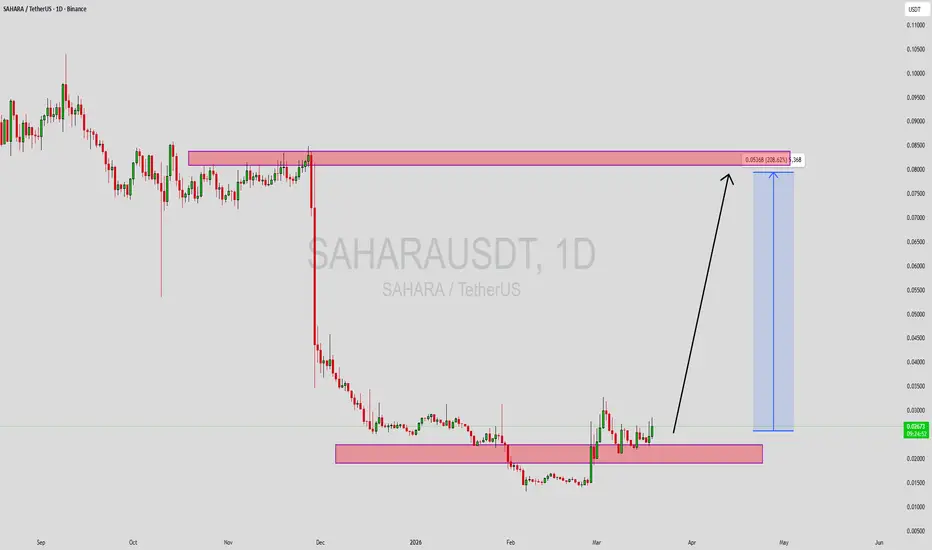
My technical analysis of SAHARA/USDT on the daily timeframe points to the construction of a base for a bullish continuation. Key observations:
Demand Zone: The price is currently testing a significant support level that coincides with a previous accumulation zone.
Volume: I am paying close attention to the high volume from March—it serves as the foundation for the current structure. The market has effectively "absorbed" the supply in this area.
Action Plan:
Entry: Accumulation around the current support level.
Targets (TP): Following the price levels marked on the chart (TP1, TP2, TP3), with TP1 acting as the first point for partial profit taking.
Stop Loss (SL): Holding the position is justified as long as the price remains above the support zone. A daily close below this area invalidates the bullish scenario.
Disclaimer: Remember to manage your capital appropriately. The cryptocurrency market is characterized by high volatility. This is not financial advice.
#SAHARA #CryptoTrading #LongSetup #TechnicalAnalysis #TradingView
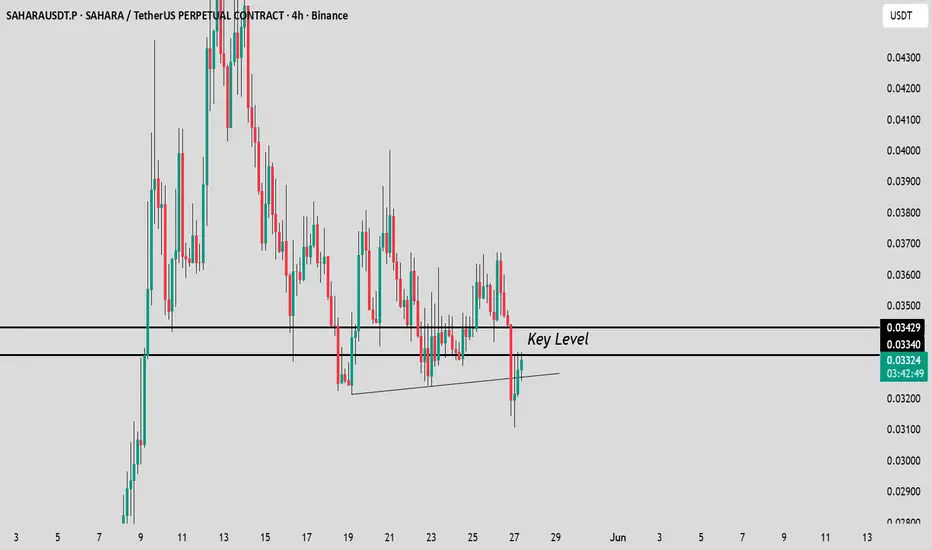
SAHARA / USDT Near Key Level — Breakout or New Lows Ahead?SAHARA / USDT is currently approaching a crucial key level that could decide the next major move. If price successfully breaks through this zone with strength, we may see a bullish continuation toward the $0.36, $0.40, and $0.45 targets. However, if price fails to break this level and turns it into resistance, the market could move toward new lows. Watch the price action closely, wait for proper confirmation before entering, and always manage risk wisely. 📊
SAHARA Breakout or Breakdown? - SAHARAUSDT 4HComprehensive Technical Analysis — SAHARAUSDT 4H
SAHARA’s structure has not been completely destroyed compared to many altcoins yet, but the market has entered an exhausting low-momentum phase.
At the moment:
* Price is compressed near the moving averages
* Volatility has decreased
* The market is trapped between medium-term support and overhead supply
* Volume has declined significantly compared to the initial pump wave
For now, the market is mostly in a:
Consolidation phase.
Candlestick Behavior
Over the past few days:
* Candles have become smaller
* Candle bodies are weak
* Wicks have become more balanced
This behavior usually reflects:
* Weakening strength from both sides of the market
* Waiting for a directional breakout
Reaction to Supply Zone
The:
0.045 to 0.047
zone has rejected price multiple times.
* Bullish candles failed to show follow-through
* Selling pressure became active
* Short-term highs failed to hold
This means:
sellers still maintain relative control near the highs.
Current Candle Structure
In the current zone:
candles mostly show compression behavior.
Market energy is currently building.
At the moment, the market has:
* Neither produced a bullish breakout
* Nor a bearish breakdown
The overall structure still maintains:
Higher Lows
However:
no new Higher High has formed.
This means:
the bullish trend has weakened,
but has not fully reversed yet.
Wave Behavior
The initial move:
was a sharp and aggressive impulse wave.
After that:
the market entered a time-based correction,
while no deep price correction occurred.
This is important because:
buyers still maintain part of the structure.
Probable Cycle
The current scenario looks more like a:
Re-Accumulation Range
Meaning:
the market is building a new base after the initial impulse wave.
However:
the breakout has not been confirmed yet.
Volume Behavior
During the main pump:
explosive volume entered the market,
and strong momentum formed.
But now:
* Volume has decreased
* The market has become calmer
This behavior is typical during a resting phase.
Volume Spikes
Near the recent lows,
several volume spikes appeared.
This may indicate:
buyers have not completely abandoned the market yet.
However:
heavy liquidity inflows for trend continuation are still not visible.
Overall Volume Interpretation
Current volume behavior supports:
range formation and compression,
rather than the beginning of a new impulsive wave.
Conclusion
Current SAHARA condition:
the market is in a compression and decision-making phase.
The structure is not fully broken yet,
but bullish momentum has clearly weakened.
Key points:
* The 0.045–0.047 resistance zone is extremely important
* 0.032 is the key support
* Volume is currently not explosive
* The market needs a directional breakout
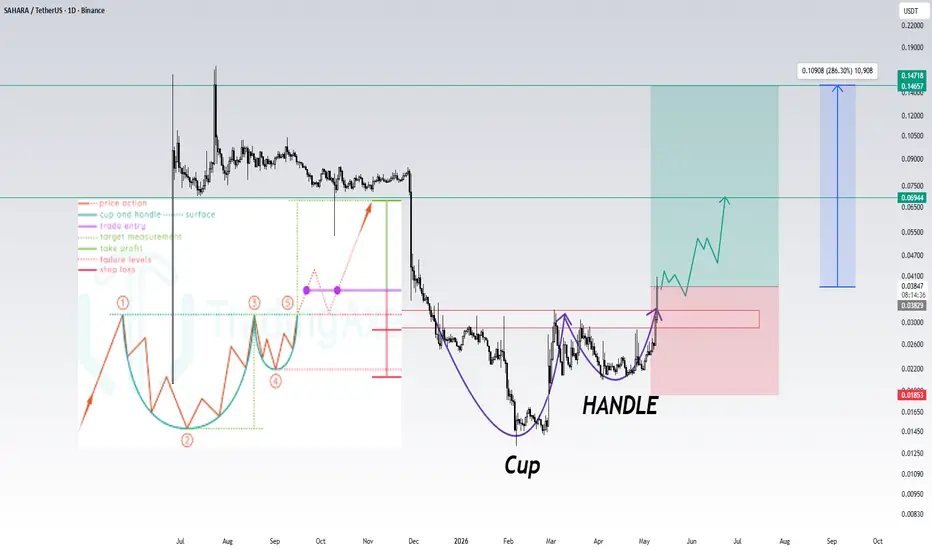
SAHARA/USDT - Classic Cup & Handle Breakout Setup Massive Upsid
Pattern Analysis:
The chart displays a textbook Cup & Handle continuation pattern on the daily timeframe. Cup: Formed between October 2025 - March 2026 with a smooth rounded bottom (strong accumulation phase).
Handle: Constructed through April-May 2026 with a healthy consolidation and higher low structure.
Key Levels:Current Price: ~0.0383 (+25.35% today)
Handle Breakout Zone: 0.0383 - 0.0410
Major Resistance: 0.0694
Projected Target 1: 0.1090 (+286%)
Projected Target 2: 0.1472 (+~285% from breakout)
Technical Outlook:
Bullish momentum is building after a strong rejection from the handle lows. The breakout above the handle resistance signals the completion of the pattern. Volume confirmation and higher timeframe structure remain supportive for a significant move higher.Trading Plan:Entry: Above 0.0383-0.0410 with volume
Stop Loss: Below handle low ~0.0185 (invalidates pattern)
Take Profit: TP1: 0.0694
TP2: 0.1090
TP3: 0.1472 (measured move)
Risk/Reward: Extremely favorable on this setup.The classic cup & handle is one of the most reliable bullish continuation patterns in technical analysis. SAHARA appears to be following the blueprint perfectly.
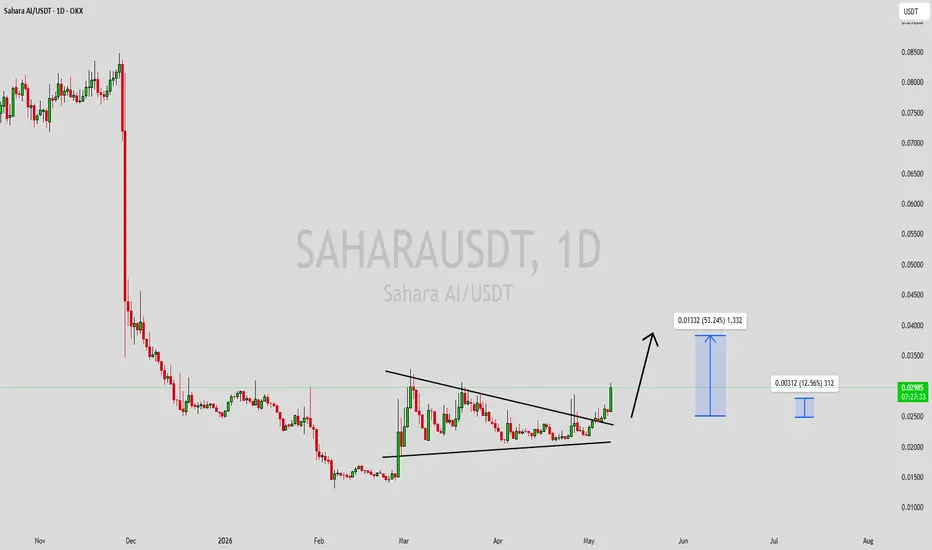
SAHARAUSDT Forming Descending ChannelSAHARAUSDT is forming a clear descending channel pattern, a classic bullish wave signal that often indicates an upcoming breakout. The price has been consolidating within a controlled downward range, suggesting that selling pressure is gradually weakening while buyers are beginning to regain strength. With consistent volume confirming accumulation at lower levels, the setup hints at a potential bullish breakout soon. The projected move could lead to an impressive gain of around 40% to 50% once the price breaks above the channel resistance.
This descending channel pattern is typically seen during corrective phases before a strong bullish reversal, and it represents a possible shift in market sentiment from bearish to bullish. Traders closely watching SAHARAUSDT are noticing strengthening momentum as the price approaches a key breakout zone. The healthy trading volume adds confidence to this setup, showing that market participants may already be positioning early in anticipation of a bullish continuation.
Investors’ growing interest in SAHARAUSDT reflects increasing confidence in the project’s long-term potential and current technical structure. If the breakout confirms with sustained buying volume, this could mark the beginning of a fresh bullish rally. Traders may find this an attractive setup for medium-term opportunities, especially as the descending channel pattern nears completion and momentum continues to build.
✅ Show your support by hitting the like button and
✅ Leaving a comment below! (What is your opinion about this coin?)
Your feedback and engagement keep me inspired to share more insightful market analysis with you!
SAHARAUSDT Forming Descending ChannelSAHARAUSDT is forming a clear descending channel pattern, a classic bullish wave signal that often indicates an upcoming breakout. The price has been consolidating within a narrowing range, suggesting that selling pressure is weakening while buyers are beginning to regain control. With consistent volume confirming accumulation at lower levels, the setup hints at a potential bullish breakout soon. The projected move could lead to an impressive gain of around 40% to 50% once the price breaks above the wedge resistance.
This descending channel pattern is typically seen at the end of downtrends or corrective phases, and it represents a potential shift in market sentiment from bearish to bullish. Traders closely watching SAHARAUSDT are noting the strengthening momentum as it nears a breakout zone. The good trading volume adds confidence to this pattern, showing that market participants are positioning early in anticipation of a reversal.
Investors’ growing interest in SAHARAUSDT reflects rising confidence in the project’s long-term fundamentals and current technical strength. If the breakout confirms with sustained volume, this could mark the start of a fresh bullish leg. Traders might find this a valuable setup for medium-term gains, especially as the wedge pattern completes and buying momentum accelerates.
✅ Show your support by hitting the like button and
✅ Leaving a comment below! (What is your opinion about this coin?)
Your feedback and engagement keep me inspired to share more insightful market analysis with you!
SAHARAUSDT Forming Bullish WaveSAHARAUSDT is forming a clear bullish wave pattern, a classic bullish reversal signal that often indicates an upcoming breakout. The price has been consolidating within a narrowing range, suggesting that selling pressure is weakening while buyers are beginning to regain control. With consistent volume confirming accumulation at lower levels, the setup hints at a potential bullish breakout soon. The projected move could lead to an impressive gain of around 190% to 200% once the price breaks above the wedge resistance.
This bullish wave pattern is typically seen at the end of downtrends or corrective phases, and it represents a potential shift in market sentiment from bearish to bullish. Traders closely watching SAHARAUSDT are noting the strengthening momentum as it nears a breakout zone. The good trading volume adds confidence to this pattern, showing that market participants are positioning early in anticipation of a reversal.
Investors’ growing interest in SAHARAUSDT reflects rising confidence in the project’s long-term fundamentals and current technical strength. If the breakout confirms with sustained volume, this could mark the start of a fresh bullish leg. Traders might find this a valuable setup for medium-term gains, especially as the pattern completes and buying momentum accelerates.
✅ Show your support by hitting the like button and
✅ Leaving a comment below! (What is your opinion about this Coin?)
Your feedback and engagement keep me inspired to share more insightful market analysis with you!
SAHARAUSDT Forming Bullish MomentumSAHARAUSDT is forming a clear bullish momentum pattern, a classic bullish reversal signal that often indicates an upcoming breakout. The price has been consolidating within a narrowing range, suggesting that selling pressure is weakening while buyers are beginning to regain control. With consistent volume confirming accumulation at lower levels, the setup hints at a potential bullish breakout soon. The projected move could lead to an impressive gain of around 190% to 200% once the price breaks above the wedge resistance.
This bullish momentum pattern is typically seen at the end of downtrends or corrective phases, and it represents a potential shift in market sentiment from bearish to bullish. Traders closely watching SAHARAUSDT are noting the strengthening momentum as it nears a breakout zone. The good trading volume adds confidence to this pattern, showing that market participants are positioning early in anticipation of a reversal.
Investors’ growing interest in SAHARAUSDT reflects rising confidence in the project’s long-term fundamentals and current technical strength. If the breakout confirms with sustained volume, this could mark the start of a fresh bullish leg. Traders might find this a valuable setup for medium-term gains, especially as the pattern completes and buying momentum accelerates.
✅ Show your support by hitting the like button and
✅ Leaving a comment below! (What is your opinion about this Coin?)
Your feedback and engagement keep me inspired to share more insightful market analysis with you!
SAHARA/USDTMarkets don’t become bullish just because a setup appears.
Sometimes the setup exists — but the environment doesn’t support it.
Right now SAHARA/USDT is trading near 0.0268, close to a potential entry zone, with resistance around 0.0277.
The broader idea leans bullish, but the current conditions are not aligned.
Here is what the structure suggests:
• Price is holding near short-term support
• Setup technically allows for a continuation
• Volatility is elevated
But at the same time:
• Order book shows strong seller pressure
• Trade flow is dominated by sellers
• Volume is below average
• Liquidity remains thin
That combination often leads to failed continuation attempts rather than clean trends.
Two scenarios from here
Bullish scenario
If price manages to absorb the selling pressure and hold above support, continuation may extend toward:
• 0.02775 area
• 0.02950+ area
This would indicate that buyers are stepping in despite the current imbalance.
Failure scenario
If selling pressure continues, the setup may fail before continuation develops.
The key level to watch then becomes:
• 0.02575 support zone
A breakdown below this level would invalidate the bullish context and shift the structure lower.
Practical approach
In conditions like this, the main risk is not direction — it’s conflict inside the market.
Bullish setup vs strong selling pressure
→ this is where most traders get trapped
A more structured approach is:
• Avoid forcing entries in mixed conditions
• Let the market confirm by holding support
• Treat rejection or breakdown as a signal, not a surprise
Support to watch: 0.02575
Resistance to watch: 0.02775
In environments like this, the goal is not prediction.
It’s recognizing when not to trade.
🧩 No trade is also a decision.
SAHARAUSDT Forming Falling WedgeSAHARAUSDT is forming a clear falling wedge pattern, a classic bullish reversal signal that often indicates an upcoming breakout. The price has been consolidating within a narrowing range, suggesting that selling pressure is weakening while buyers are beginning to regain control. With consistent volume confirming accumulation at lower levels, the setup hints at a potential bullish breakout soon. The projected move could lead to an impressive gain of around 190% to 200% once the price breaks above the wedge resistance.
This falling wedge pattern is typically seen at the end of downtrends or corrective phases, and it represents a potential shift in market sentiment from bearish to bullish. Traders closely watching SAHARAUSDT are noting the strengthening momentum as it nears a breakout zone. The good trading volume adds confidence to this pattern, showing that market participants are positioning early in anticipation of a reversal.
Investors’ growing interest in SAHARAUSDT reflects rising confidence in the project’s long-term fundamentals and current technical strength. If the breakout confirms with sustained volume, this could mark the start of a fresh bullish leg. Traders might find this a valuable setup for medium-term gains, especially as the wedge pattern completes and buying momentum accelerates.
✅ Show your support by hitting the like button and
✅ Leaving a comment below! (What is your opinion about this Coin?)
Your feedback and engagement keep me inspired to share more insightful market analysis with you!
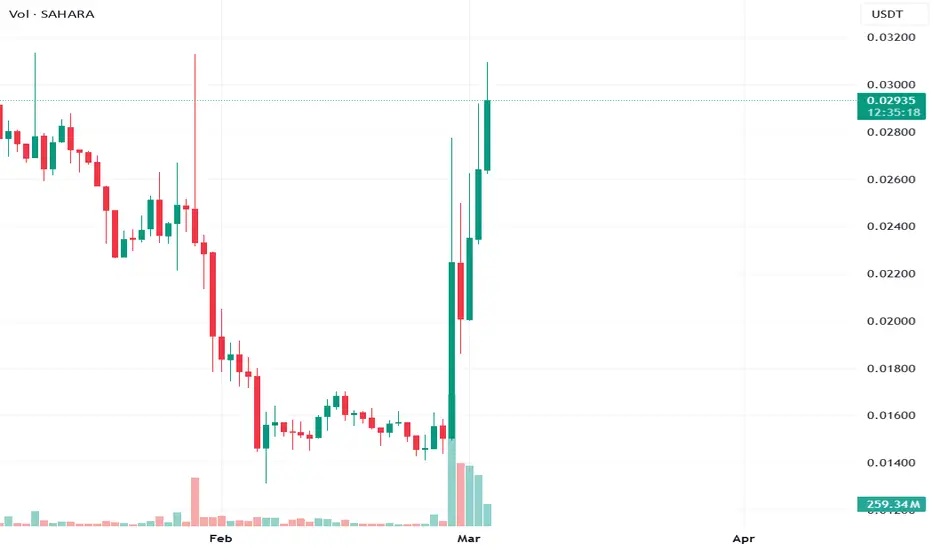
1.618 TP and pulling back to price discoverySeeing an 85% run up from BASE to point A and pulling back -30% to point B. That range seems to be extending to its 1.618% and making a complex pullback between 0.2800 to 0.032 area.
Swing doodle made on top of Monday's High with confluence of several liquidity pockets.
I might be sleeping on this though.
SAHARAUSDT — Near Short LiquidationPrice at 0.02966 with futures at 0.02947. Premium is -0.64% with a Z-score of -1.1. Slight futures discount but nothing extreme. The real story is everything else around it.
This is one of the most lopsided signal readings you will see. 96.4% bull vs 3.6% bear. 54 green signals against just 2 red out of 112. Every EMA is green. Every candle pattern is green. Ichi TK 12 to 1. Spread at 92.9% extreme. When signals get this unanimous, two things are true. The trend is undeniable and most of the move has already happened.
Bounce probability is at 109.8% with a 34.8x multiplier. That is parabolic territory. Retrace only -3.2% which means pullbacks are getting bought instantly. Squeeze just fired with momentum accelerating at 92.16% bandwidth. Price is sitting right on demand.
Volume tells a cleaner story than the last few setups. Spot Z is 0.24 which is average. Futures Z at 1.53 is strong but not extreme. The ratio is only 5x which means this is not a pure futures-driven ghost market. Spot is participating. The futures-to-spot dollar flow shows 14.79M against 225.75M which confirms spot is carrying the heavier weight here. Direction is bull lean with momentum accelerating.
The problem is leverage. 15.16x and high. All-time max was 18.59x just 3 bars ago. Percentile at 80.2% in upper territory. Price percentile at 18% floor. That combination of floor price with upper leverage means the market is heavily positioned for continuation. Liquidations are near short levels which explains part of the squeeze momentum. Shorts are being hunted.
OBV Z at -0.54 with strong upward direction is the one flag worth watching. Negative OBV Z means cumulative volume flow has not confirmed the price move yet. Price is leading and volume is catching up. That works until it does not.
If shorts keep getting liquidated this pushes higher without resistance. The signal unanimity supports that. But entering a 96% consensus trade at 80th percentile leverage with OBV still negative is paying full price for a move that started without you. Better entries come on any leverage flush back toward the 50th percentile where risk reward actually makes sense. The trend is your friend here but the entry is not.
More analysis on my profile.
🎯 Target: 1K Followers
👉 Follow: stingrayea
SAHARAUSDT Forming Falling WedgeSAHARAUSDT is forming a clear falling wedge pattern, a classic bullish reversal signal that often indicates an upcoming breakout. The price has been consolidating within a narrowing range, suggesting that selling pressure is weakening while buyers are beginning to regain control. With consistent volume confirming accumulation at lower levels, the setup hints at a potential bullish breakout soon. The projected move could lead to an impressive gain of around 190% to 200% once the price breaks above the wedge resistance.
This falling wedge pattern is typically seen at the end of downtrends or corrective phases, and it represents a potential shift in market sentiment from bearish to bullish. Traders closely watching SAHARAUSDT are noting the strengthening momentum as it nears a breakout zone. The good trading volume adds confidence to this pattern, showing that market participants are positioning early in anticipation of a reversal.
Investors’ growing interest in SAHARAUSDT reflects rising confidence in the project’s long-term fundamentals and current technical strength. If the breakout confirms with sustained volume, this could mark the start of a fresh bullish leg. Traders might find this a valuable setup for medium-term gains, especially as the wedge pattern completes and buying momentum accelerates.
✅ Show your support by hitting the like button and
✅ Leaving a comment below! (What is your opinion about this Coin?)
Your feedback and engagement keep me inspired to share more insightful market analysis with you!
SAHARAUSDT Extreme Bull Parabolic But Futures Squeeze Trap
SAHARAUSDT 27/02/2026 19:06
💰 0.02438 | Fut: 0.02285 🔥 Extreme BULL 88.24%
🟢(94.1%) : 🔴(5.9%) ⏳Clarity: 46%
Retrace: -2.1% Bounce: 85.8% 41.1x 🚀 Parabolic
SAHARA is trading at 0.02438 spot and 0.02285 futures with an extreme bullish structure reading 94.1 to 5.9 in favor of buyers across 48 bull signals against 3 bear out of 112 total. The counter-trend depth is 13 to 1 bullish. The spread at 88.2 percent with extreme conviction and a 41.1x bounce-to-retrace ratio in parabolic territory makes this one of the most one-sided structural reads possible. The retrace is minimal at negative 2.1 percent with an 85.8 percent bounce, meaning price has barely pulled back while rallying aggressively.
The internals are almost unanimously bullish. EMA reads 6 to 0 clean. Candlestick bias is 14 to 0 clean. Ichimoku sits at 10 to 2. Three soldiers patterns are 3 to 0. Star patterns 1 to 0. Pattern totals 4 to 0. Engulfing 1 to 0. Every structural pillar is aligned without meaningful opposition. Supply and demand zones at 1 supply versus 4 demand confirms bullish zone dominance.
The squeeze has FIRED on the futures side with bull momentum expanding upward at 50.15 percent bandwidth. That fired squeeze is releasing energy into an already parabolic trend.
Now the critical layer. The premium reads negative 6.4 percent with a Z-score of negative 9.4. That is an extraordinarily deep discount on futures versus spot. The yield calculation shows negative 7012 percent APY at negative 9.4 sigma, meaning futures traders are paying an extreme premium to be short or the futures market is pricing significant downside that spot is ignoring. The standard deviation at 0.656 percent reads volatile with the mean Z at negative 2.42 sigma in extreme territory. This premium dislocation is a structural warning embedded within an otherwise perfect bullish setup.
Volume adds another layer of complexity. Spot Z sits at 1.82 in strong territory while futures Z runs at 2.87 very high. The combined Z is 2.74 very high. The futures-to-spot ratio is 6.71x elevated with spot-to-futures dollar volume at 34.52 million versus 231.6 million. That means futures volume is dominating spot volume by nearly 7 to 1 in dollar terms. Directional flow reads bull dominant with whale buy signals and shorts liquidation active. Volume momentum is accelerating at negative 2.3. The bull-to-bear volume Z split at negative 3.58 versus negative 0.42 shows heavy volume but the negative signs on both sides indicate the participation structure is unusual.
The squeeze divergence flags the critical risk. It reads futures only trap. The futures squeeze has fired while spot has no squeeze active. Squeeze momentum on spot is expanding upward at 542.7 percent, but the structural divergence between spot and futures squeeze states means the energy release is happening in the leveraged market, not the real market.
The bull continuation case rests on the 48 to 3 counter dominance, the 13 to 1 deep read, the parabolic bounce structure, and the whale buy with shorts liquidation signals. If spot volume Z climbs above 2.0 confirming real participation while the premium dislocation begins normalizing from negative 9.4 sigma toward negative 3 sigma, the parabolic trend has structural legs. The fired futures squeeze releasing into bull momentum at 50.15 percent bandwidth would accelerate the move.
The trap reversal case is the critical risk scenario. The negative 9.4 sigma premium, the 6.71x elevated futures-to-spot ratio, and the futures only trap divergence all point to the same warning. The move is being driven disproportionately by leveraged futures activity rather than genuine spot accumulation. If the shorts liquidation cascade completes and the premium begins reverting from negative 9.4 sigma toward the mean, the parabolic structure could unwind rapidly. A premium normalization with futures volume collapsing while spot volume fails to sustain above 1.5 sigma would confirm the move was leverage-driven rather than accumulation-driven. The mean Z at negative 2.42 extreme reinforces that the current premium regime is statistically unsustainable.
Watch for premium reversion. As long as the premium stays below negative 5 sigma with the futures-to-spot ratio above 5x, the parabolic move is built on leveraged foundations. A premium shift toward negative 3 sigma with spot Z rising above 2.0 and the futures-to-spot ratio declining toward 3x would signal genuine spot participation catching up to futures, validating the trend. A premium snap back toward zero with spot volume fading while futures volume collapses would confirm the trap and trigger the unwind. The whale buy and shorts liquidation signals are real but they are happening in the leveraged market. Until spot confirms with matching participation, the structural perfection carries a leverage trap risk underneath.
More analysis on my profile.
🎯 Target: 1K Followers
👉 Follow: stingrayea
Tags: SAHARAUSDT, SAHARA, crypto, volume, squeeze, parabolic, premium, leverage, trap, futures, structure
SAHARAUSDT Forming Bullish MomentumSAHARAUSDT is forming a clear bullish momentum pattern, a classic bullish reversal signal that often indicates an upcoming breakout. The price has been consolidating within a narrowing range, suggesting that selling pressure is weakening while buyers are beginning to regain control. With consistent volume confirming accumulation at lower levels, the setup hints at a potential bullish breakout soon. The projected move could lead to an impressive gain of around 140% to 150% once the price breaks above the wedge resistance.
This falling wedge pattern is typically seen at the end of downtrends or corrective phases, and it represents a potential shift in market sentiment from bearish to bullish. Traders closely watching SAHARAUSDT are noting the strengthening momentum as it nears a breakout zone. The good trading volume adds confidence to this pattern, showing that market participants are positioning early in anticipation of a reversal.
Investors’ growing interest in SAHARAUSDT reflects rising confidence in the project’s long-term fundamentals and current technical strength. If the breakout confirms with sustained volume, this could mark the start of a fresh bullish leg. Traders might find this a valuable setup for medium-term gains, especially as the wedge pattern completes and buying momentum accelerates.
✅ Show your support by hitting the like button and
✅ Leaving a comment below! (What is your opinion about this Coin?)
Your feedback and engagement keep me inspired to share more insightful market analysis with you!
SAHARAUSDT Forming Bullish MomentumSAHARAUSDT is forming a clear bullish momentum pattern, a classic bullish reversal signal that often indicates an upcoming breakout. The price has been consolidating within a narrowing range, suggesting that selling pressure is weakening while buyers are beginning to regain control. With consistent volume confirming accumulation at lower levels, the setup hints at a potential bullish breakout soon. The projected move could lead to an impressive gain of around 140% to 150% once the price breaks above the wedge resistance.
This falling wedge pattern is typically seen at the end of downtrends or corrective phases, and it represents a potential shift in market sentiment from bearish to bullish. Traders closely watching SAHARAUSDT are noting the strengthening momentum as it nears a breakout zone. The good trading volume adds confidence to this pattern, showing that market participants are positioning early in anticipation of a reversal.
Investors’ growing interest in SAHARAUSDT reflects rising confidence in the project’s long-term fundamentals and current technical strength. If the breakout confirms with sustained volume, this could mark the start of a fresh bullish leg. Traders might find this a valuable setup for medium-term gains, especially as the wedge pattern completes and buying momentum accelerates.
✅ Show your support by hitting the like button and
✅ Leaving a comment below! (What is your opinion about this Coin?)
Your feedback and engagement keep me inspired to share more insightful market analysis with you!