Compare with The Sandbox
Key stats
Details
The Sandbox was initially just a mobile gaming smash hit created in 2011. In 2018, however, developer Pixowl scaled it up to become a blockchain-based game, and, two years later, native token SAND had its initial coin offering. The transition to blockchain technology was motivated by the ethos of wanting to provide creators with true ownership of their creations via NFTs, while also creating an in-game currency where users can play-to-earn and foster a self-sufficient economy.
Open interest
Liquidations
Long
Short
Price
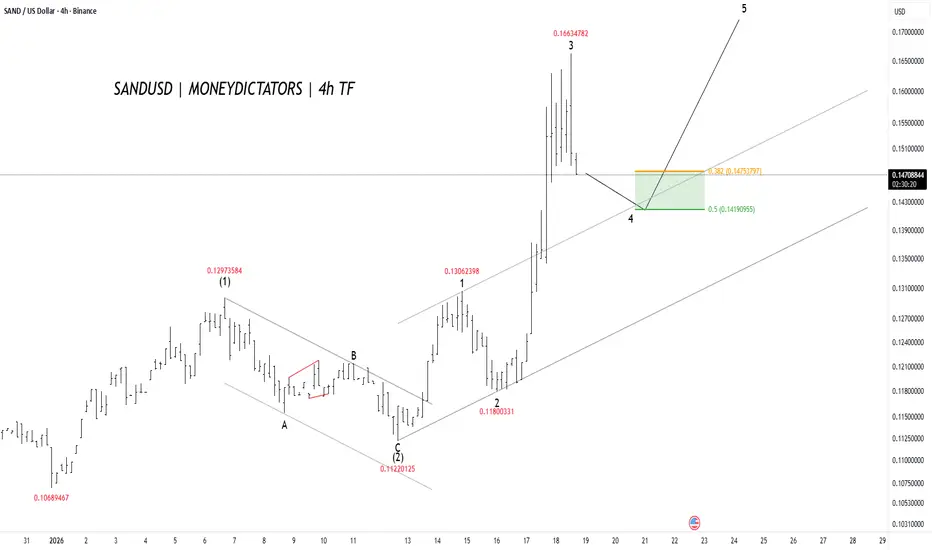
SANDUSD Is Ready for Up MoveSAND is in a strong uptrend on the 4-hour chart. Price has already completed waves 1, 2, and 3, where wave 3 was a sharp and powerful rise. Now the market is doing a small pullback (wave 4), which is normal after a strong move. This pullback is expected to stay in the green support zone around 0.142
Damn, thats bearish - SAND weekly update Aug 16 - 22thThe outlook for SAND does not appear favorable. From an Elliott Wave perspective, we are clearly in Minor Wave 2 after completing Wave 1 with strength. Within this Wave 2, the current structure shows us in the final stages of Minute Wave B. At current levels, this makes short positions particularly
Undecided. - SAND/SAN weekly update August 9 - 15thThe Sandbox (SAND) is currently advancing within a strongly aligned Elliott Wave structure. At the Cycle degree, price is in Wave 3; at both the Primary and Intermediate degrees, it is also in Wave 3; and at the Minute degree, the market is completing a smaller Wave 3. From a Smart Money Concepts pe
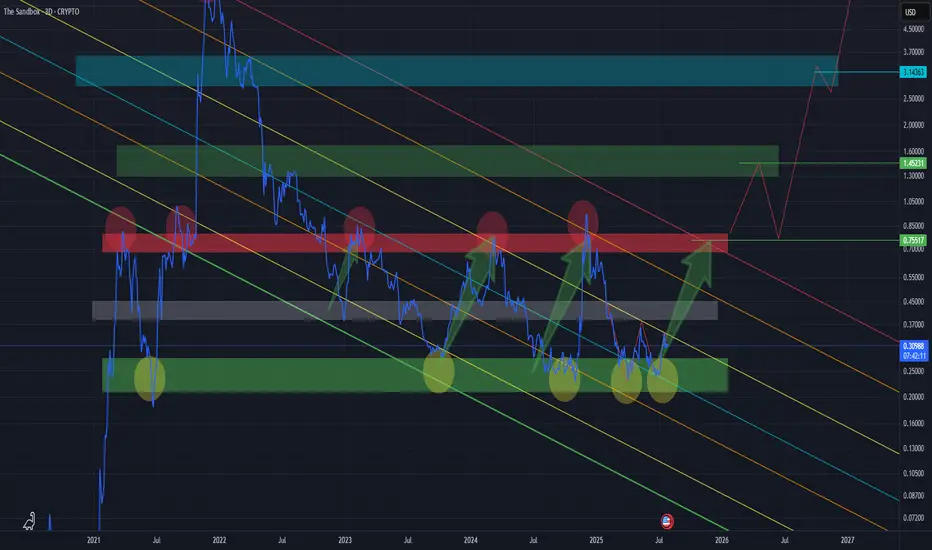
THE SANDBOX mid - to long - termThis might seem obvious to some, but it’s worth emphasizing —
📌 When analyzing charts like this, switch to a Line Chart instead of Candlesticks.
Why?
It filters out market noise and shake-outs
You can clearly see how price respects key zones and levels
Candles often distort the picture with wicks
SANDUSD targeting the 1day MA200 at 0.42000Sandbox / SANDUSD has entered a Channel Up structure ever since it double bottomed on Support A and crossed above the Falling Resistance.
Now it's supported by the 1day MA50 and is aiming at a new Higher High on the 1day MA200.
Target 0.42000
Follow us, like the idea and leave a comment below!!
Inverse Head and Shoulders in SAND: Breakout Ahead?Crypto markets are waking up and SAND is showing a strong inverse head and shoulders setup that could spark a fast rally. ADA is also forming a bullish triangle with macro factors like tax cuts and a US UK trade deal adding momentum. The mood is shifting and big moves could be just days away.
This
SANDUSD: The recovery back to 1.07350 has started.Sandbox (SANDUSD) is marginally bearish on its 1D technical outlook (RSI = 43.227, MACD = -0.001, ADX = 35.488) as it dropped below its 1D MA50 again. However, the breakout over its 5 month LH trendline has already happened and calls for a long term recovery. As you can see the Fibonacci retracement
See all ideas
Summarizing what the indicators are suggesting.
Oscillators
Neutral
SellBuy
Strong sellStrong buy
Strong sellSellNeutralBuyStrong buy
Oscillators
Neutral
SellBuy
Strong sellStrong buy
Strong sellSellNeutralBuyStrong buy
Summary
Neutral
SellBuy
Strong sellStrong buy
Strong sellSellNeutralBuyStrong buy
Summary
Neutral
SellBuy
Strong sellStrong buy
Strong sellSellNeutralBuyStrong buy
Summary
Neutral
SellBuy
Strong sellStrong buy
Strong sellSellNeutralBuyStrong buy
Moving Averages
Neutral
SellBuy
Strong sellStrong buy
Strong sellSellNeutralBuyStrong buy
Moving Averages
Neutral
SellBuy
Strong sellStrong buy
Strong sellSellNeutralBuyStrong buy
Displays a symbol's price movements over previous years to identify recurring trends.
Frequently asked questions
The current price of The Sandbox (SAND) is 0.04227 USD — it has fallen −1.49% in the past 24 hours. Try placing this info into the context by checking out what coins are also gaining and losing at the moment and seeing SAND price chart.
The current market capitalization of The Sandbox (SAND) is 124.17 M USD. To see this number in a context check out our list of crypto coins ranked by their market caps or see crypto market cap charts.
The Sandbox (SAND) trading volume in 24 hours is 13.02 M USD. See how often other coins are traded in this list.
The Sandbox price has fallen by −7.32% over the last week, its month performance shows a −16.35% decrease, and as for the last year, The Sandbox has decreased by −83.81%. See more dynamics on SAND price chart.
Keep track of coins' changes with our Crypto Coins Heatmap.
The Sandbox (SAND) reached its highest price on Nov 24, 2021 — it amounted to 8.63570 USD. Find more insights on the SAND price chart.
See the list of crypto gainers and choose what best fits your strategy.
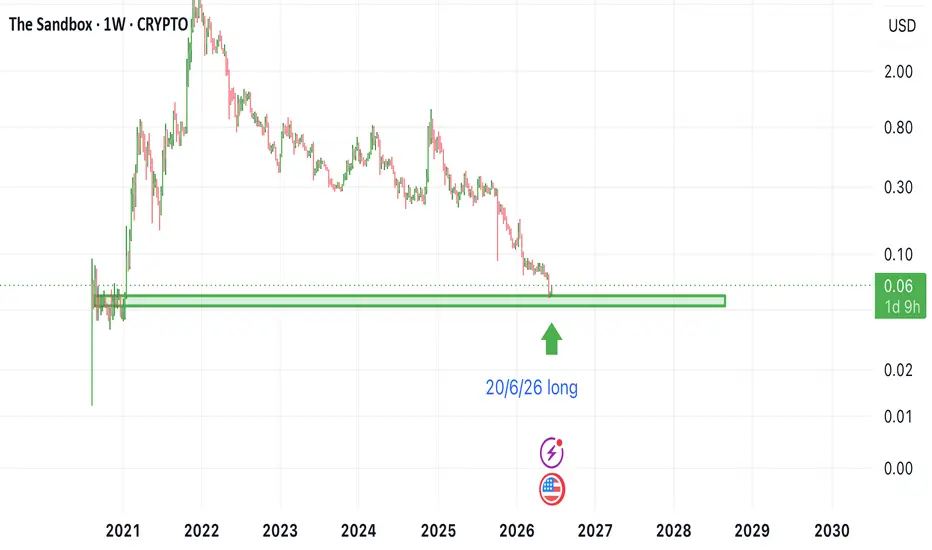
The Sandbox (SAND) reached the lowest price of 0.04087 USD on Jul 30, 2026. View more The Sandbox dynamics on the price chart.
See the list of crypto losers to find unexpected opportunities.
The current circulating supply of The Sandbox (SAND) is 3.00 B USD. To get a wider picture you can check out our list of coins with the highest circulating supply, as well as the ones with the lowest number of tokens in circulation.
The safest choice when buying SAND is to go to a well-known crypto exchange. Some of the popular names are Binance, Coinbase, Kraken. But you'll have to find a reliable broker and create an account first. You can trade SAND right from TradingView charts — just choose a broker and connect to your account.
Crypto markets are famous for their volatility, so one should study all the available stats before adding crypto assets to their portfolio. Very often it's technical analysis that comes in handy. We prepared technical ratings for The Sandbox (SAND): today its technical analysis shows the sell signal, and according to the 1 week rating SAND shows the sell signal. And you'd better dig deeper and study 1 month rating too — it's sell. Find inspiration in The Sandbox trading ideas and keep track of what's moving crypto markets with our crypto news feed.
The Sandbox (SAND) is just as reliable as any other crypto asset — this corner of the world market is highly volatile. Today, for instance, The Sandbox is estimated as 1.51% volatile. The only thing it means is that you must prepare and examine all available information before making a decision.
You can discuss The Sandbox (SAND) with other users in our public chats, Minds or in the comments to Ideas.