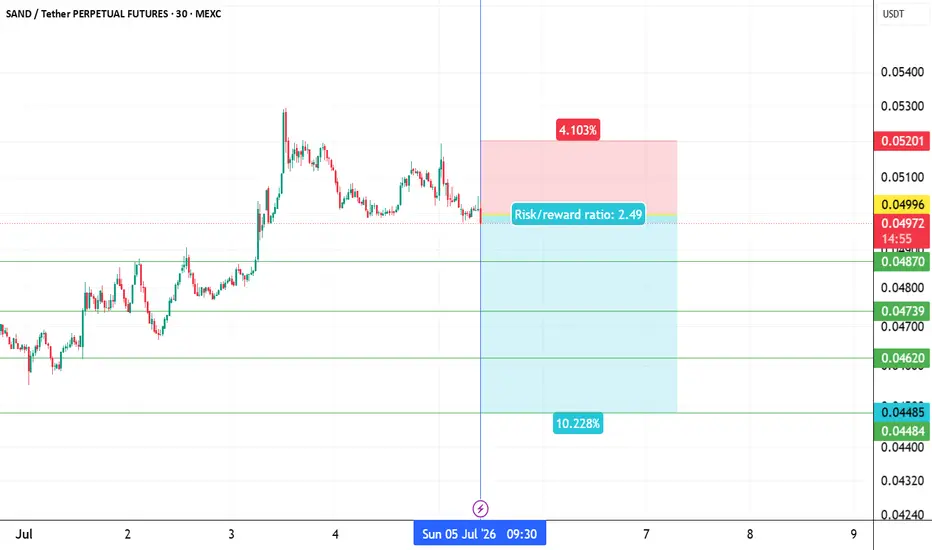
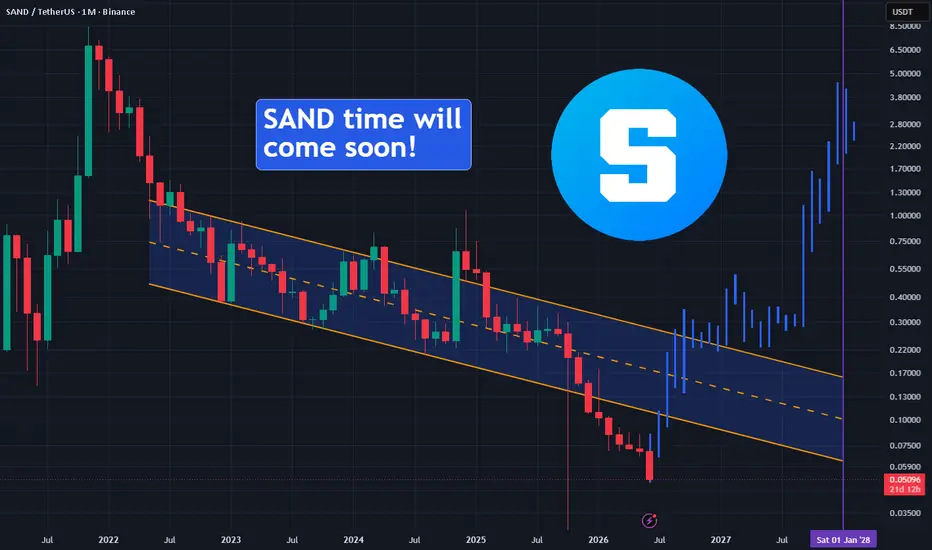
sandusdt longInstructions:
Entry point: yellow
Stop loss: red
Take profit: green
👉Leverage x 5-10-20 for crypto
👉Leverage x 20-50-100 for commodities, stocks, indices, and forex
👉Margin 1-5% max.
Always practice risk and money management.
Invest a maximum of 5% on any trade or across all your trades.
Invest on
SAND at macro floor: base recovery toward $0.0575The Macro Picture 🗺️
SAND unwound the whole move from the $0.086 spring high down to the $0.045 macro floor, and price is now basing just above it. The steep selling has given way to a flat, sideways grind — the shape of a bottom being built, not a trend still breaking.
The Setup ⚙️
The Accumulat
SANDUSDT - Bear Flag Breakdown – Breakdown or Bounce?📊🔍 Technical Analysis
💵 Coin: OMXSTO:SAND #SAND
⏳ Time Frame: 6H
📉 Pattern: 🚩 Bear Flag
🎯 Potential Move: 8–15% 📊 (depending on breakout confirmation)
---
📚🚩 Pattern Explanation – Bear Flag
The chart is currently forming a 🚩 Bear Flag, a classic bearish continuation pattern that typically d
sandusdt short Roddy01-SIGNALSPROVIDERInstructions:
Entry point: yellow
Stop loss: red
Take profit: green
👉Leverage x 5-10-20 for crypto
👉Leverage x 20-50-100 for commodities, stocks, indices, and forex
👉Margin 1-5% max.
Always practice risk and money management.
Invest a maximum of 5% on any trade or across all your trades.
Invest on
SANDUSDT | Continue the Downtrend | Week, 01-05,2026Hello Traders!
I'm sorry I've been too busy to update in a timely manner.
After setting a trailing stop on BINANCE:VETUSDT , we have the opportunity to sell another coin BINANCE:SANDUSDT
Following the same approach, place a sell stop order and wait for the market’s response after the signal
SAND Ultimate BottomIt's difficult to predict the ultimate bottom of an Altcoin, but it seems that SAND has finally reached it! With BTC'D having been in a downtrend since June 2025 and expected to drop to 38% or below before 2028, altcoins could shift to be bullish as explained here:
SAND, similar to related altcoin
SANDUSDT - Demand Zone – Accumulation or Final Breakdown?On the 1-Week (1W) timeframe, SAND has been in a long-term downtrend since reaching its peak around $8.48 during the 2021 bull market. For more than four years, the price structure has consistently formed Lower Highs (LH) and Lower Lows (LL), confirming a dominant macro bearish trend.
📍 Price is no
Sandusst longInstructions:
Entry point: yellow
Stop loss: red
Take profit: green
👉Leverage x 5-10-20 for crypto
👉Leverage x 20-50-100 for commodities, stocks, indices, and forex
👉Margin 1-5% max.
Always practice risk and money management.
Invest a maximum of 5% on any trade or across all your trades.
Invest on
$SANDUSDT BUY SETUP CSE:SAND is building momentum, as you can see on the chart there are several BOS to the upside indicating that buyers are really showing interest in this coin.
A continued buying opportunity is spotted on 4H Demand Zone around $0.0775.
All necessary readings are clearly show on the chart.
PLEASE AP
See all ideas
Summarizing what the indicators are suggesting.
Oscillators
Neutral
SellBuy
Strong sellStrong buy
Strong sellSellNeutralBuyStrong buy
Oscillators
Neutral
SellBuy
Strong sellStrong buy
Strong sellSellNeutralBuyStrong buy
Summary
Neutral
SellBuy
Strong sellStrong buy
Strong sellSellNeutralBuyStrong buy
Summary
Neutral
SellBuy
Strong sellStrong buy
Strong sellSellNeutralBuyStrong buy
Summary
Neutral
SellBuy
Strong sellStrong buy
Strong sellSellNeutralBuyStrong buy
Moving Averages
Neutral
SellBuy
Strong sellStrong buy
Strong sellSellNeutralBuyStrong buy
Moving Averages
Neutral
SellBuy
Strong sellStrong buy
Strong sellSellNeutralBuyStrong buy
Displays a symbol's price movements over previous years to identify recurring trends.