SANDUSDT Forming Falling WedgeSANDUSDT is forming a clear falling wedge pattern, a classic bullish reversal signal that often indicates an upcoming breakout. The price has been consolidating within a narrowing range, suggesting that selling pressure is weakening while buyers are beginning to regain control. With consistent volume confirming accumulation at lower levels, the setup hints at a potential bullish breakout soon. The projected move could lead to an impressive gain of around 40% to 50% once the price breaks above th
In-depth trading ideas
Will $SAND hit Previous ATH?OMXSTO:SAND Price Prediction 2026: The Sandbox Doubles in 15 Days, Is a 20x Rally Next? 🚀
#SAND price is up ~100% in 15 days after a 99.60% crash from its Nov 2021 ATH of $8.4876 to $0.03251. Here's my full SAND technical analysis, fundamental analysis and funding data.
SAND Technical Analysis:
✅ SAND filled our 2nd Accumulation Zone ($0.049–$0.032)
✅ SAND price is 95% up from the zone
✅ Same 2021 base that triggered a 29,000% SAND rally
✅ SAND/USDT testing the breakout trendline
SAND Macro
SAND/USDT — Key Technical StructureSAND/USDT — Key Technical Structure | Breakout & Retest Setup in Focus
The Sandbox (SAND) is the native utility and governance token of The Sandbox, a blockchain-based ecosystem focused on gaming, digital ownership and creator-driven virtual experiences. SAND is used across the ecosystem for transactions, digital assets and governance, with a maximum supply of 3 billion tokens.
From a fundamental perspective, The Sandbox continues to develop beyond its original gaming model. Its Sandbox 3.0 st
SANDUSDT Wedge Breakout: The Lagging Giant Awakens?SANDUSDT Daily: Breaking the Wedge, But Playing Catch-Up
The SANDUSDT daily chart perfectly captures the "lagging altcoin" narrative you mentioned. While Bitcoin and some large caps have been consolidating or recovering, SAND was trapped in a brutal downtrend since April. However, the chart is now flashing a strong reversal signal: a falling wedge breakout.
The Wedge Breakout Structure
The falling wedge (marked by the two converging black trendlines) is a classic bullish reversal pattern. The pr
SANDUSDT Forming Falling WedgeSANDUSDT is forming a clear falling wedge pattern, a classic bullish reversal signal that often indicates an upcoming breakout. The price has been consolidating within a narrowing range, suggesting that selling pressure is weakening while buyers are beginning to regain control. With consistent volume confirming accumulation at lower levels, the setup hints at a potential bullish breakout soon. The projected move could lead to an impressive gain of around 40% to 50% once the price breaks above th
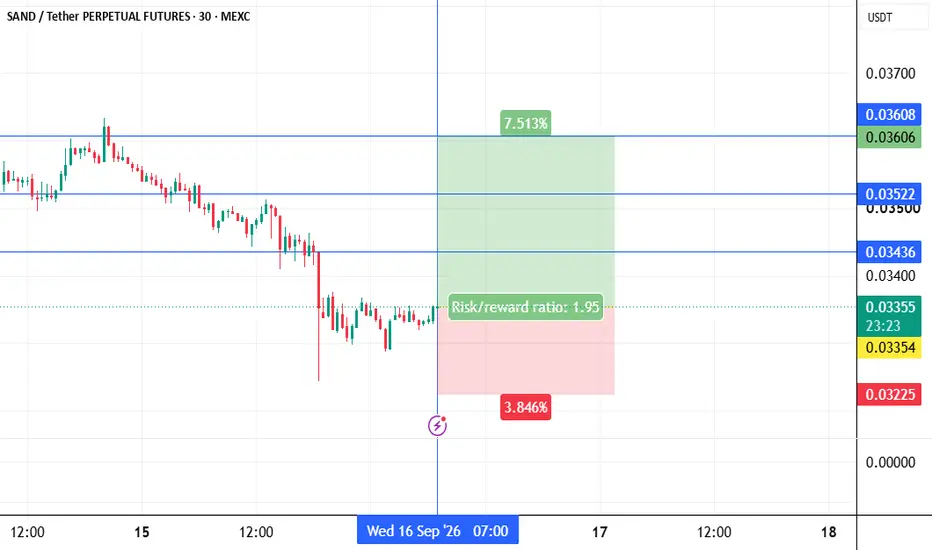
Sandusdt longINSTRUCTIONS TO READ AND TO FOLLOW:
Entry point: yellow
Stop loss: red
Take profit: green or blue
👉Leverage x 5-10-20 for crypto
👉Leverage x 20-50-100 for commodities, stocks, indices, and forex
👉Margin 1-5% max:
This limits your maximum loss to 5% and guarantees that you retain 95% of your portfolio in the event of a stop-loss.
🔥🔥🔥🔥🔥🔥🔥🔥🔥🔥🔥🔥🔥🔥
ALWAYS PRACTICE RISK AND MONEY MANAGEMENT:
🔥🔥🔥🔥🔥🔥🔥🔥🔥🔥🔥🔥🔥🔥
👉Invest a maximum of 5% on any trade or across all your trades.
Invest only what you can aff
sandusdt longInstructions:
Entry point: yellow
Stop loss: red
Take profit: green or blue
👉Leverage x 5-10-20 for crypto
👉Leverage x 20-50-100 for commodities, stocks, indices, and forex
👉Margin 1-5% max.
Always practice risk and money management.
Invest a maximum of 5% on any trade or across all your trades.
Invest only what you can afford to lose, as no one is in control of the market.
👉Our analyses are primarily based on:
breakouts: two trend lines (ascending and descending) and a line indicating a hor
SAND/USDT (4h) Testing a Descending Channel BreakoutSAND/USDT is trading inside a well-defined descending channel on the 4H chart, with price continuing to form lower highs and lower lows after the previous rejection from the $0.049–$0.050 area.
Price recently bounced from the lower channel boundary near $0.0365–$0.0370 and is now testing the upper descending resistance around $0.0385–$0.0390. A confirmed breakout and hold above this trendline could trigger a bullish recovery toward the key resistance around $0.0418, with a stronger continuation
sandusdt longInstructions:
Entry point: yellow
Stop loss: red
Take profit: green
👉Leverage x 5-10-20 for crypto
👉Leverage x 20-50-100 for commodities, stocks, indices, and forex
👉Margin 1-5% max.
Always practice risk and money management.
Invest a maximum of 5% on any trade or across all your trades.
Invest only what you can afford to lose, as no one is in control of the market.
👉Our analyses are primarily based on:
breakouts: two trend lines (ascending and descending) and a line indicating a horizontal
SAND Holds Support, Higher Next ?The Sandbox (SAND) is currently retracing into an important area of technical confluence, with price testing the Value Area Low (VAL) alongside the 0.618 Fibonacci retracement. This combination creates a strong support zone where buyers have historically shown interest, making it a key level to monitor for the next directional move.
A successful defence of this support would indicate that the recent pullback is a healthy correction rather than the beginning of a broader downtrend. Holding above
SAND/USDT H2: Growth potential amid the broader market🎯 TP1: $0.045730 (+7.55%) │ TP2: $0.046795 (+10.05%)
🛑 SL: $0.038634 (-9.14%) │ R/R: 1 : 1.1
⚠️ SL is placed beyond the nearest candle tails to reduce the risk of accidental triggering
FUNDAMENTAL BACKGROUND
SAND is showing recovery after a recent unauthorized emission incident, which the project team has contained. The absence of significant fresh project news shifts focus to the broader crypto market, where a positive sentiment persists due to ETF inflows and BTC/ETH growth. The Fear & Greed
SAND/USDT H1: Resistance at the upper range boundary🎯 TP1: $0.041135 (+1.52%) │ TP2: $0.040500 (+3.04%)
🛑 SL: $0.042925 (-2.77%) │ R/R: 1 : 1.1
⚠️ SL is placed beyond the nearest candle tails to reduce the risk of accidental triggering
FUNDAMENTAL BACKGROUND
SAND is trading without its own catalysts, following the general sentiment of the crypto market. After the sharp rise in BTC and ETH on 19.08.2026, altcoins received a short-term boost, but the backdrop is now mixed. US inflation on 13.08.2026 was softer than expected, but caution remains. N
SANDUSDT - Bear Flag Pattern, Breakdown or a False Breakdown?📊 Technical Analysis
💰 Coin: BCBA:SAND #SAND
⏳ Time Frame: 4H
📐 Pattern: 🐻 Bear Flag (Bearish Continuation Pattern)
---
🐻📉 Bear Flag Pattern
📌 This chart shows a 🐻 Bear Flag, a bearish continuation pattern that forms after a sharp decline (🚨 Flagpole), followed by a gradual upward movement within an 📈 Ascending Channel, representing a ⏸️ consolidation phase.
⚠️ As long as the price remains inside this channel, selling pressure is still likely to dominate the market.
🔻 A valid bearish c
SAND at macro floor: base recovery toward $0.05102SAND has spent the summer grinding down from $0.085 into the low $0.04 range, and price has now stopped falling right on its structural floor. This is where accumulation setups live — a market that has stopped bleeding and started building a base.
The Macro Picture 🗺️
The broader trend has been a steady downtrend, but the sell-off has lost momentum near the lows. Local High / Decision sits overhead at $0.05453 with Macro Resistance far above at $0.08650, while price coils just above the level t
SAND at macro floor: base recovery toward $0.0575The Macro Picture 🗺️
SAND unwound the whole move from the $0.086 spring high down to the $0.045 macro floor, and price is now basing just above it. The steep selling has given way to a flat, sideways grind — the shape of a bottom being built, not a trend still breaking.
The Setup ⚙️
The Accumulation Zone 🟢
$0.045–0.0475 is where sellers ran out. The macro floor has absorbed every push lower, and this is the demand shelf a recovery works from.
The Decision Point 🔴
$0.05453 (Local High) is the
SANDUSDT - Bear Flag Breakdown – Breakdown or Bounce?📊🔍 Technical Analysis
💵 Coin: OMXSTO:SAND #SAND
⏳ Time Frame: 6H
📉 Pattern: 🚩 Bear Flag
🎯 Potential Move: 8–15% 📊 (depending on breakout confirmation)
---
📚🚩 Pattern Explanation – Bear Flag
The chart is currently forming a 🚩 Bear Flag, a classic bearish continuation pattern that typically develops after a strong impulsive decline (📉 Flagpole). Following the sharp drop, price enters a temporary upward consolidation within a rising channel (🏳️ Flag).
📍 At the moment, price remains inside
SANDUSDT | Continue the Downtrend | Week, 01-05,2026Hello Traders!
I'm sorry I've been too busy to update in a timely manner.
After setting a trailing stop on BINANCE:VETUSDT , we have the opportunity to sell another coin BINANCE:SANDUSDT
Following the same approach, place a sell stop order and wait for the market’s response after the signal candle appears.
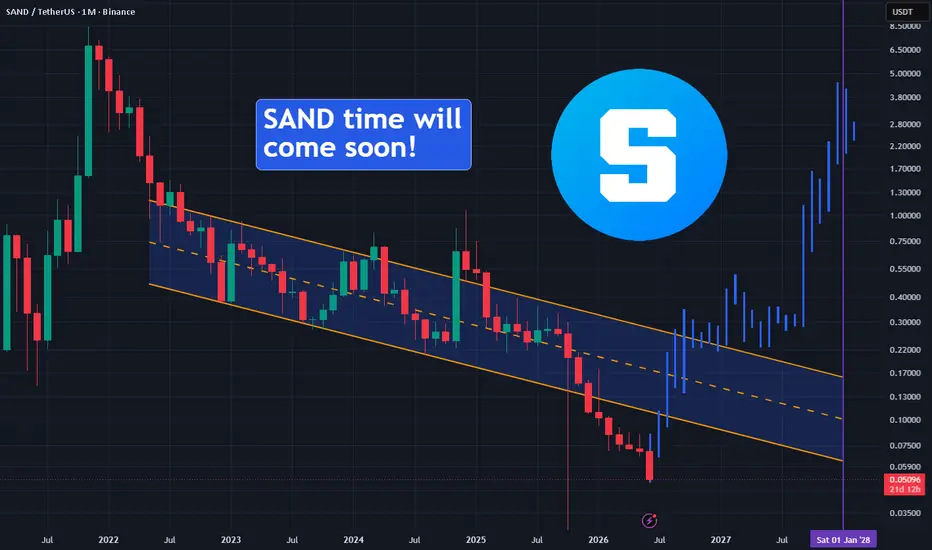
SAND Ultimate BottomIt's difficult to predict the ultimate bottom of an Altcoin, but it seems that SAND has finally reached it! With BTC'D having been in a downtrend since June 2025 and expected to drop to 38% or below before 2028, altcoins could shift to be bullish as explained here:
SAND, similar to related altcoins, has been in a long-term parallel channel that has been going on since early 2022 making all most investors either exchasted or liquidated. This channel is showing us the upper and lower bands, and
SANDUSDT - Demand Zone – Accumulation or Final Breakdown?On the 1-Week (1W) timeframe, SAND has been in a long-term downtrend since reaching its peak around $8.48 during the 2021 bull market. For more than four years, the price structure has consistently formed Lower Highs (LH) and Lower Lows (LL), confirming a dominant macro bearish trend.
📍 Price is now approaching a highly significant historical support area, namely the $0.0415 – $0.0300 demand zone (yellow box). This area previously served as an early accumulation zone before the massive rally th