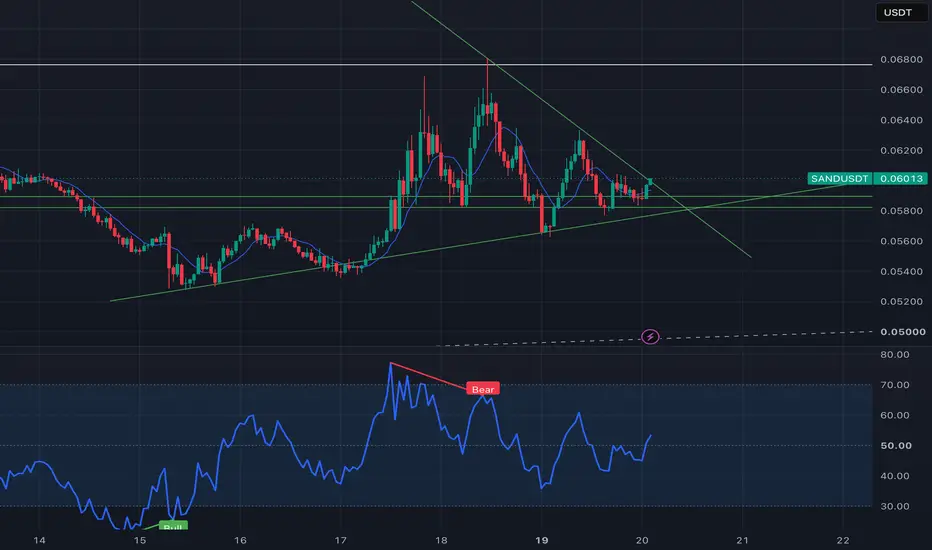
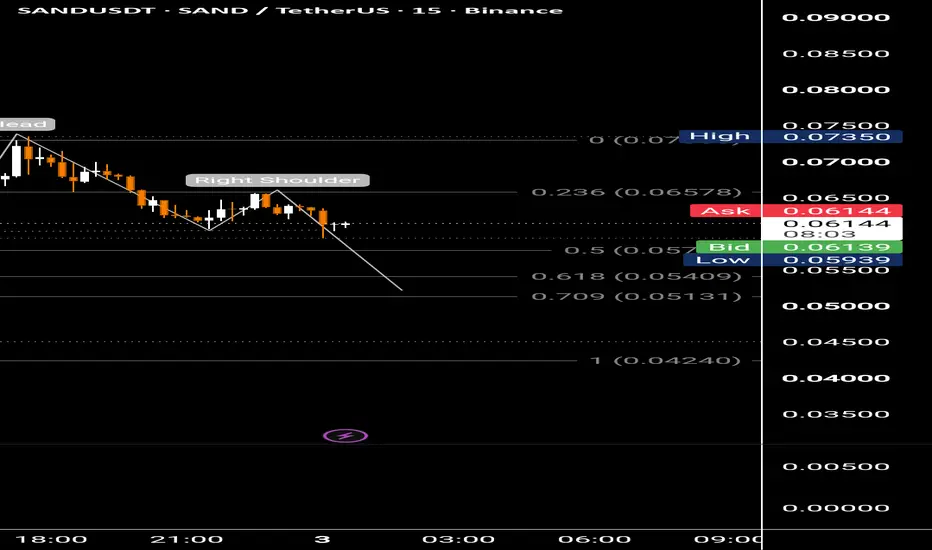
SAND is really bearish (4H)The SAND correction started from the point where we placed the red arrow on the chart and marked it as START.
This is a strong and prolonged downward move, and it does not seem to be over yet. Interestingly, even the upward waves within this correction have been bending downward, which indicates strong selling pressure.
From the point where we placed the green arrow, Wave A of the correction was completed, and Wave B started. However, due to the selling pressure, it failed to make any signific
The Sandbox / Tether USD
No trades
No trades
In-depth trading ideas
SAND ForecastBINANCE:SANDUSDT Trade Rationale
The overall structure suggests a potential early-stage bullish trend. After an initial upward move, price has entered a minor correction. On the lower timeframe, we can also identify an upward move followed by a moderate pullback.
Bearish momentum appears to be weakening, and the presence of Hidden Bullish Divergence (HD) adds further support to the bullish scenario.
We expect a potential continuation to the upside once the correction is complete. For now, pa
SANDUSDT: Trendline Rejection, Retest 0.045 Before the Next Leg 🏝️ SAND knocked on the door of its old trendline with record volume, the door stayed shut, so we prepare for knock number two.
Fundamentals: The Sandbox is a community-driven platform where creators monetize voxel assets and games, SAND is its utility token. Market cap $163.38M with 98% of supply circulating, +34.3% over 30 days, open interest +10.7% in 7 days while perp funding sits at -0.0415% per 8h.
SAND technicals:
On the weekly, price broke out of the lows on the biggest volume spike of
sand boomThe Sandbox is showing notable strength even as the broader crypto market, including Bitcoin, is experiencing significant upward pressure. The SAND price jumped 7.40% to $0.0715, breaking above the $0.065 to $0.068 zone with a sharp surge in trading volume. Moreover, the technicals suggest the rally is likely to maintain a strong uptrend. The move raises a key question for traders: has the Sandbox price started a larger trend reversal, or is this another short-term rally?
Volume Surge! Can It Escape the Bottom Range?
Hello, traders.
Nice to see you all.
If you follow me, you can always receive new updates quickly.
Have a great day today as well.
-------------------------------------
The price has shown a consistent downtrend over a long period of time.
During this upward move, we need to monitor whether the price can rise above:
1st target: 0.08666
2nd target: 0.13303
To achieve this, the price must remain above 0.05135 and break above the short-term resistance zone at 0.06927 - 0.07789.
If the pri
$SAND Important BREAKOUT, Here's what to doOn the daily timeframe, SAND is seemingly bullish.
My rule in technical analysis, once a trend, always a trend, even if you break from above or below of it. As you can see, we have went for a solid break-out because of the massive pump we have seen, retested the resistance, solid resistance of ours. Rejected from there.
The thing is we have had a retest after the breakout which led to a strong pump, that increases the chance for us to be bullish on CRYPTOCAP:SAND , not think that this is just
$SAND is finally breaking out of its long accumulation zone. ThOMXSTO:SAND is finally breaking out of its long accumulation zone.
The key now is not just the breakout. We need to see price hold above the breakout zone and turn this area into support.
If SAND holds above this level, the structure looks much stronger and I expect the upside move to continue. The chart is showing a clear shift after a long period of accumulation and compression.
Breakout → hold above the zone → retest → continuation.
If the breakout holds, I’ll be watching the higher resi
SAND — Key Technical Structure | Watching for the Next Confirm**SAND — Key Technical Structure | Watching for the Next Confirmed Move**
The Sandbox (SAND) is the utility token of The Sandbox, a blockchain-based virtual world focused on digital ownership, gaming and creator-driven experiences. SAND is used across the ecosystem for transactions, digital assets and participation in its virtual economy.
From a fundamental perspective, SAND remains closely connected to the broader Web3 gaming, metaverse and digital-ownership sectors. Future ecosystem adoption
SANDUSDT is losing MOMENTUM, Broken below trendlinneAfter the clear breakout of the uptrend, and a retest with a rejection, we believe that we have confirmed a bearish scenario for SAND
Expecting for the price to keep on moving downwards to the next support, which is our first target. 0.07 which is a psychological support.
Invalidation is a break-out from above of the 0.075 resistance.
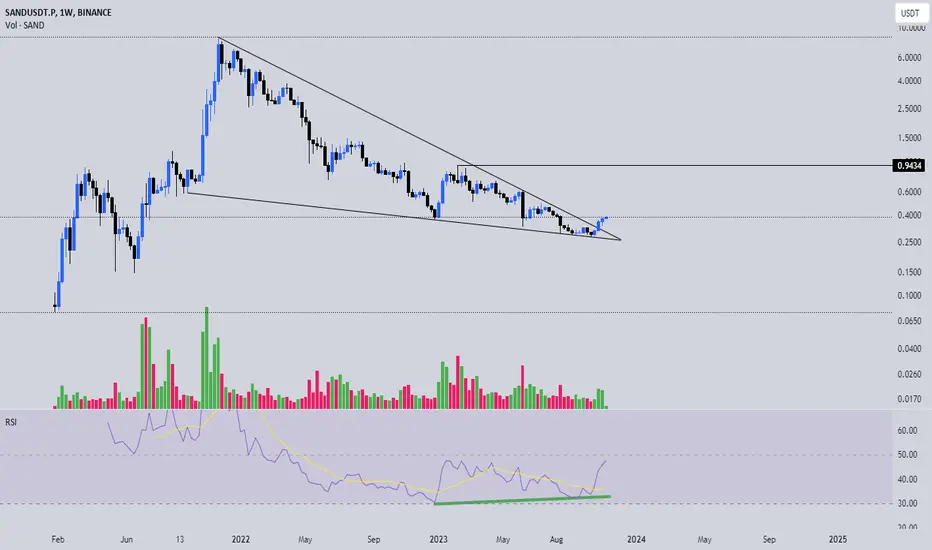
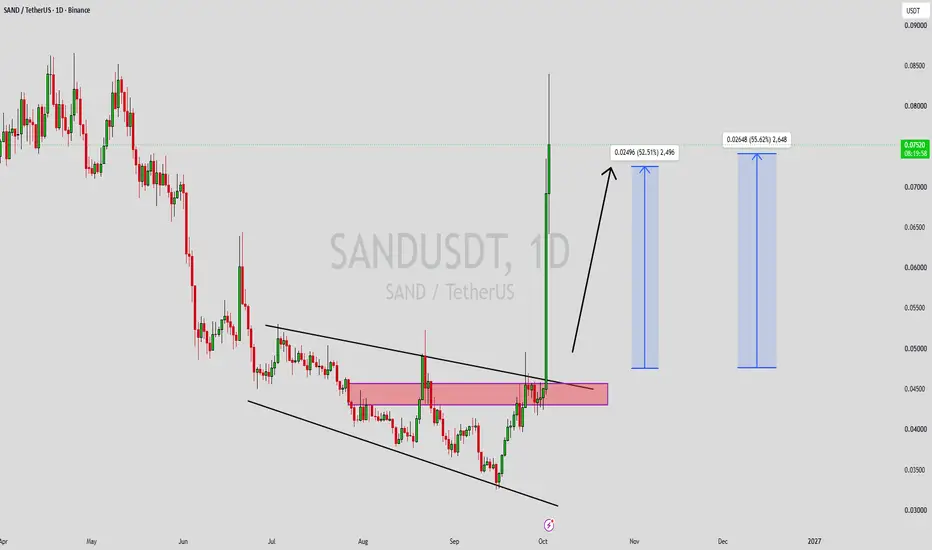
SANDUSDT Forming Falling WedgeSANDUSDT is forming a clear falling wedge pattern, a classic bullish reversal signal that often indicates an upcoming breakout. The price has been consolidating within a narrowing range, suggesting that selling pressure is weakening while buyers are beginning to regain control. With consistent volume confirming accumulation at lower levels, the setup hints at a potential bullish breakout soon. The projected move could lead to an impressive gain of around 40% to 50% once the price breaks above th
Will $SAND hit Previous ATH?OMXSTO:SAND Price Prediction 2026: The Sandbox Doubles in 15 Days, Is a 20x Rally Next? 🚀
#SAND price is up ~100% in 15 days after a 99.60% crash from its Nov 2021 ATH of $8.4876 to $0.03251. Here's my full SAND technical analysis, fundamental analysis and funding data.
SAND Technical Analysis:
✅ SAND filled our 2nd Accumulation Zone ($0.049–$0.032)
✅ SAND price is 95% up from the zone
✅ Same 2021 base that triggered a 29,000% SAND rally
✅ SAND/USDT testing the breakout trendline
SAND Macro
SAND/USDT — Key Technical StructureSAND/USDT — Key Technical Structure | Breakout & Retest Setup in Focus
The Sandbox (SAND) is the native utility and governance token of The Sandbox, a blockchain-based ecosystem focused on gaming, digital ownership and creator-driven virtual experiences. SAND is used across the ecosystem for transactions, digital assets and governance, with a maximum supply of 3 billion tokens.
From a fundamental perspective, The Sandbox continues to develop beyond its original gaming model. Its Sandbox 3.0 st
SANDUSDT Wedge Breakout: The Lagging Giant Awakens?SANDUSDT Daily: Breaking the Wedge, But Playing Catch-Up
The SANDUSDT daily chart perfectly captures the "lagging altcoin" narrative you mentioned. While Bitcoin and some large caps have been consolidating or recovering, SAND was trapped in a brutal downtrend since April. However, the chart is now flashing a strong reversal signal: a falling wedge breakout.
The Wedge Breakout Structure
The falling wedge (marked by the two converging black trendlines) is a classic bullish reversal pattern. The pr
SAND/USDT (4h) Testing a Descending Channel BreakoutSAND/USDT is trading inside a well-defined descending channel on the 4H chart, with price continuing to form lower highs and lower lows after the previous rejection from the $0.049–$0.050 area.
Price recently bounced from the lower channel boundary near $0.0365–$0.0370 and is now testing the upper descending resistance around $0.0385–$0.0390. A confirmed breakout and hold above this trendline could trigger a bullish recovery toward the key resistance around $0.0418, with a stronger continuation
SAND Holds Support, Higher Next ?The Sandbox (SAND) is currently retracing into an important area of technical confluence, with price testing the Value Area Low (VAL) alongside the 0.618 Fibonacci retracement. This combination creates a strong support zone where buyers have historically shown interest, making it a key level to monitor for the next directional move.
A successful defence of this support would indicate that the recent pullback is a healthy correction rather than the beginning of a broader downtrend. Holding above