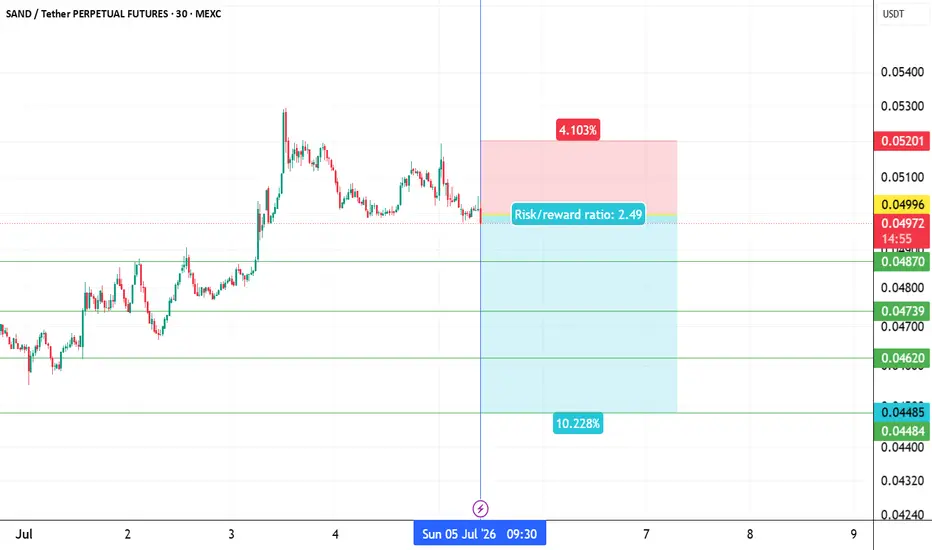
sandusdt longInstructions:
Entry point: yellow
Stop loss: red
Take profit: green
👉Leverage x 5-10-20 for crypto
👉Leverage x 20-50-100 for commodities, stocks, indices, and forex
👉Margin 1-5% max.
Always practice risk and money management.
Invest a maximum of 5% on any trade or across all your trades.
Invest only what you can afford to lose, as no one is in control of the market.
👉Our analyses are primarily based on:
breakouts: two trend lines (ascending and descending) and a line indicating a horizontal breakout.
chart patterns: shoulders and head, triangle parttern, elliott impulse, etc etc.
We don't always have the time to track them at all times or to represent them visibly, given the numerous signals, the number of channels to manage, and especially because of the often rapid pace of market movements.
indicators: We associate at least two indicators with this technique.
👉Depending on the circumstances, we use specific indicators, often setting 3 or more take profit levels.
👉Indeed, there are good days in trading and also bad days. No one can promise to win every trade, and like all traders worldwide, we also experience stop-loss orders. However, we win more than we lose and remain positive.
👉You can close the position before or after the take profit orders indicated by the green lines if you are personally satisfied; the same applies to stop loss orders.
👉We must stay positive, clear-headed, and humble.
we cannot provide all instructions or all trades here on this channel.
Good luck to us all, and may God guide us. Amen.
In-depth trading ideas
SAND at macro floor: base recovery toward $0.0575The Macro Picture 🗺️
SAND unwound the whole move from the $0.086 spring high down to the $0.045 macro floor, and price is now basing just above it. The steep selling has given way to a flat, sideways grind — the shape of a bottom being built, not a trend still breaking.
The Setup ⚙️
The Accumulation Zone 🟢
$0.045–0.0475 is where sellers ran out. The macro floor has absorbed every push lower, and this is the demand shelf a recovery works from.
The Decision Point 🔴
$0.05453 (Local High) is the gate. Reclaiming it on a daily close flips the local structure bullish and opens the path to the $0.0575 measured-move target.
The Roadmap 🛣️
Hold the $0.045 floor → reclaim $0.05453 → extend toward $0.0575. Invalidation is a clean daily close below $0.045 — that voids the accumulation thesis.
This is a textbook DCA Accumulation Zone setup: scale in across the $0.045–0.0475 band and let the base do the work.
More setups in profile.
#SAND #TheSandbox #crypto #trading #TA #3Commas #DCA
SANDUSDT - Bear Flag Breakdown – Breakdown or Bounce?📊🔍 Technical Analysis
💵 Coin: OMXSTO:SAND #SAND
⏳ Time Frame: 6H
📉 Pattern: 🚩 Bear Flag
🎯 Potential Move: 8–15% 📊 (depending on breakout confirmation)
---
📚🚩 Pattern Explanation – Bear Flag
The chart is currently forming a 🚩 Bear Flag, a classic bearish continuation pattern that typically develops after a strong impulsive decline (📉 Flagpole). Following the sharp drop, price enters a temporary upward consolidation within a rising channel (🏳️ Flag).
📍 At the moment, price remains inside this flag structure and continues to trade below the major 📉 descending resistance trendline, indicating that 🐻 sellers still maintain control of the broader market trend.
⚠️ As long as price remains within the flag and fails to break above resistance with strong buying volume, the probability of bearish continuation remains elevated.
---
🔴🐻 Bearish Scenario (Primary)
The bearish outlook remains valid if price fails to reclaim the upper boundary of the 🚩 Bear Flag and breaks below the lower support trendline.
📉 A confirmed breakdown accompanied by increasing selling volume would suggest that 🐻 sellers have regained momentum, opening the door for further downside toward the key support area around 🎯 0.0448, with additional downside potential if support fails to hold.
✅ Bearish Confirmation
❌ Rejection from the upper Bear Flag resistance.
📉 Breakdown below the lower support trendline.
📊 Increasing bearish volume during the breakout.
🎯 Initial target around 0.0448, with lower targets possible if bearish momentum strengthens.
📈 Estimated Probability: 🔴 75%
---
🟢🐂 Bullish Scenario (Alternative)
The bullish scenario becomes valid only if 🐂 buyers successfully break above the Bear Flag resistance and sustain price action above the breakout level.
🚀 A strong breakout supported by increased buying volume would invalidate the 🚩 Bear Flag pattern and could trigger a short-term relief rally toward the next resistance zone.
⚠️ However, the broader market structure will remain cautious until price also breaks above the major 📉 descending trendline resistance overhead.
✅ Bullish Confirmation
✔️ Clean breakout above the Bear Flag resistance.
📈 Strong bullish volume confirmation.
🔄 Successful retest of the breakout level as support.
🎯 Potential continuation toward the upper descending trendline resistance.
📈 Estimated Probability: 🟢 25%
---
⚠️📌 Conclusion
Although price is attempting to recover, the overall market structure remains 🐻 bearish.
🚩 The Bear Flag pattern continues to signal a potential continuation of the previous downtrend unless 🐂 buyers invalidate the setup with a decisive breakout.
🧠 Traders should wait for confirmation before entering positions, as ⚠️ false breakouts are common within Bear Flag formations.
📊 Trade the confirmation, not the prediction.
---
#SAND #SANDUSDT #Crypto 🚀 #CryptoTrading 📈 #TechnicalAnalysis 📊 #TradingView #BearFlag 🚩 #Bearish 🐻 #PriceAction #Binance #Altcoins #Support #Resistance #TrendAnalysis #ChartPattern #CryptoAnalysis #Trading #Breakdown #MarketStructure #TradingSignals #CryptoMarket #TradingSetup #MarketAnalysis 📉🔥
sandusdt short Roddy01-SIGNALSPROVIDERInstructions:
Entry point: yellow
Stop loss: red
Take profit: green
👉Leverage x 5-10-20 for crypto
👉Leverage x 20-50-100 for commodities, stocks, indices, and forex
👉Margin 1-5% max.
Always practice risk and money management.
Invest a maximum of 5% on any trade or across all your trades.
Invest only what you can afford to lose, as no one is in control of the market.
👉Our analyses are primarily based on:
breakouts: two trend lines (ascending and descending) and a line indicating a horizontal breakout.
chart patterns: shoulders and head, triangle parttern, elliott impulse, etc etc.
We don't always have the time to track them at all times or to represent them visibly, given the numerous signals, the number of channels to manage, and especially because of the often rapid pace of market movements.
indicators: We associate at least two indicators with this technique.
👉Depending on the circumstances, we use specific indicators, often setting 3 or more take profit levels.
👉Indeed, there are good days in trading and also bad days. No one can promise to win every trade, and like all traders worldwide, we also experience stop-loss orders. However, we win more than we lose and remain positive.
👉You can close the position before or after the take profit orders indicated by the green lines if you are personally satisfied; the same applies to stop loss orders.
👉We must stay positive, clear-headed, and humble.
we cannot provide all instructions or all trades here on this channel.
Good luck to us all, and may God guide us. Amen
SANDUSDT | Continue the Downtrend | Week, 01-05,2026Hello Traders!
I'm sorry I've been too busy to update in a timely manner.
After setting a trailing stop on BINANCE:VETUSDT , we have the opportunity to sell another coin BINANCE:SANDUSDT
Following the same approach, place a sell stop order and wait for the market’s response after the signal candle appears.
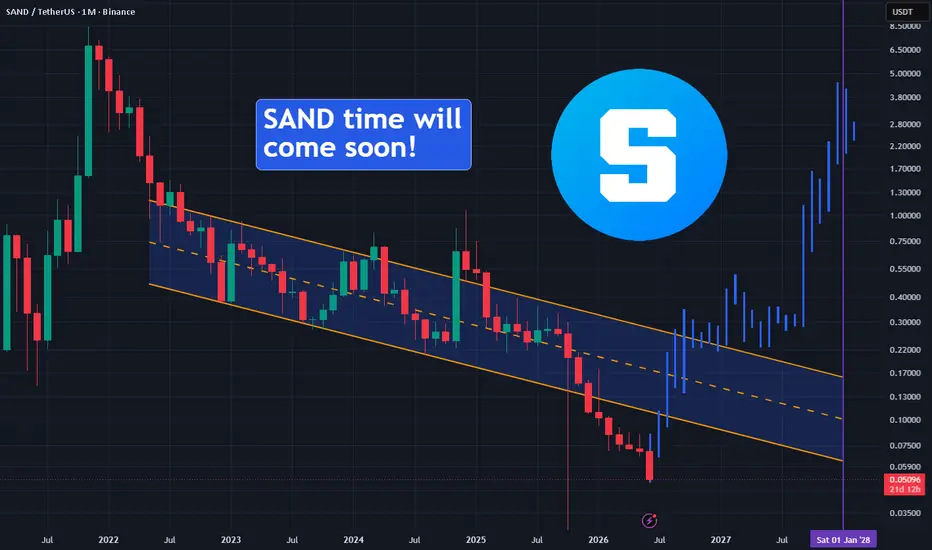
SAND Ultimate BottomIt's difficult to predict the ultimate bottom of an Altcoin, but it seems that SAND has finally reached it! With BTC'D having been in a downtrend since June 2025 and expected to drop to 38% or below before 2028, altcoins could shift to be bullish as explained here:
SAND, similar to related altcoins, has been in a long-term parallel channel that has been going on since early 2022 making all most investors either exchasted or liquidated. This channel is showing us the upper and lower bands, and has recently completed the flush part since January 2026.
Sand possible targets and timings are printed on the chart, but the ultimate target is $4.40, which will be hit in around 2028.
SANDUSDT - Demand Zone – Accumulation or Final Breakdown?On the 1-Week (1W) timeframe, SAND has been in a long-term downtrend since reaching its peak around $8.48 during the 2021 bull market. For more than four years, the price structure has consistently formed Lower Highs (LH) and Lower Lows (LL), confirming a dominant macro bearish trend.
📍 Price is now approaching a highly significant historical support area, namely the $0.0415 – $0.0300 demand zone (yellow box). This area previously served as an early accumulation zone before the massive rally that sent SAND up thousands of percent during the last market cycle.
---
🔍 Pattern Analysis
📉 Macro Downtrend Structure
The primary structure currently visible consists of:
✅ Repeated Lower Highs (LH)
✅ Repeated Lower Lows (LL)
✅ Declining volume and volatility over time
✅ Price revisiting a multi-year support level
⚠️ This indicates that the broader trend remains bearish until a confirmed structural reversal occurs.
---
🏗️ Potential Long-Term Accumulation Zone
The $0.0415 – $0.0300 area can be viewed as:
🟡 A historical demand zone
🟡 The starting point of a major bullish expansion in the previous cycle
🟡 A zone likely to attract long-term investors
🟡 A potential accumulation area similar to the previous market cycle
💡 As long as this zone holds, the possibility of forming a long-term base remains intact.
---
🟢 Bullish Scenario
🚀 Primary Bullish Outlook
The bullish case becomes increasingly valid if:
✔️ Price remains above the $0.0415 – $0.0300 demand zone
✔️ Strong buying pressure emerges on the weekly timeframe
✔️ The first Higher Low (HL) forms after the prolonged downtrend
✔️ Price breaks above the nearest resistance zone around $0.065 – $0.10
📈 If this historical support successfully holds, potential rebound targets may include:
🎯 $0.10
🎯 $0.15
🎯 $0.25
🎯 $0.40
🚀 Should the altcoin market enter another strong cycle, a much larger recovery could become possible over the long term.
💪 Bullish Supporting Factors
✅ Multi-year historical support zone
✅ Oversold conditions on higher timeframes
✅ Attractive risk-to-reward profile for long-term investors
✅ Potential accumulation phase ahead of the next market cycle
---
🔴 Bearish Scenario
⚠️ Breakdown Risk
The bearish scenario would be confirmed if:
❌ A weekly candle closes below $0.0300
❌ Historical support fails to hold
❌ No significant buying interest appears within the demand zone
📉 If a breakdown occurs:
⚠️ Price could enter a downside price discovery phase
⚠️ Future support levels become much harder to identify due to limited historical trading activity below this area
⚠️ Market sentiment toward SAND could deteriorate further
🚨 A breakdown below a multi-year support zone is typically considered a strong bearish signal for the medium to long term.
---
🎯 Conclusion
📍 SAND is currently trading at one of the most critical price areas since its launch. The $0.0415 – $0.0300 zone represents the final major historical support that could potentially become a significant accumulation area before the next recovery phase.
⚖️ However, as long as the Lower High and Lower Low structure remains intact, investors should wait for confirmation of a trend reversal before assuming a market bottom has been established.
⏳ Price action over the coming weeks and months will likely determine whether this zone becomes:
🟢 The beginning of a new bullish cycle
or
🔴 The gateway to deeper downside movement
🔥 This area deserves close attention from both investors and traders, as it could become the key decision point for SAND's direction in the next market cycle.
#SAND #SANDUSDT #TheSandbox #Crypto #Cryptocurrency #Altcoin #Altcoins #TradingView #TechnicalAnalysis #PriceAction #SupportResistance #Accumulation #DemandZone #Bullish #Bearish #CryptoTrading #Binance #MarketStructure #LongTermInvesting #ChartAnalysis #CryptoMarket #Web3 #Metaverse #Investor #TradingSetup
Sandusst longInstructions:
Entry point: yellow
Stop loss: red
Take profit: green
👉Leverage x 5-10-20 for crypto
👉Leverage x 20-50-100 for commodities, stocks, indices, and forex
👉Margin 1-5% max.
Always practice risk and money management.
Invest a maximum of 5% on any trade or across all your trades.
Invest only what you can afford to lose, as no one is in control of the market.
👉Our analyses are primarily based on:
breakouts: two trend lines (ascending and descending) and a line indicating a horizontal breakout.
chart patterns: shoulders and head, triangle parttern, elliott impulse, etc etc.
We don't always have the time to track them at all times or to represent them visibly, given the numerous signals, the number of channels to manage, and especially because of the often rapid pace of market movements.
indicators: We associate at least two indicators with this technique.
👉Depending on the circumstances, we use specific indicators, often setting 3 or more take profit levels.
👉Indeed, there are good days in trading and also bad days. No one can promise to win every trade, and like all traders worldwide, we also experience stop-loss orders. However, we win more than we lose and remain positive.
👉You can close the position before or after the take profit orders indicated by the green lines if you are personally satisfied; the same applies to stop loss orders.
👉We must stay positive, clear-headed, and humble.
we cannot provide all instructions or all trades here on this channel.
Good luck to us all, and may God guide us. Amen.
$SANDUSDT BUY SETUP CSE:SAND is building momentum, as you can see on the chart there are several BOS to the upside indicating that buyers are really showing interest in this coin.
A continued buying opportunity is spotted on 4H Demand Zone around $0.0775.
All necessary readings are clearly show on the chart.
PLEASE APPLY PROPER RISK MANAGEMENT.
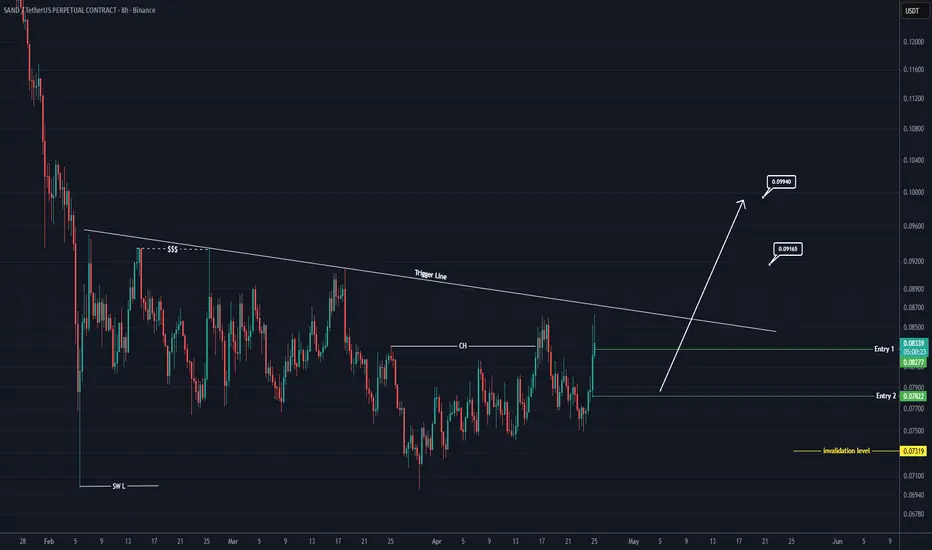
SAND Is Preparing for a Breakout (8H)A trigger line has formed on the chart, and the price below it is showing CP (consolidation pattern). We also have a bullish CH (Change of Character) on the chart, indicating the presence of buyers.
Two entry points have been marked on the chart, and positions should be entered using a DCA (Dollar-Cost Averaging) approach.
Additionally, a liquidity pool is visible above the chart, which may be swept soon.
The targets are marked on the chart, and at the first target, you should move to breakeven.
A daily candle closing below the invalidation level will invalidate this analysis.
If you have a coin or altcoin you want analyzed, first hit the like button and then comment its name so I can review it for you.
Do you also think SAND is bullish?
SANDUSDT 1D#SAND is trading within a rectangle pattern on the daily chart. Consider buying within the rectangle range. It is currently facing resistance from the daily SMA50 and the Ichimoku Cloud, which we believe it will break through soon. In case of a breakout above the rectangle, the upside targets are:
🎯 $0.1062
🎯 $0.1174
🎯 $0.1285
🎯 $0.1443
🎯 $0.1645
⚠️ Always remember to use a tight stop-loss and maintain proper risk management.
#SANDUSDT Weekly Analysis — Final Base Test Before Potential Rec🏖️ #SANDUSDT Weekly Analysis — Final Base Test Before Potential Recovery?
🗓 Published: May 10, 2025
📊 Timeframe: 1W | Exchange: Binance
Author: @HamadaMark
🔍 Market Structure Overview
SAND has returned to its historical accumulation zone near $0.28–$0.33 after completing multiple falling wedge breakdowns throughout 2023–2025.
Price is now attempting a bounce from a major demand floor, forming what could become a mid-cycle double bottom.
📌 Macro Setup Observations:
✅ Retest of strong horizontal demand zone (2021 launch base)
✅ Clear panic wick below structure, followed by bounce
✅ Similar formation to 2022 → 2023 reversal setup
✅ Weekly candle reclaiming 200MA zone
🟦 Critical Support Zone (Demand Base):
Main Support: $0.28–$0.33
Panic Level / Invalid Zone: Close below $0.27–$0.25 = breakdown risk
🔻 If this zone fails, structure targets as low as $0.10–$0.07 become possible
🎯 Upside Resistance Targets (if Bounce Confirmed):
TP1: $0.4678 – Previous wedge support → now resistance
TP2: $0.8344 – Multi-month range top
TP3: $1.3493 – Mid-cycle top (2022 level reclaim)
⚖️ Risk/reward becomes attractive above $0.35 reclaim with macro upside of 100–300%
🧠 Strategy Insight
• DCA is favorable in the blue box zone with tight SL
• Stronger confirmation = reclaim of red box ($0.47)
• Breakout traders should wait for weekly close above $0.47 + retest
💡 Volume + structure confirm this area remains a “make or break” pivot zone
🗣 What’s Next?
If $0.28–$0.33 holds and we reclaim the $0.47–$0.50 resistance box, SAND could attempt a multi-leg recovery into Q3–Q4.
If we lose $0.27, exit and reassess at deeper levels.
📢 SAND is at its most critical level in years — this isn’t the time to fade structure. If it holds, the upside opens fast.
we ask Allah reconcile and repay
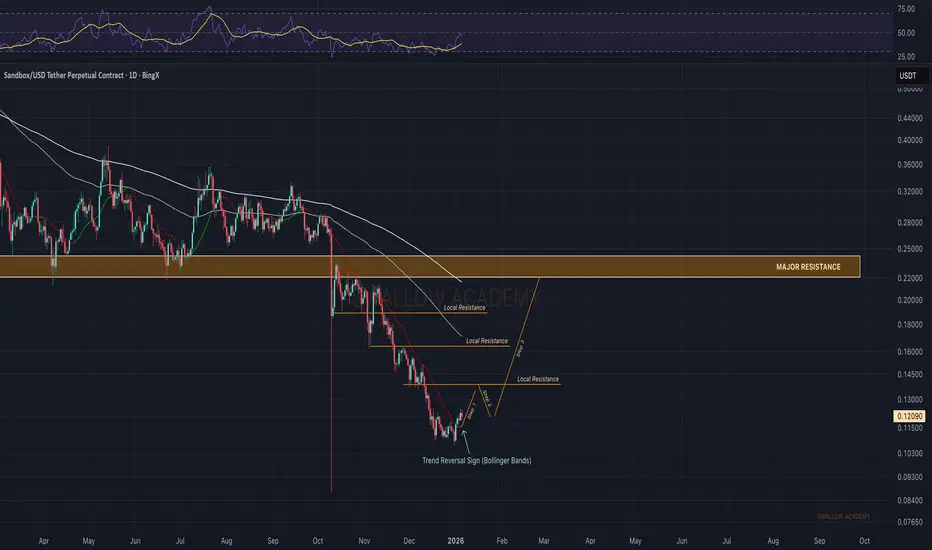
SandBox (SAND): Time For $0.22 | Bullish SignsSAND is starting to show early reversal signs here. We’re getting a clear reaction from the Bollinger Bands, where price pushed back above the middle band and the green line started to form. That’s the first sign that selling pressure is easing and buyers are trying to step in.
What matters next is structure. A clean BOS above the local resistance would confirm that this move is real and not just a bounce. If that happens, it opens the door for a proper long setup. Until then, this remains a potential reversal zone, not an entry yet.
Swallow Academy
Sandbox (SAND): Eyes on Middle Line of Bollinger BandsSAND is still under pressure and the price is riding the lower side of the Bollinger Bands, which tells us the short-term trend is still bearish. There’s no real relief bounce yet and sellers are clearly keeping control for now.
From here it’s simple: either we get a bounce from this lower BB area, or the price keeps sliding lower. If we do see a bounce, the key thing to watch will be a clean break back above the middle Bollinger line. That’s the level buyers need to reclaim to shift momentum and make a proper long idea valid. Until that happens, it’s still a wait for confirmation of the spot.
Swallow Academy
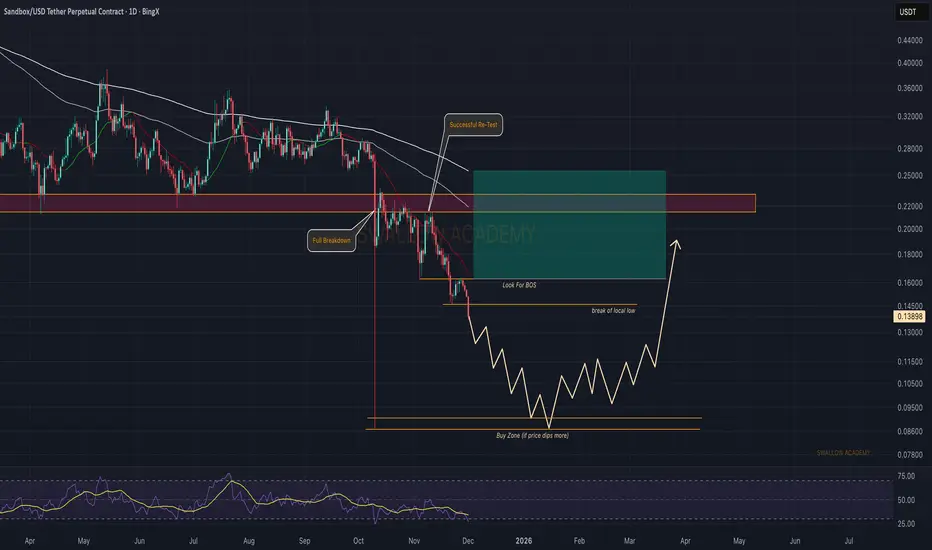
The Sandbox (SAND): Looking For Proper Break of Structure SAND broke down fully from its previous structure and is now sitting below all key levels. For now the chart still leans bearish, and as long as sellers keep control we might see one more push lower into the deeper buy zone. That’s where the better risk-to-reward setup would form.
If buyers manage to flip momentum earlier and give us a clean shift or reversal pattern above the current local low, we can look for a short-term bounce toward the upper resistance. Until then — patience. Let the chart show who’s in control.
Swallow Academy
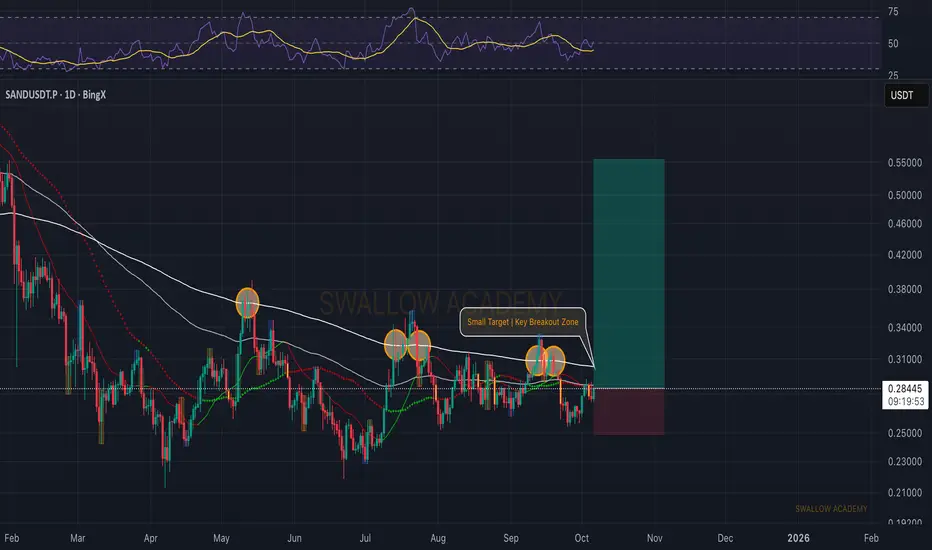
Sandbox (SAND): Expecting Breakout From 200EMASAND is again pushing into the breakout zone that has been rejecting price for months. This time, momentum looks better as buyers are holding higher lows and slowly pressing against EMAs. If we get a proper breakout here, that’s where the shift starts — continuation toward the $0.50 zone comes next.
Swallow Academy
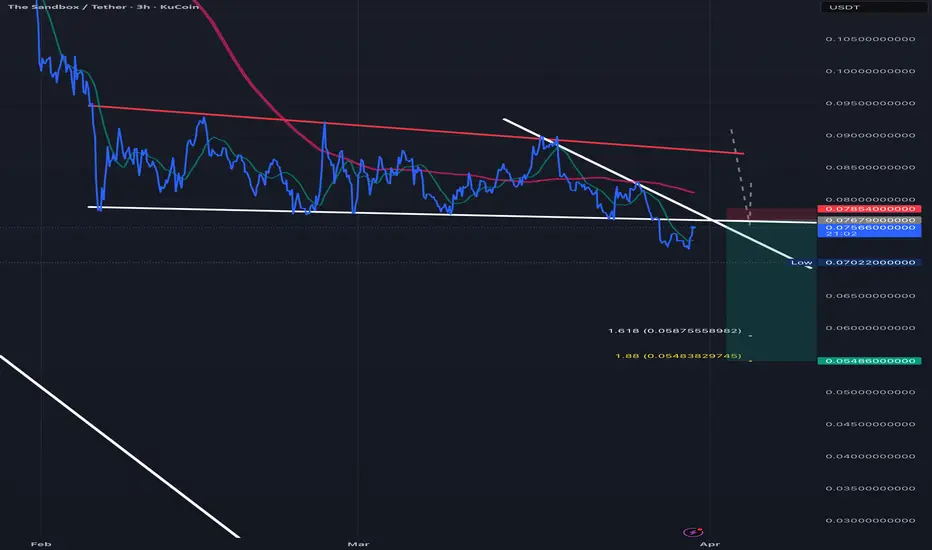
SAND/USDT- Descending Triangle (Bearish)
1. The Setup: "The Squeeze"
Imagine the price is bouncing between a **slanted ceiling** (the red line) and a **flat floor** (the white line).
* The ceiling is pushing the price down lower and lower.
* The floor is holding it up.
* Eventually, the space runs out, and the price has to "burst" through one of them.
### 2. The Move: "The Breakdown"
In your chart, the price just **fell through the floor**. This is the signal to sell (or "Short").
* Once a floor breaks, it usually becomes the new ceiling.
* The fact that the price is staying below that white line suggests the "break" is real.
### 3. The Plan (Your Strategy)
You are essentially betting that since the floor broke, the price will gravity-drop to the next level.
* **Entry:** You enter right after the floor breaks ($0.0755).
* **Stop Loss (The Emergency Brake):** You set a limit at **$0.0785**. If the price jumps back *above* the floor, the trade is "broken," and you get out to protect your money.
* **Take Profit (The Goal):** You are aiming for **$0.0548**. This is based on the height of the triangle—basically, the "energy" the move had before it broke.
### 4. Summary
* **Pattern:** Descending Triangle (Bearish).
* **Signal:** Candle closing below the white support line.
* **Goal:** Catch the drop to the Fibonacci targets
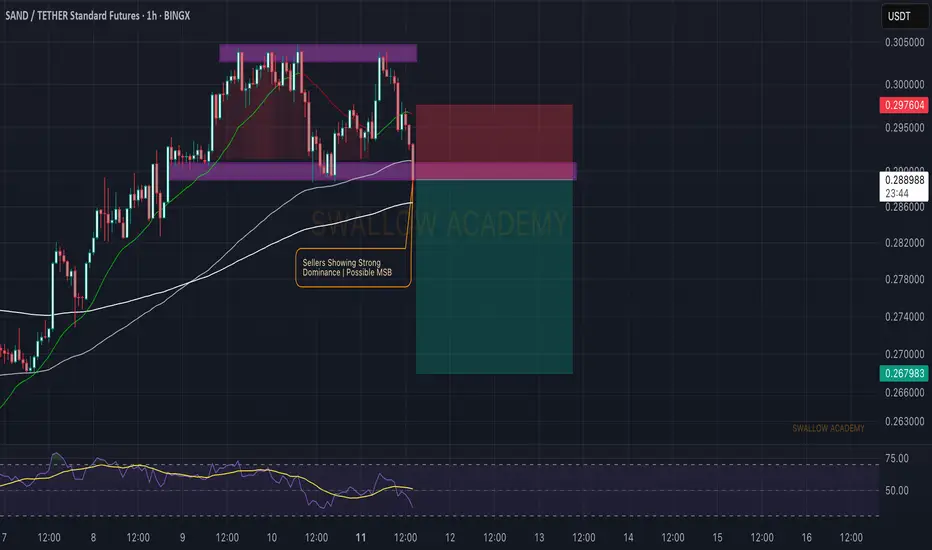
The Sandbox (SAND): Potential Breakdown + Downside Movement |SAND looks like it's about to break and form the MSB that might result in a good 7% downward movement for us.
Now the week has started pretty sharp on the markets, which seemed like a liquidity grab and more of a liquidity drag as well so what we are looking at is the MSB here, which might be a good short position to take here.
Swallow Academy
SShort
SAND: key levels to watch for a potential bounce todaySAND. Watching this one bleed and wondering who’s still shorting into the floor? According to the market, metaverse names are back in the “forgotten bags” corner, but funding and partnership headlines keep popping up in the background. Today price is sitting right on that big orange demand block that previously launched a solid bounce, so this level suddenly matters a lot again.
On the 4H chart SAND is hugging support with RSI buried in oversold territory and flattening out, which smells like seller exhaustion. Volume dried up on the last leg down, and every new low is getting less follow through, so I’m leaning toward a mean reversion pop rather than a fresh breakdown. My bias here is short term long, looking for a squeeze as late shorts get trapped.
My base case: hold this orange zone and we can easily see a push back toward the mid range around 0.083 then 0.086 where the previous volume shelf sits. If price closes decisively below the orange box, that invalidates the bounce idea and opens the door to the green zone lower for a deeper discount. I’m stalking entries inside or just above the orange area with tight risk below it, but I might be wrong and the market might want one more nasty flush before the real move up.
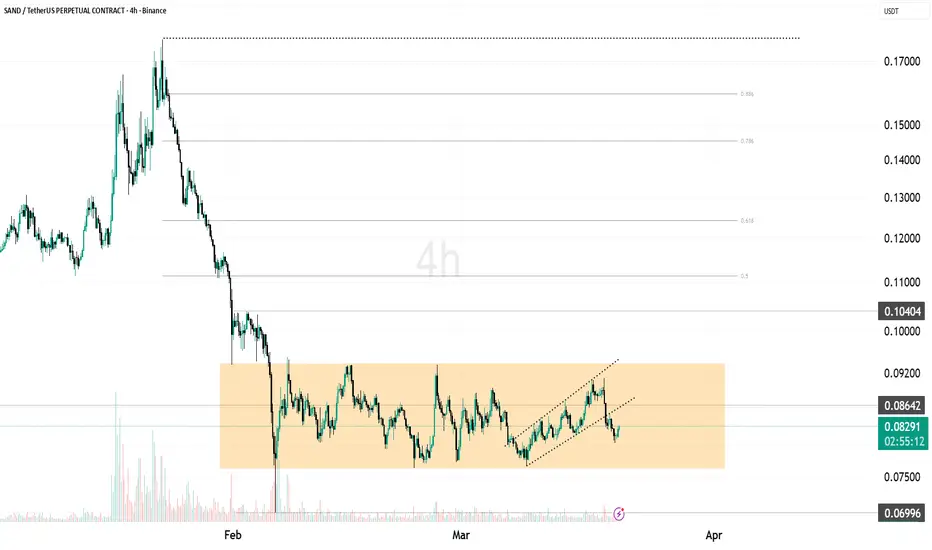
SAND Range-Bound ConsolidationSAND is currently trading inside a well-defined horizontal range, following a strong impulsive drop. Price has been consolidating between 0.077 – 0.094, showing clear signs of accumulation and indecision.
On the 4H timeframe, the market attempted a short-term ascending structure, but faced rejection near the range high (0.088–0.094) and is now rotating back toward the mid-range.
Key levels to watch
• 0.094: Range high / breakout level
• 0.086 – 0.088: Mid resistance
• 0.077: Range low support
• 0.069: Major support below range
Scenario outlook
• Bullish case:
A breakout above 0.094 would confirm range expansion and could push price toward 0.10+, with further upside if momentum builds.
• Bearish case:
Failure to reclaim the mid-range and continued weakness could send price back toward 0.077, and a breakdown below that level may lead to a move toward 0.069 support.
Animoca Brands: March 2026 OverviewSinnSeed | 🏢 Animoca Brands: March 2026 Overview
Last night I decided to look for promising and (so far) under-the-radar options in the altcoin space.
Sharing what I found:
Animoca Brands Corporation Limited — one of the companies in Web3, blockchain gaming, NFTs, metaverses, and digital property.
📍 Headquarters — Hong Kong (Cyberport)
📅 Founded in 2014 as a spin-off from mobile developer Animoca (est. 2011)
The company positions itself as a pioneer of the “digital property economy”, investing in projects where users receive real ownership rights through tokenization.
━━━━━━━━━━━━━━━
📖 Brief history and key milestones
▸ 2014–2017 — Focus on mobile games. Listed on ASX (Australian Securities Exchange) in 2015 under ticker AB1
▸ 2018 — Shift to blockchain and NFTs. Launch of blockchain games, investments in AI (Zeroth.ai — not very successful, before the “neural network” boom)
▸ 2019–2021 — Explosive growth: investments in The Sandbox, fundraising rounds (valuation 1–5.9 billion USD), partnerships with Binance, SoftBank, Square Enix
▸ 2020 — Delisting from ASX due to crypto activities and regulatory issues
▸ 2022 — Peak valuation ~6 billion USD, followed by correction during the bear market
▸ 2023–2025 — Portfolio expansion (600+ investments), brand licenses (WWE, MotoGP, Snoop Dogg), focus on RWA, AI and DeFi
▸ 2025–2026 — VASP license from VARA (Dubai, February 2026). Acquisition of SOMO (NFT). Partnerships: GROW Investment Group, Ethoswarm, Rootstock Labs
━━━━━━━━━━━━━━━
👥 Leadership
◾️ Yat Siu — Co-founder and Executive Chairman
Web3 pioneer, previously founded Outblaze (sold to IBM). Frequently speaks in media and at Davos
◾️ Evan Auyang — President
Oversees global operations
◾️ Robby Yung — CEO Investments
Focus on venture deals and crypto
The team emphasizes transparency, compliance, and institutional-grade growth.
━━━━━━━━━━━━━━━
🎯 Policy and approach
✦ Decentralization, users’ digital rights, ❗️regulatory adaptation (VASP license, preparation for going public) ❗️
✦ Ethics: involvement in charity (fundraising for Hong Kong fire victims via crypto)
✦ Investment policy: diversification across verticals — gaming, RWA, AI, DeFi, education — backing 600+ projects
━━━━━━━━━━━━━━━
⚙️ Technologies and key projects
🔹 Blockchain & NFT — The Sandbox (metaverse), Quidd (NFT marketplace)
🔹 Metaverses & games — The Sandbox, OliveX (fitness), REVV Motorsport
🔹 AI integration — Anichess (AI chess), Animoca Minds (agentic economy)
🔹 Education — Open Campus (EDU Chain), Moca Network (MOCA)
🔹 RWA & DeFi — Tokenization of real-world assets, institutional services
🔹 Other — Cross-chain liquidity, digital identity
━━━━━━━━━━━━━━━
💰 Key tokens (March 2026)
Animoca does not have a single “corporate” token, but owns/develops several native ones:
▫️ SAND (The Sandbox) — ~0.082 USD · MC ~241 million USD
▫️ MOCA (Mocaverse) — identity and rewards
▫️ REVV (motorsport games) — low activity
▫️ CHECK (Anichess) — staking and gaming
▫️ EDU (Open Campus) — ~0.10 USD · MC ~83 million USD
Top-10 from their portfolio by market cap: KITE · H (Humanity Protocol) · SAND · MON (Monad) · AXS · FLOW · EDU · SUPER · APE · RESOLV
📊 Digital assets balance: ~558 million USD on balance sheet + ~1.8 billion USD in reserves
━━━━━━━━━━━━━━━
🚀 Future plans: Nasdaq listing (the thing we’re interested in 💵)
Main plan — become a publicly traded company on Nasdaq via reverse merger with Currenc Group Inc. (Nasdaq: CURR, Singapore-based fintech with AI solutions).
📌 Announcement: November 3, 2025 — non-binding term sheet
📌 Structure: Currenc acquires 100% of Animoca via scheme of arrangement → combined company under Animoca Brands brand (Cayman Islands)
📌 Share distribution: Animoca shareholders ~95% / Currenc ~5%
📌 Goals: create the first publicly traded diversified digital assets company — access to the “trillion-dollar altcoin economy”, RWA, AI, DeFi
📌 Valuation: ~1 billion USD (November 2025; previously peaked at 6–10 billion)
📌 Timeline: expected closing in 2026 (some sources say Q3 2026)
Details on Animoca Brands Nasdaq listing plan via reverse merger with Currenc Group (as of March 2026)
The deal was announced on November 3, 2025 (press release from Currenc Group and Animoca Brands, plus Yat Siu’s letter to shareholders). This is a non-binding term sheet (non-obligatory memorandum of understanding), not a final agreement. As of March 2026 there are no public updates on completion — the process is still in preparation and awaiting approvals.
Key deal details (from official sources and SEC filings)
Structure: Reverse merger.
Currenc Group Inc. (Nasdaq: CURR) — already public — plans to acquire 100% of Animoca Brands Corporation Limited via scheme of arrangement (common for Australian/Hong Kong companies).
Post-merger share distribution:
Animoca Brands shareholders receive ~95% of the combined company.
Current Currenc shareholders — ~5%.
Name and structure: Combined company will operate under the Animoca Brands brand.
Legally — Cayman Islands exempted company (standard for many foreign Nasdaq issuers).
Ticker and exchange: Nasdaq (likely to retain CURR or change to a new one; exact ticker not determined at announcement).
Expected valuation: ~$1 billion (per media estimates and company statements in November 2025; final figure depends on exchange ratio, which is not yet set).
Deal objectives:
Create the world’s first publicly traded diversified digital assets conglomerate.
Give Nasdaq investors direct exposure to the growth of the “trillion-dollar altcoin economy” through a single instrument (DeFi, AI, NFTs, gaming, DeSci, RWA tokenization).
Leverage improving regulatory clarity in the US (Genius Act, stablecoin and tokenization rules).
Expand access to capital, institutional investors, and liquidity.
Expected closing timeline: 2026 (some sources — Q3 2026, others — by year-end).
⏳ Shareholder approvals from both sides
⏳ Regulatory approvals (SEC, Nasdaq, possibly ASIC)
⏳ Signing of definitive agreement
⏳ Due diligence and other conditions
🔄 Status as of March 2026: No news of delays, cancellation or completion. Process is ongoing (typical for such deals — 6 to 12+ months). If it had closed, there would be press releases and SEC filing updates. Currently still in due diligence, document preparation, and regulatory waiting phase.
About Currenc Group (Nasdaq: CURR)
Fintech company from Singapore (HQ), incorporated in Cayman Islands.
Specialization: AI solutions for financial institutions (digital payments, cross-border finance, e-wallets, data centers, AI-driven services).
Already public on Nasdaq since 2025 (or earlier).
CEO and Executive Chairman — Alexander Kong.
The deal is positioned as a “milestone” for Currenc — transition from fintech to full-fledged Web3/digital assets player.
🔖 Risks and context
Reverse merger — faster and cheaper path to listing than traditional IPO, but carries risks (less initial scrutiny, potential compliance issues).
Animoca previously delisted from ASX in 2020 due to crypto activities and regulatory concerns — now returning to a more “crypto-friendly” US platform.
If successful, it would significantly strengthen Animoca’s position in the institutional world, especially with RWA and AI integration.
If updates appear (e.g. definitive agreement or closing), they will be on animocabrands.com, investors.currencgroup.com or SEC EDGAR.
📝 Conclusion
Animoca Brands is a mature Web3 company with a strong portfolio, focus on institutionalization and regulatory compliance.
Nasdaq listing via reverse merger is a strategic move for growth in the post-crypto-winter era, but still in progress.
If the merger completes successfully — it could become a major catalyst for related tokens (SAND, EDU, MOCA) and the entire gaming / metaverse / RWA sector.
Overall, not a bad option to throw 50–150$ into these currently dirt-cheap coins and forget about them for a year, like a bill left in a winter jacket.
If something works out for them — it could give a nice boost.
SinnSeed
NFA. DYOR
SLong
SAND: ready for a bounce? key levels and targets ahead!SAND. Tired of watching this metaverse dinosaur bleed or ready for a bounce play? Recently the market has been talking again about metaverse projects waking up with new partnerships and updates, and altcoins are getting some rotation according to industry sources. If sentiment keeps improving, forgotten tokens like SAND can suddenly become the new toy of the week.
On the 4H chart price is sitting in a broad demand zone around 0.08 where buyers defended several times, with a fat volume node just above current price. RSI has bounced from oversold and is climbing above its average, so momentum is slowly shifting to the upside. If we punch through the local resistance around 0.09, there is a liquidity pocket up to roughly 0.10-0.105 where a short squeeze can easily unfold.
My base plan: look for longs on pullbacks into 0.082-0.085 with targets near 0.095 first, then 0.10+. ✅ Invalidation for me is a 4H close below 0.078 - that would reopen the road to 0.07 and I step aside or even think short. I might be wrong, but the risk-reward here finally looks interesting after weeks of slow bleeding.