SCR / SCRUSDT Long Setup | Breaker Block ReclaimMARKET ANALYSIS
SCR is currently reacting from a key technical area highlighted on the chart.
As long as the protected support zone remains intact, the bullish market structure remains valid and higher liquidity targets may continue to attract price action.
A breakdown below the invalidation level would weaken the current bullish scenario and require a reassessment of market conditions.
📍 Entry, Stop Loss and Take Profit levels are marked directly on the chart.
━━━━━━━━━━━━━━
⚠️ DISCLAIMER
This publication is provided solely for educational and market observation purposes.
Nothing contained in this analysis should be considered financial advice, investment advice, or a recommendation to buy or sell any financial instrument.
All trading and investment decisions remain solely the responsibility of the individual trader.
Always conduct your own research and apply proper risk management before entering any position.
━━━━━━━━━━━━━━
🎯 PARALOG
▪️Crypto Market Analysis
▪️BTC Futures Signals
▪️Bitcoin & Altcoin Market Analysis
Precision • Momentum • Timing
━━━━━━━━━━━━━━
Exchange: #MEXC Futures
#bitcoin #btc #crypto #futures #technicalanalysis
In-depth trading ideas
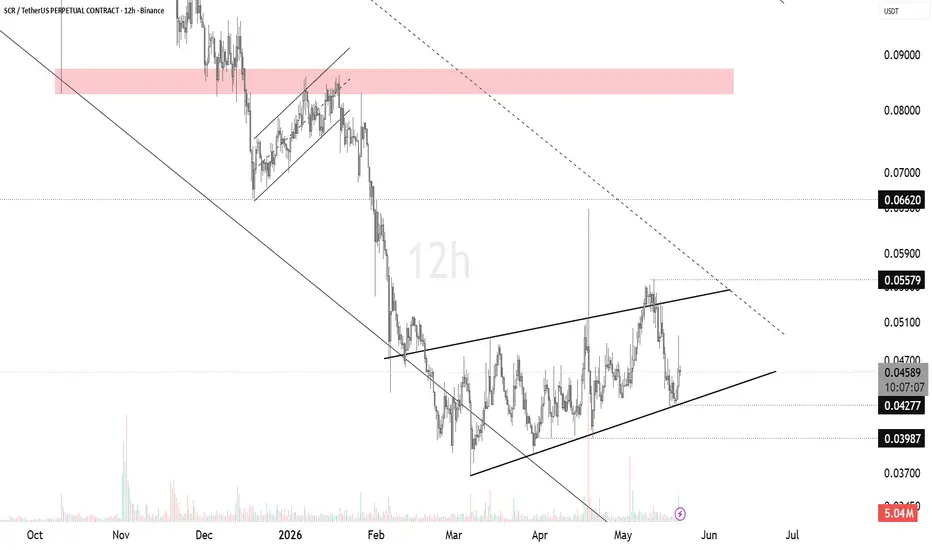
SCR Holding Ascending Structure After Sharp Selloff#SCR experienced a heavy breakdown earlier this year after rejecting from the major supply zone around 0.082 - 0.088, but price is now showing signs of stabilization inside a rising structure on the 12H timeframe.
The market recently reacted strongly from the ascending trendline near 0.042 - 0.043, which is currently acting as the key support zone. Buyers stepped in aggressively there, preventing further downside continuation.
At the same time, price still remains below the local resistance around 0.055 - 0.056, making this the key breakout level bulls need to reclaim for stronger continuation.
If SCR manages to hold the ascending support and break above the upper trendline resistance, the market could push toward:
0.055
0.066
Potentially revisit the higher supply zone near 0.082+
However, if support fails, the ascending structure would weaken and price could revisit the lower demand region around 0.040 again.
For now, SCR is trading inside a compression range, and the next breakout from this structure will likely decide the next major directional move.
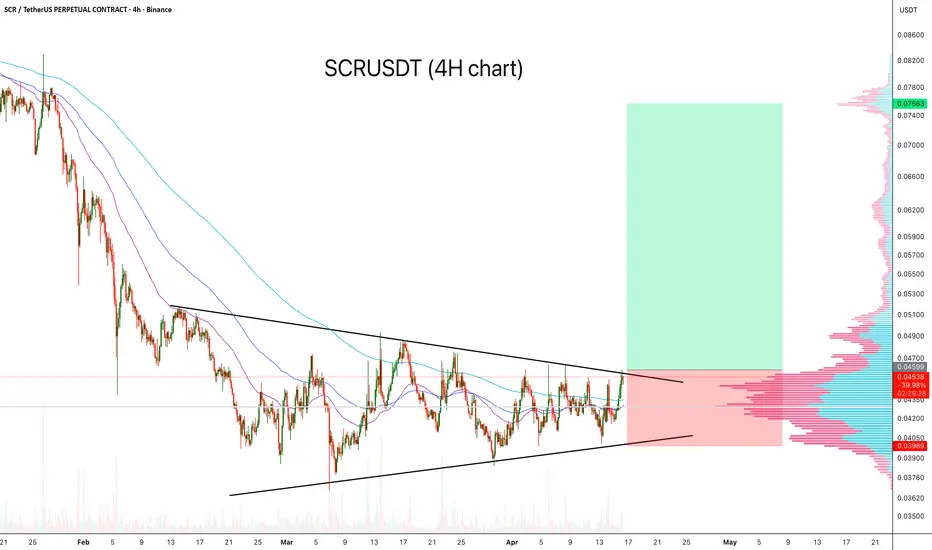
SCRUSDT 4H: Symmetrical Triangle Near BreakoutSCRUSDT has been trading inside a clear symmetrical triangle on the 4H timeframe following a prolonged downtrend. Price action shows consistent higher lows and lower highs, indicating volatility compression and an approaching expansion phase.
Currently, price is testing the upper trendline resistance while holding above short-term moving averages, suggesting early bullish momentum.
Key Points:
- Structure: Symmetrical triangle (continuation or reversal potential)
- Trend context: Downtrend → consolidation → possible reversal
- Volume profile shows a high-volume node around the current price, acting as a decision zone
- EMAs are beginning to flatten, signaling a shift from bearish to neutral
Trade Idea:
- Entry: Break and close above triangle resistance
- Stop Loss: Below the most recent higher low / triangle support (~0.0398)
- Target: 0.075+ (measured move & prior resistance zone)
Alternative Scenario:
If price fails to break resistance and loses support, expect a move toward the lower boundary and potentially continuation of the broader downtrend.
Cheers
Hexa
SCRUSDT 2D#SCR is moving inside a falling wedge pattern on the 2-day timeframe chart and is currently testing the wedge support line. If a successful bounce occurs, the short-term target is:
🎯 $0.205
And if the price breaks out above the wedge resistance, the potential upside targets are:
🎯 $0.248
🎯 $0.283
🎯 $0.318
🎯 $0.368
🎯 $0.431
⚠️ Always remember to use a tight stop-loss and maintain proper risk management.
SCR/USDTAfter spending over 150 days in consolidation, price has finally broken out of its downtrend and completed a clean retest of the breakout level. Momentum now favors the bulls, with the next target set at the previous major resistance, which also acts as a key flip zone. A sustained move above this level could open the path toward the $1.00 target.
Scroll Volume Breakout But... 280% Profits Potential (Easy)"Volume breakout but..." When there is a but, there is always a problem.
Scroll (SCRUSDT) is full green today with rising volume but, resistance is being faced in the form of MA200—not all is lost.
While resistance is being faced the bullish bias is already confirmed. The main low happened in April and a double-bottom in June. The double-bottom is what reveals a bullish bias on this chart. The bullish bias implies higher prices. So, even if resistance is being faced the market will move higher because when it moved lower support held nicely.
The support zone from 7-April wasn't even tested twice nor multiple times. There was no piercing, no wick lower simply a bounce and now higher prices. Buyers were present. Buyers are present now, prices are rising.
With this we know the bulls are on and we have SCRUSDT consolidating for more than five months, since March.
You can see the green space on the chart as the consolidation range.
Don't get me wrong, this is all good. It is good because the market is not moving lower. No new lows is a bullish signal. Always when the market is not dropping this is good. Here it is sideways but with a certain bullish bias.
Friendly reminder, bullish wave comes next.
Friendly reminder, buy and hold.
Thank you for reading.
Namaste.
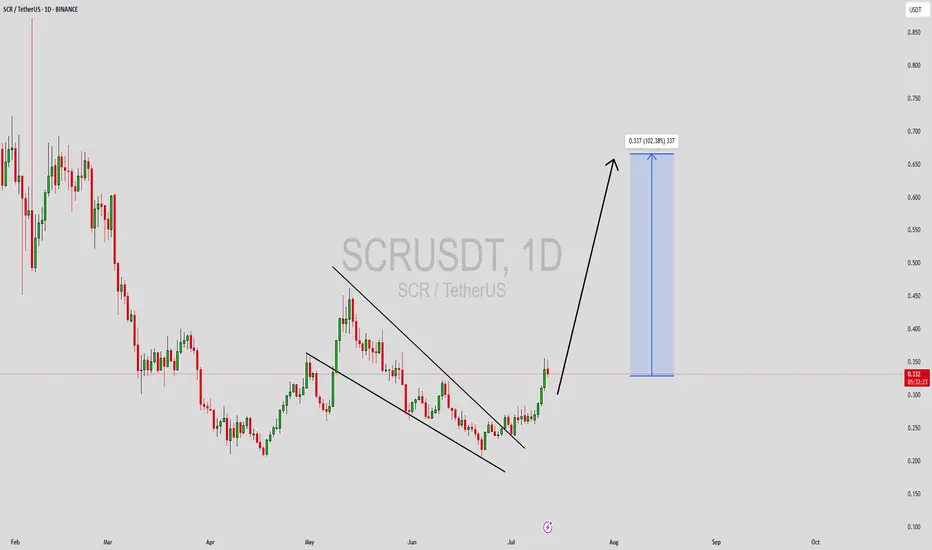
SCRUSDT Forming Descending TriangleSCRUSDT is catching the attention of smart traders as it shows signs of a strong bullish setup supported by increasing trading volume. This pair has recently seen consistent accumulation phases, which often precede significant price moves. With expectations for a potential 90% to 100%+ gain, SCRUSDT could deliver impressive returns for investors who position themselves early. Traders who are tracking fresh breakout opportunities should keep this crypto on their watchlist as buying interest grows across key support levels.
The underlying fundamentals of the SCR project are also becoming more appealing, helping fuel this recent investor interest. As the team behind SCR continues to develop its ecosystem, more market participants are gaining confidence in its long-term growth potential. The robust on-chain activity and positive community sentiment further add to the bullish outlook. It’s encouraging to see that the volume profile supports the price action, indicating that this isn’t just a speculative pump but rather a move backed by solid participation.
Technically, SCRUSDT is forming a reliable base that could launch the next leg up once a breakout above the recent resistance levels is confirmed. Traders should watch for strong bullish candles and increasing volume near breakout points to validate the move. Risk management remains key—placing stop-losses under nearby swing lows can help manage downside risk while targeting the anticipated upside potential.
✅ Show your support by hitting the like button and
✅ Leaving a comment below! (What is You opinion about this Coin)
Your feedback and engagement keep me inspired to share mo
SCRUSDT UPDATE
Pattern: Falling Wedge Breakout
Current Price: \$0.268
Target Price: \$0.398
Target % Gain: 50.1%
Technical Analysis: SCR has broken out of a falling wedge pattern on the 12H chart with a clean close above resistance. The breakout is backed by bullish candles and increasing volume, suggesting a potential 50% move upward.
Time Frame: 12H
Downtrend Over? $SCR Just Flipped the Script!TSX:SCR just broke out after moving down for 139 days.
This isn’t just another pump, it’s a change in direction.
- Price broke the long-term downtrend
- Jumped above the 200 EMA
- Now testing the breakout zone again
If this area holds, bulls could take control and push higher.
It’s a clean setup, don’t ignore it.
DYOR, NFA
#ALTSEASON
SCR/USDT Analysis – Weekly Chart at March 10, 2025.SCR has completed a significant correction, reaching a key Fibonacci support zone around 0.342. The chart shows a deep retracement, hinting at a potential reversal from this level.
🔹 Fibonacci Levels – The current support aligns closely with the 0.618 Fibonacci retracement level at 0.927, which is often considered a strong reversal point after a correction.
🔹 Potential Upside Targets:
0.786 (1.283) – First significant resistance if the bounce occurs.
0.886 (1.556) – A stronger resistance level that could act as a potential profit-taking zone.
1.0 (1.940) – Recovery to previous highs and the key psychological level.
1.236 (3.062) – Extension target after breaking the previous high.
1.618 (6.410) – Ultimate bullish target in case of a full trend reversal.
🚀 Scenario Analysis
* Bullish Reversal (70%): Price holds support, starts a rally towards 1.283, then 1.556, and beyond.
* Further Breakdown (30%): Price fails to hold 0.342, leading to deeper corrections towards 0.280 or lower.
Let's see if bulls can maintain the critical support or if bears push for a deeper correction! 💥
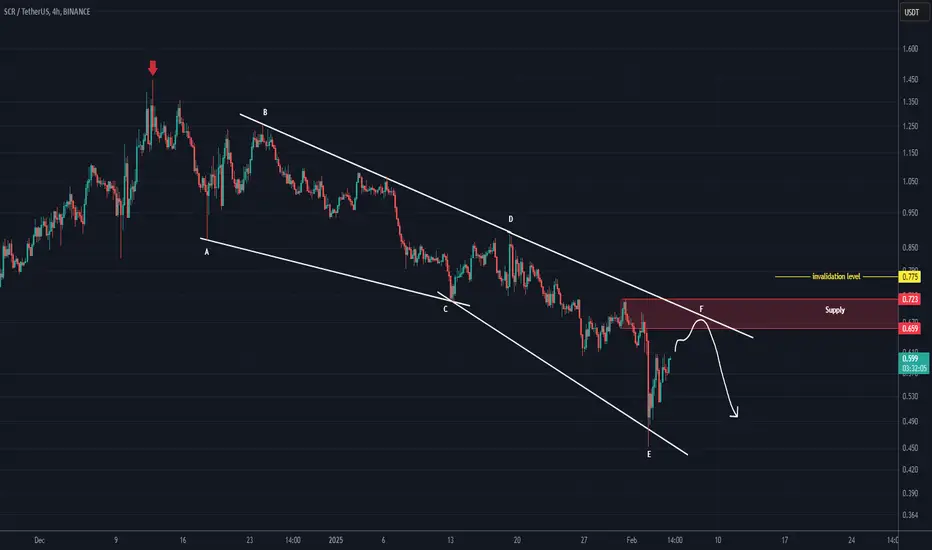
SCR ANALYSIS (4H)From the point where we marked "START" on the chart, it seems that SCR's correction has begun.
This correction appears to be either a diametric or a symmetrical pattern. Currently, the price seems to be completing wave F of this diametric structure.
It may get rejected downward again from the red zone.
A daily candle closing above the invalidation level would invalidate this analysis.
For risk management, please don't forget stop loss and capital management
Comment if you have any questions
Thank You
Three White Soldiers pattern at the bottom suggests a potential Your TA looks solid, and the Three White Soldiers pattern at the bottom suggests a potential reversal to the upside. However, let’s break it down:
Bullish Case:
1. Three White Soldiers Pattern – This is a strong bullish reversal signal, especially after a prolonged downtrend.
2. Support Held at ~0.603 – The price reacted well from this level, forming a double-bottom structure.
3. Resistance at 0.965 – The first target should be around this level before looking at 1.4.
4. Volume Confirmation? – If increasing volume follows this pattern, it strengthens the case for an uptrend.
Bearish/Risky Case:
1. Overall Trend Still Down? – Despite the pattern, the overall structure is still bearish unless it breaks key resistances.
2. Low Market Momentum? – If the broader market is weak, this bounce could be a short-lived relief rally before another drop.
3. Liquidity Around 0.85 – 0.965 – A lot of sell-side pressure might come in at these levels.
Verdict:
• If volume picks up and BTC remains stable, I’d expect a move to 0.965 first, then possibly 1.4.
• If rejection happens below 0.85, market weakness prevails, and we retest 0.603 or even lower.
Let me know if you want a more detailed breakdown or alternative scenarios. 🚀
SCROLL is taking off this week!Finally the SCR accumulation is over and we are out of the triangle! My global target is 8$! I like how Polychain works with the assets they have invested in. Fibonacci values to lock in your positions on the chart, RSI unloaded, mm typed tokens and already running the script.
Horban Brothers!
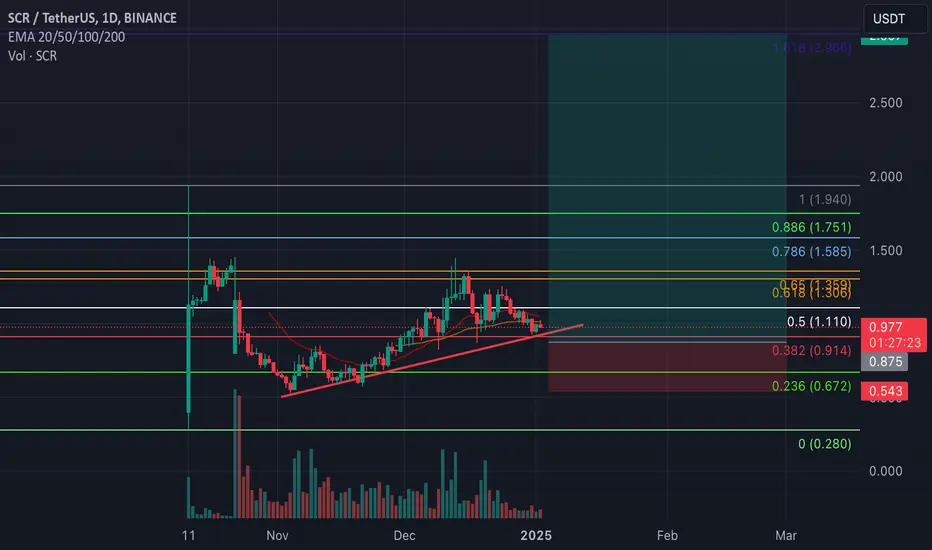
Scroll - January 3, 2025Today, I’m writing about Scroll (SCR/USDT). Currently, SCR is trading at $0.97, sitting close to the 0.382 Fibonacci level at $0.913.
Based on the technicals, I expect SCR to climb to the 1.618 Fibonacci level, around $3, in the next 2-3 months 🚀. During the much-awaited altcoin season, Scroll looks very promising..
Why?
Scroll has a market cap of $184M, but only 19% of the tokens are in circulation. With strong fundamentals and the rising hype around Layer 2 projects, a 3-4x move from here doesn’t seem far from reality. 💡
Let’s see how it plays out. 👀
Our SCR short was superbwe've introduced a new variable called spl sell for shorting trending coins because it's often observed that markets tend to drop faster and with greater intensity than they rise.
That red circle on the top is our spl sell print and you can set the alerts too. See how cleanly we've got a point where we can short and make money for a trending coin.
DYOR
For indicator access you can drop a message.
SCRUSDT accumulation zone, ready to rally!!Join our community and start your crypto journey today for:
In-depth market analysis
Accurate trade setups
Early access to trending altcoins
Life-changing profit potential
Let's analyse SCRUSDT fundamentally and technically.
FUNDAMENTAL ANALYSIS:
Scroll is a Layer 2 scaling solution for Ethereum. It uses zkRollup technology to reduce transaction costs and increase throughput. By leveraging zero-knowledge proofs, Scroll ensures privacy, security, and scalability while addressing Ethereum's limitations.
TECHNICAL ANALYSIS:
SCRUSDT recently broke out of a symmetrical triangle pattern. It's currently trading above the crucial 100 and 200 EMAs in this chart. The MACD and RSI indicators are bullish and nearing a potential breakout. While there's been a significant volume spike, it hasn't yet translated into a major price surge.
Key Level:
Entry: $0.9 to $0.792 (DCA)
Targets:
Easy 2-3x gain from the entry point.
If you find this analysis helpful, please hit the like button to support my content! Share your thoughts in the comments and feel free to request any specific chart analysis you’d like to see.
SCRUSDT is BullishPrice was in a strong downtrend, however upside reversal seems to be on play after a bullish divergence appeared on four hourly time frame. First higher high is printed successfully and if bulls maintain pressure then we can expect further highs. Targets are mentioned on the chart.
SCR possible long SCR is quite volatile for me, so I recommend ist either without leverage or a maximum of 2-3.
If we don't hold the current support, then 2 green zones are marked on the chart, for long I recommend the lower zone (but the chance of getting there is 50/50).
I recommend setting SL according to your risk management.
GL!