SEI USDT LONG SIGNAL#9. .SEI/USDT – Trade Setup (LONG)
📈 Position Type: LONG
🕒 Timeframe: 1H
📊 Market: Futures
💰 Entry Zone:
0.04139
🛑 Stop-Loss:
0.04025
🎯 Take-Profit Targets:
• TP1: 0.04212
• TP2: 0.04320
• TP3: 0.04410
• TP4. 0.04493
Tp5.
⚙️ Leverage:
5*10
▫️ After TP1, move SL to Entry + 0.2%.
▪️ Exit Plan:
• 40% at TP1
• 20% at TP2
• 20% at TP3
20% at TP4
📌 Risk Management:
Risk only 1–2% of your capital per trade.
⚠️ Always check and confirm the setup on your chart before entering the trade.
In-depth trading ideas
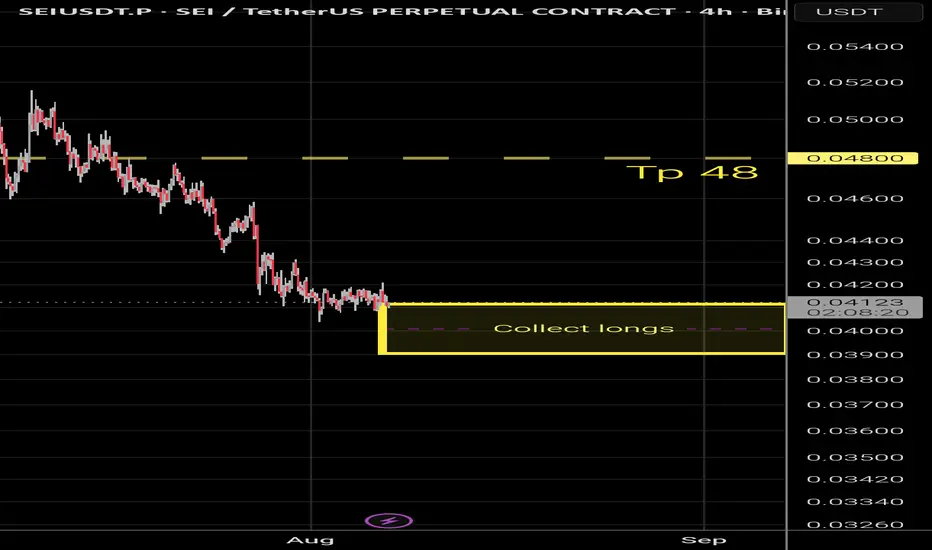
SEIExodus 14:21 — “And the waters were divided.”
SEI standeth before the sea, pursued by fear and surrounded by those who believe there is no road forward.
Between 0.039 and 0.041, the faithful shall gather at the shore while the multitude trembleth before the waters.
Then shall the sea divide.
A path once hidden shall appear, and 0.048 shall await upon the other side.
Let the fearful behold only the waves. Those who understand the sign shall prepare to cross.
SEI at macro floor: base recovery toward $0.05021The Macro Picture 🗺️
SEI ground down from the $0.07979 macro ceiling all the way to the $0.04105 macro floor and has flattened onto it at $0.04180. The long, steady bleed has given way to a base right on support — exhaustion rather than continuation.
The Setup ⚙️
The Accumulation Zone 🟢
$0.04105–0.04180 is where the selling has dried up. Macro Support has held on retest, and this is the demand shelf a recovery would build from.
The Decision Point 🔴
$0.05971 (Local High) is the structural gate above. Before it, the $0.05021 measured-move target is the first objective — reclaiming it proves buyers are stepping back in.
The Roadmap 🛣️
Hold the $0.04105 floor → recover toward $0.05021 as the first leg up. Invalidation is a clean daily close below $0.04105 — that voids the accumulation thesis.
This is a textbook DCA Accumulation Zone setup: scale in across the $0.04105–0.04180 band and let the base do the work.
#SEI #Sei #crypto #trading #TA #3Commas #DCA
#SEIUSDT - Final Support Before a Major Reversal or Breakdown#SEI
The price is moving within a descending channel on the 1-hour timeframe and has reached the lower boundary. It is now poised for a bounce and is expected to retest this boundary.
The Relative Strength Index (RSI) indicates a downward trend, which is likely to continue given the overbought conditions.
There is a key support zone in green at 0.04000, and the price has bounced off this zone several times, making it a strong support level.
The price is trending towards the 100-period moving average, which we are approaching. This trend supports an upward move.
Entry Price: 0.04200
Target 1: 0.04285
Target 2: 0.04285
Target 3: 0.04464
Stop Loss: At the resistance zone in green
Remember this simple rule: Money Management.
Any questions? Please leave a comment.
Thank you.
SEI USDT LONG SIGNAL#132. SEI/USDT – Trade Setup (LONG)
📈 Position Type: LONG
🕒 Timeframe: 1H
📊 Market: Futures
💰 Entry Zone:
0.04515
🛑 Stop-Loss:
0.043330
🎯 Take-Profit Targets:
• TP1: 0.04695
• TP2: 0.04763
• TP3: 0.04897
• TP4: 0.05060
⚙️ Leverage:
5*10
▫️ After TP1, move SL to Entry + 0.2%.
▪️ Exit Plan:
• 40% at TP1
• 20% at TP2
• 20% at TP3
20%. at. TP4
📌 Risk Management:
Risk only 1–2% of your capital per trade.
⚠️ Always check and confirm the setup on your chart before entering the trade.
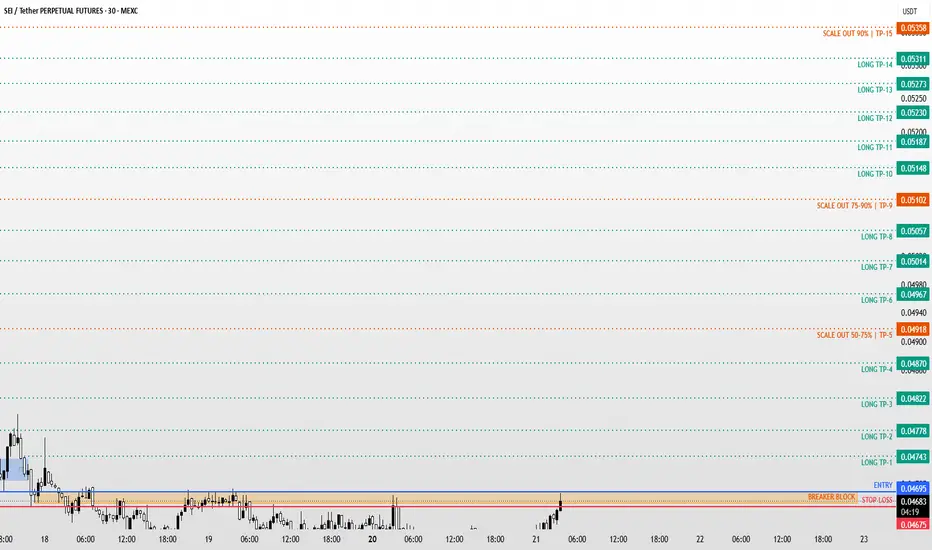
SEI / SEIUSDT Long Setup | Breaker Block ReclaimMARKET ANALYSIS
SEI is currently reacting from a key technical area highlighted on the chart.
As long as the protected support zone remains intact, the bullish market structure remains valid and higher liquidity targets may continue to attract price action.
A breakdown below the invalidation level would weaken the current bullish scenario and require a reassessment of market conditions.
📍 Entry, Stop Loss and Take Profit levels are marked directly on the chart.
━━━━━━━━━━━━━━
⚠️ DISCLAIMER
This publication is provided solely for educational and market observation purposes.
Nothing contained in this analysis should be considered financial advice, investment advice, or a recommendation to buy or sell any financial instrument.
All trading and investment decisions remain solely the responsibility of the individual trader.
Always conduct your own research and apply proper risk management before entering any position.
━━━━━━━━━━━━━━
🎯 PARALOG
▪️Crypto Market Analysis
▪️BTC Futures Signals
▪️Bitcoin & Altcoin Market Analysis
Precision • Momentum • Timing
━━━━━━━━━━━━━━
Exchange: #MEXC Futures
#bitcoin #btc #crypto #futures #technicalanalysis
SEI USDT LONG SIGNAL#93 SEI /USDT – Trade Setup (LONG)
📈 Position Type: LONG
🕒 Timeframe: 1H
📊 Market: Futures
💰 Entry Zone:
0.04563
0.04490
🛑 Stop-Loss:
0.04425
🎯 Take-Profit Targets:
• TP1: 0.04679
• TP2: 0.04868
• TP3: 0.05083
• TP4: 0.05318
⚙️ Leverage:
5 *10
▫️ After TP1, move SL to Entry + 0.2%.
▪️ Exit Plan:
• 40% at TP1
• 20% at TP2
• 20% at TP3
20% at. TP4
📌 Risk Management:
Risk only 1–2% of your capital per trade.
⚠️ Always check and confirm the setup on your chart before entering the trade.
SEI USDT LONG SIGNAL#73. SEI/USDT – Trade Setup (LONG)
📈 Position Type: LONG
🕒 Timeframe: 1H
📊 Market: Futures
💰 Entry Zone:
0.04774
0.04674
🛑 Stop-Loss:
0.04580
🎯 Take-Profit Targets:
• TP1: 0.04895
• TP2: 0.05028
• TP3: 0.05153
• TP4: 0.05274
⚙️ Leverage:
5–10x
▫️ After TP1, move SL to Entry + 0.2%.
▪️ Exit Plan:
• 40% at TP1
• 20% at TP2
• 20% at TP3
20% at. TP4
📌 Risk Management:
Risk only 1–2% of your capital per trade.
⚠️ Always check and confirm the setup on your chart before entering the trade.
#SEIUSDT - Final Support Before a Major Reversal or Breakdown#SEI
The price is moving within a descending channel on the 1-hour timeframe and has reached the lower boundary. It is now poised for a bounce and is expected to retest this boundary.
The Relative Strength Index (RSI) indicates a downward trend, which is likely to continue given the overbought conditions.
There is a key support zone in green at 0.04450. The price has bounced off this zone several times, making it a strong support level.
The price is trending towards the 100-period moving average, which we are approaching. This trend supports an upward move.
Entry Price: 0.04827
Target 1: 0.04890
Target 2: 0.05019
Target 3: 0.05157
Stop Loss: At the resistance zone in green
Remember this simple rule: Money management.
Any questions? Please leave a comment.
Thank you.
SEIUSDT — Will This Critical Support Break?📊 Technical Analysis
💵 Coin: NYSE:SEI #SEI
⏳ Time Frame: 12H
📉 Pattern: Rising Wedge (Bearish Reversal Pattern)
🎯 Potential Target: 10%+ if the breakdown is confirmed.
---
📝📖 Chart Analysis
🔍 On the 12H timeframe, SEIUSDT is currently forming a Rising Wedge, a chart pattern that has historically been recognized as a bearish reversal signal, especially after a prior downtrend.
📈 Price is moving within the Rising Wedge, characterized by:
🔺 An ascending Lower Trendline (red support line), acting as the buyers' primary defense.
🔺 An ascending Upper Trendline (yellow resistance line) with a gentler slope, creating a narrowing (converging) price structure.
⚠️ Although the support has managed to hold the price several times, each rebound continues to form lower highs, indicating that buying momentum is fading while selling pressure remains dominant.
🎯 Price is now trading very close to the main support of the Rising Wedge, making this a critical zone that could determine the next major move.
---
🔴🐻 Bearish Scenario (Higher Probability)
🚨 If the price successfully breaks down and closes below the lower trendline, the Rising Wedge pattern will be confirmed.
A confirmed breakdown could trigger:
📉 A deeper bearish continuation.
💥 Increasing selling pressure from market participants.
⚡ Long liquidations that could accelerate the downward move.
🎯 A decline toward the next key support area based on the pattern's projected target.
⚠️ As long as the price remains below the wedge resistance, the bearish outlook continues to have the upper hand.
---
🟢🐂 Bullish Scenario
✅ A bullish scenario will only gain confirmation if:
📈 Price successfully holds above the Rising Wedge support.
🚀 Buyers push the price above the upper wedge resistance.
📊 The breakout is confirmed by a strong candle close accompanied by increasing trading volume.
💹 If this breakout is validated, the current bearish structure will begin to weaken, opening the door for a stronger recovery toward higher resistance levels.
---
📌✨ Conclusion
⚠️ SEIUSDT is currently trading at a decisive level that could determine its next major direction.
📉 As long as the price remains inside the Rising Wedge, traders should stay alert for a potential bearish breakdown, as this pattern frequently leads to further downside continuation.
🕯️ Always wait for a confirmed candle close before making any trading decisions.
🛡️ Practice proper risk management and never rely solely on predictions.
> ⚠️ Disclaimer: This analysis is based solely on technical analysis and should not be considered financial advice or a recommendation to buy or sell any asset.
#SEI #SEIUSDT #Crypto 🚀 #Cryptocurrency 💰 #TechnicalAnalysis 📊 #TradingView 📈 #PriceAction #ChartPattern #RisingWedge #BearishPattern #Breakdown #Support #Resistance #Altcoin #Binance #CryptoTrading #MarketAnalysis #Trader #Trading #CryptoAnalysis
#SEIUSDT - Final Support Before a Major Reversal or Breakdown#SEI
The price is moving within a descending channel on the 1-hour timeframe and has reached the lower boundary. It is now poised for a bounce and is expected to retest this boundary.
The Relative Strength Index (RSI) indicates a downward trend, which is likely to continue given the overbought conditions.
There is a key support zone in green at 0.04300. The price has bounced off this zone several times, making it a strong support level.
The price is trending towards the 100-period moving average, which we are approaching. This trend supports an upward move.
Entry Price: 0.04640
Target 1: 0.04720
Target 2: 0.04844
Target 3: 0.04990
Stop Loss: At the resistance zone in green
Remember this simple rule: Money management.
Any questions? Please leave a comment.
Thank you.
SEI: fading bounce targets the $0.044 floorThe Macro Picture 🗺️
SEI spiked to $0.08 in May and has been in a descending structure ever since, printing lower highs as each rally gets sold. The June flush to $0.044 produced a reflex bounce toward $0.058, but that recovery has stalled — RSI has rolled back under 45 and price is fading toward the $0.049 equilibrium, unable to hold its gains. In a trend this heavy, a bounce that fails to reclaim its breakdown level is a continuation signal rather than a reversal. The path of least resistance still points lower until bulls prove they can defend and reclaim overhead structure.
The Setup ⚙️
The Rejection: The bounce stalled beneath the $0.058 local decision (red dashed), the level that flipped from support to resistance on the breakdown. As long as price stays capped under it, sellers keep the upper hand.
The Floor: The $0.044 macro support (solid green) stacks under the $0.046 local low to form the last high-confluence shelf. This is the battleground — a break here opens fresh downside, while a firm defense is the only thing that sets up a base.
The Reaction: RSI fading back under its midline after the bounce signals the relief rally is running out of fuel, favoring another test of the floor over an immediate trend reversal.
The Roadmap: Primary target sits at $0.044 — the red projection points toward a retest of the macro floor as the bounce fails. Invalidation: a sustained 1D close back above $0.058 would flip the structure and open the path toward the $0.065 macro ceiling.
More setups in profile.
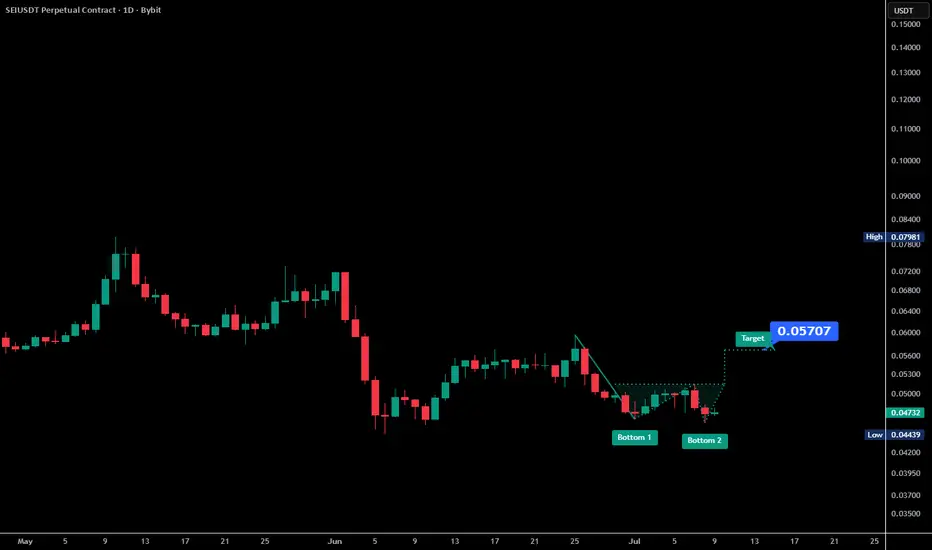
$SEIUSDT Double Bottom RecoverySEIUSDT Perpetual Contract (1D) is showing a potential double bottom formation after an extended downtrend. Two lows have formed around the same support area, suggesting that selling pressure may be weakening if buyers continue to defend this zone.
The current price is trading near 0.0474 USDT, with the primary support located around 0.0440–0.0450 USDT, where both bottoms have developed. This area is important because a loss of support would invalidate the current bullish structure.
The nearest resistance is around 0.0500 USDT, followed by the neckline region near 0.0550 USDT. A sustained move above this resistance could confirm the double bottom pattern and increase the probability of further upside.
If the breakout is confirmed above the neckline, the chart projects a potential move toward 0.0571 USDT, representing an approximate 20% gain from the current price zone.
If price fails to hold the 0.0440 USDT support, the pattern may become invalid and additional downside could follow. As always, watch for confirmation before considering any directional bias. This analysis is for educational purposes and should not be considered financial advice.
#SEIUSDT - Final Support Before a Major Reversal or Breakdown#SEI
The price is moving within a descending channel on the 1-hour timeframe and has reached the lower boundary. It is now poised for a bounce and is expected to retest this boundary.
The Relative Strength Index (RSI) indicates a downward trend, which is likely to continue given the overbought conditions.
There is a key support zone in green at 0.04617. The price has bounced off this zone several times, making it a strong support level.
The price is trending towards the 100-period moving average, which we are approaching. This trend supports an upward move.
Entry Price: 0.04894
Target 1: 0.04985
Target 2: 0.05087
Target 3: 0.05200
Stop Loss: At the resistance zone in green
Remember this simple rule: Money management.
Any questions? Please leave a comment.
Thank you.
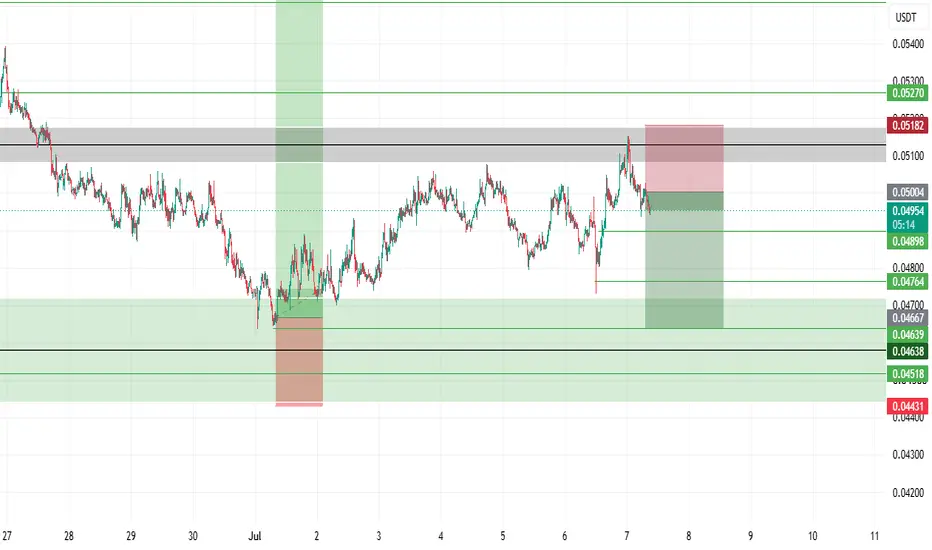
SEI USDT SHORT SIGNAL#24. SEI/USDT – Trade Setup (SHORT)
📈 Position Type: SHORT
🕒 Timeframe: 1 H
📊 Market: Futures
💰 Entry Zone:
0.050
🛑 Stop-Loss:
0.05186
🎯 Take-Profit Targets:
• TP1: 0.04899
• TP2: 0.04764
• TP3: 0.04640
• TP4:
TP5:
TP6:
⚙️ Leverage:
5- 10
⚠️ After reaching TP1, move Stop-Loss to Entry Price.
📌 Risk Management:
Risk only 1–2% of your capital per trade.
Always confirm the setup on your chart before entry
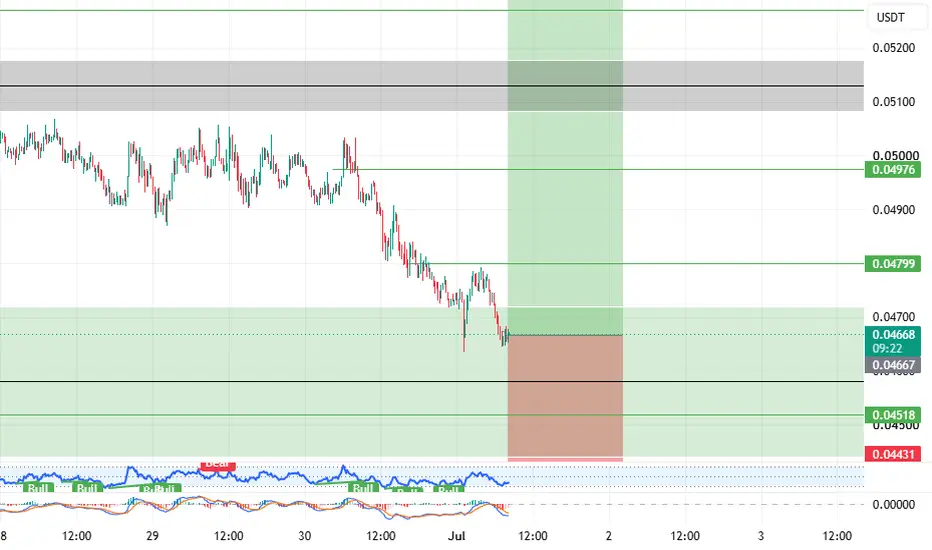
SEI USDT LONG SIGNALSEI /USDT – Trade Setup (LONG)
📈 Position Type: LONG
🕒 Timeframe: 1 H
📊 Market: Futures
💰 Entry Zone:
0.04670
0.04518
🛑 Stop-Loss:
0.04429
🎯 Take-Profit Targets:
• TP1: 0.048
• TP2: 0.04975
• TP3: 0.05270
• TP4: 0.05510
TP5: 0.05798
TP6:
⚙️ Leverage:
5- 3
⚠️ After reaching TP1, move Stop-Loss to Entry Price.
📌 Risk Management:
Risk only 1–2% of your capital per trade.
Always confirm the setup on your chart before entry
#SEIUSDT - Final Support Before a Major Reversal or Breakdown#SEI
The price is moving within a descending channel on the 1-hour timeframe and has reached the lower boundary. It is now poised for a bounce and is expected to retest this boundary.
The Relative Strength Index (RSI) indicates a downward trend, which is likely to continue given the overbought conditions.
There is a key support zone (in green) at 0.04722. The price has bounced off this zone several times, making it a strong support level.
The price is trending towards the 100-period moving average, which we are approaching. This trend supports an upward move.
Entry Price: 0.05038
Target 1: 0.05040
Target 2: 0.05228
Target 3: 0.05388
Stop Loss: At the resistance zone (in green)
Remember this simple rule: Money management.
Any questions? Please leave a comment.
Thank you.
SEIUSDT Forming Bullish MomentumSEIUSDT is forming a clear bullish momentum pattern, a classic bullish wave signal that often indicates an upcoming breakout. The price has been consolidating within a narrowing range, suggesting that selling pressure is weakening while buyers are beginning to regain control. With consistent volume confirming accumulation at lower levels, the setup hints at a potential bullish breakout soon. The projected move could lead to an impressive gain of around 40% to 50% once the price breaks above the key resistance zone.
This bullish momentum pattern is typically seen at the end of downtrends or corrective phases, and it represents a potential shift in market sentiment from bearish to bullish. Traders closely watching SEIUSDT are noting the strengthening momentum as it nears a breakout zone. Strong trading volume adds confidence to this pattern, showing that market participants are positioning early in anticipation of a reversal.
Investors’ growing interest in SEIUSDT reflects rising confidence in the project's long-term fundamentals and current technical strength. If the breakout confirms with sustained volume, this could mark the start of a fresh bullish leg. The current market structure suggests that buyers are steadily gaining control while bearish pressure continues to fade.
Traders might find this a valuable setup for medium-term gains, especially as the bullish momentum pattern develops and buying momentum accelerates. A successful breakout could attract additional market participation and potentially drive the price toward significantly higher levels in the coming weeks.
✅ Show your support by hitting the like button!
✅ Leave a comment below! (What is your opinion about this coin?)
Your feedback and engagement keep me inspired to share more insightful market analysis with you!
SEI appears to be turning bullish (4H)It appears that a bearish wave on SEI has come to an end, and SEI has entered a bullish phase.
We have identified a support zone where positions should be built using a DCA strategy.
The targets are marked on the chart. Move your stop loss to breakeven once the first target is reached.
A daily candle close below the invalidation level will invalidate this analysis.
If you have a symbol you want analyzed, first hit the like button and then comment its name so I can review it for you.
Do you also think SEI is bearish?
SEI Looks Bearish (4H)This analysis is an update to the previous analysis, which you can find in the related publications section.
Based on the pivot formed at the top, followed by a bull trap and a breakdown to the downside, the structure now appears to be a triangle. Price seems to be in the process of completing Wave D.
Instead of looking for long positions, short positions can be considered at the marked levels, targeting the areas indicated on the chart.
A daily candle close above the invalidation level would invalidate this scenario.
If you have a coin or altcoin you want analyzed, first hit the like button and then comment its name so I can review it for you.
What do you think? Is SEI bearish?
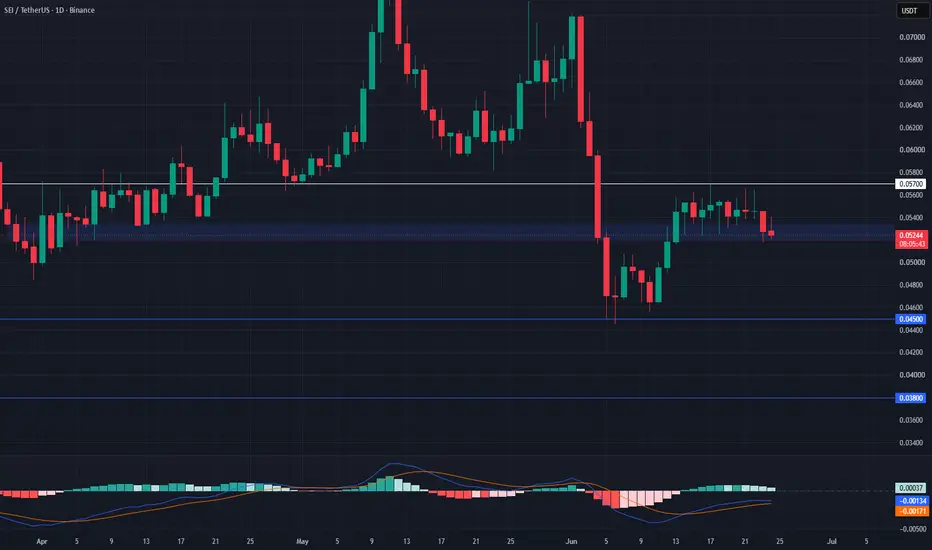
SEI Testing Key Support—Breakdown Could Trigger Further DownsideSEI remains in a strong downtrend and is now testing a key support area. Our researchers suggest that if peace talks weaken further and risk-off sentiment returns, SEI could break below this level and accelerate lower.
This setup remains one of the cleaner continuation short opportunities as long as weakness persists.
Trade Levels:
Entry Zone: $0.053 – $0.052
Take Profit Targets: $0.045, $0.038
Stop Loss: $0.057
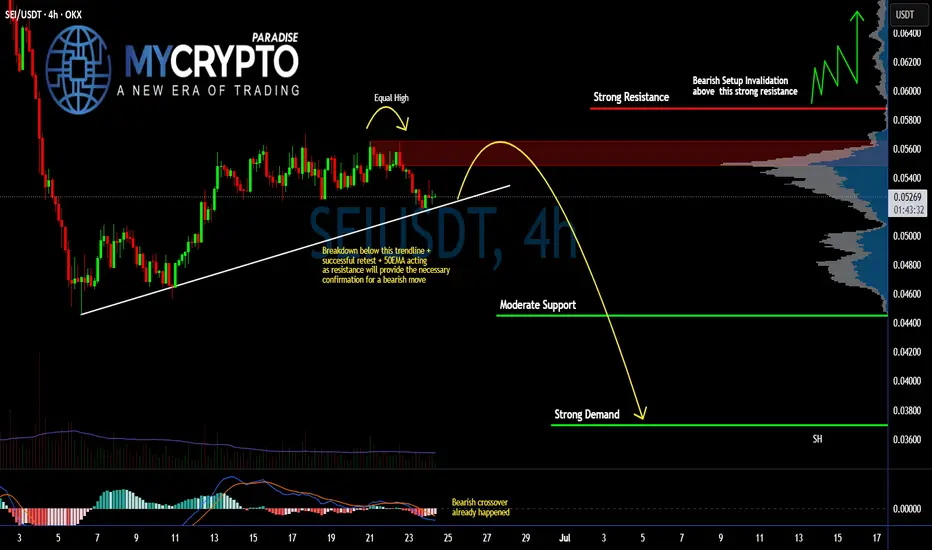
Is #SEI About to Trigger a Major Trap | Don't Miss This OneYello, Paradisers! Is #SEI preparing for a major bearish breakdown that could wipe out late buyers, or will bulls somehow defend the current structure? Let’s break down the current #SEIUSD trading setup:
💎#SEIUSDT is currently trading around $0.052 after facing repeated rejection from a significant resistance zone between $0.054 and $0.056. What makes this area particularly important is the formation of equal highs, which often signals that liquidity is building above the market. The chart also shows that #SEI is about to break below its ascending support trendline that previously supported the entire recovery structure. A break of trendline support alone is not enough for confirmation, but it will serve as an early warning that bullish momentum is fading.
💎For the bearish scenario to gain stronger validity, we need to see a successful retest of the broken trendline, with the 50 EMA acting as dynamic resistance and rejecting any recovery attempts. Adding further weight to the bearish outlook, the MACD has already printed a bearish crossover on the 4H timeframe. This indicates that momentum is shifting in favor of sellers. While momentum indicators should never be used in isolation, the bearish crossover aligns well with the current market structure and the rejection from the overhead supply zone.
💎If sellers maintain control and the retest confirms resistance, the first major downside target sits near the moderate support zone around $0.044. This level may attract buyers and create a temporary relief bounce. However, if market weakness continues and this support fails to hold, the next high-probability destination becomes the strong demand zone around $0.0370, where historical buying interest could re-enter the market.
💎At the same time, traders should remain cautious of potential liquidity grabs. The equal highs resting beneath resistance make the area above $0.0565 attractive for stop-hunts before any larger directional move develops. This is why patience and confirmation remain critical before committing heavily to either direction.
💎For the bearish setup to remain valid, #Sei must stay below the major resistance region and continue respecting both the broken trendline and the 50 EMA as resistance. However, if bulls manage to produce a strong breakout and secure acceptance above the $0.058 resistance level, the bearish thesis would be invalidated.
Trade smart, Paradisers. This setup will reward only the disciplined.
MyCryptoParadise
iFeel the success🌴
SEIUSDT Forming Bullish MomentumSEIUSDT is forming a clear bullish momentum pattern, a classic bullish wave signal that often indicates an upcoming breakout. The price has been consolidating within a narrowing range, suggesting that selling pressure is weakening while buyers are beginning to regain control. With consistent volume confirming accumulation at lower levels, the setup hints at a potential bullish breakout soon. The projected move could lead to an impressive gain of around **80% to 90%** once the price breaks above the key resistance zone.
This bullish momentum pattern is typically seen at the end of downtrends or corrective phases, and it represents a potential shift in market sentiment from bearish to bullish. Traders closely watching SEIUSDT are noting the strengthening momentum as it approaches a critical breakout area. The healthy trading volume adds confidence to this setup, showing that market participants may be positioning early in anticipation of a strong upward move.
Investors' growing interest in SEIUSDT reflects increasing confidence in the project's long-term potential and current technical strength. If the breakout confirms with sustained volume, this could mark the beginning of a fresh bullish leg. Traders may find this an attractive setup for medium-term gains, especially as buying pressure continues to build and momentum accelerates.
✅ Show your support by hitting the like button!
✅ Leave a comment below! (What is your opinion about this coin?)
Your feedback and engagement keep me inspired to share more insightful market analysis with you!