SEI / USDT (DOUBLE BOTTOM - BULLISH REVERSAL SIGNAL)Market Structure & Technical Outlook
Price has been in a downtrend for approximately the last 35 days. However, bullish RSI divergence has emerged on the 4H timeframe, accompanied by the formation of a Double Bottom reversal pattern. These developments suggest a potential weakening of bearish momentum and the possibility of a bullish reversal.
A breakout above the previous Lower High (LH) would provide further confirmation of a potential shift in market structure from bearish to bullish.
Addi
SEI / TetherUS
No trades
No trades
In-depth trading ideas
SEIUSDT 5X LONG with 3,020% Profits Potential —2026-2028 BullishCan everything suddenly change? Hyper-bullish chart setup now available for SEIUSDT with 5X.
Consider the strong retrace on this chart, the higher low, volume and other features. The ending diagonal as a trend reversal pattern and the downtrend being broken as the end of the bear-market.
Nothing more needs to be said.
Full trade-mumbers below:
_____
LONG SEIUSDT
Leverage: 5X
Potential: 3020%
Allocation: 5%
Entry zone: $0.04200 - $0.04820
Targets:
1) $0.0653
2) $0.0820
3) $0.1090
4)
#SEIUSDT : Key Support Holds as Price Eyes a Bullish Rebound#SEI
SEI was among the cryptocurrencies that recorded notable price performance during the previous altcoin season, before entering a corrective phase that lasted several months.
On the daily timeframe, the price reached a major support zone around $0.03500 during this correction. This level has previously demonstrated its ability to halt downward momentum and trigger a rebound, with the price subsequently gaining nearly 100% from that area.
Following the previous upward move, SEI entered ano
SEI / USDT (DOUBLE BOTTOM FORMATION)Market Structure & Technical Outlook
Price is currently in a downtrend, consistently forming Lower Lows (LLs) and Lower Highs (LHs), while trading within a Descending Channel. However, bullish RSI divergence on the 4H timeframe, combined with the formation of a Double Bottom reversal pattern, indicates a potential weakening of bearish momentum and the possibility of a bullish reversal.
A breakout above the previous Lower High (LH), which also coincides with a strong horizontal and vertical res
SEIUSDT Bullish Retest Setup Targeting 0.05450 #SEI
SEI is showing signs of a potential bullish continuation following an upside breakout above its descending trendline. The price is currently revisiting the broken trendline to confirm it as a new support level.
As long as the price holds above this area, a bullish move from 0.05135 could push SEI toward the next resistance target at 0.05450.
The overall bullish scenario is reinforced by a key support level at 0.04900, which remains an important level to watch. A decisive break below this
LINK seems to have turned bearish (4H)Since the point marked as "Start" on the chart, SEI appears to have entered a corrective phase. Based on the current structure, this correction could be developing as either a Diametric or a Symmetrical pattern. At the moment, price seems to be approaching the end of Wave F of this potential Diametric structure.
As long as the red zone holds, SEI could move lower to complete Wave G. The bearish targets marked on the chart represent the potential downside objectives for this move.
For now, the
SEIUSDT 3X LONG with 1,371% Profits Potential —Time SensitiveCan everything suddenly change? The market always fluctuates between bearish and bullish action, not one direction stays forever the same.
The switch happens without warning. One day we are going up, the next day we are going down. As the market goes down, continually, next week it starts to grow and it does so for months.
Looking at SEIUSDT, we focus on the bigger picture, a bullish market. We will see rising prices as we've been seeing for months. The current retrace allows for a new entry a
SEIUSDT ReversalSEI might be in for a an upside potential
The descending flag or flag pattern along with a head & shoulders forming looks promising.
If it breaks the neckline I will be looking to target 0.8
The next token unlock is on 15th November so there is room for a rally before a potential dump.
SEI/USDT 4h - Main Scenario — Entry into the Fifth Elliott WaveMain Scenario — Entry into the Fifth Elliott Wave
On the SEI/USDT 4-hour chart, the current structure may represent the completion of the corrective fourth wave, followed by the beginning of a fifth impulsive wave to the upside. The primary scenario projects a potential move toward 0.078–0.086 USDT.
The endpoints of the green and red arrows mark potential key reversal zones. These areas should be monitored for price-action confirmation and opportunities to enter with tight stop-losses. Reachin
SEI/USDT: Bullish Channel Retest and Trend ContinuationHello.
Structure Analysis:
The asset is respecting an established bullish trend channel (yellow). After a recent rejection at the channel ceiling, the price entered a short-term correction within a descending regression channel (white lines). Current price action indicates a potential reversal at the confluence of the channel floor and static support (0.07700 - 0.07800).
Trade Setup:
Entry: 0.08020 (Confirmation required: breakout and hold above descending resistance).
Stop Loss: 0.07590 (Belo
Sei: Bull-market vs altcoins (1,200% profits potential)SEIUSDT is back again challenging its May 2026 resistance and ready to produce a higher high to cement a new uptrend; pair after pair after pair gets to recover and grow.
SEI has a full green candle today and volume is really high at all times on this Cryptocurrency project and trading pair. The high volume is always a positive signal. The recent bars have been doing higher than usual and this is good to support the current move.
The first resistance on the way up will happen around $0.125 - $
SEI Still Bullish: Is the Next Move Higher About to Begin? (4H)SEI is still looking bullish to me.
The bullish phase started from the area marked by the green arrow, and the larger structure now looks like it could be developing as either a Diametric or a Symmetrical pattern.
At the moment, I’m watching two possibilities: we are either somewhere in the middle of Wave C or just entering Wave D.
Either way, the key area for me is the green zone.
A pullback into that area followed by a bullish reaction could set up the next move higher. The targets are alr
SEI/USDT (1h) Approaching a Bullish Pennant BreakoutSEI/USDT is consolidating inside a bullish pennant / symmetrical triangle on the 1H chart after a strong impulsive move higher. Price is forming lower highs beneath the descending resistance while maintaining higher lows along the rising support, with the structure now becoming very tight near the apex around $0.0615–$0.0620.
A confirmed breakout and hold above the upper trendline could trigger a bullish continuation toward the $0.078–$0.080 measured target area. A breakdown below the rising su
SEI is in a long term buying zone (3D)From the point where we placed the red arrow on the chart, SEI appears to have entered a bearish pattern and phase, specifically a diametric pattern.
We are now at the end of wave E. This wave is bearish within this pattern, and once it is completed, we expect bullish movements. These bullish moves will form wave F.
It is expected that wave E will finish within the green zone, after which the price may move toward the supply zone to complete wave F.
The targets are marked on the chart.
First
SEI: High-Beta L1 Mechanics, Supply Realities, and PAPatience trumps FOMO. Let the market build a validated structural floor, wait for volume and momentum alignment, and then execute with precision.
Protect your capital, wait for the structure to confirm, and let the market prove itself.
— TheSolidInvestor
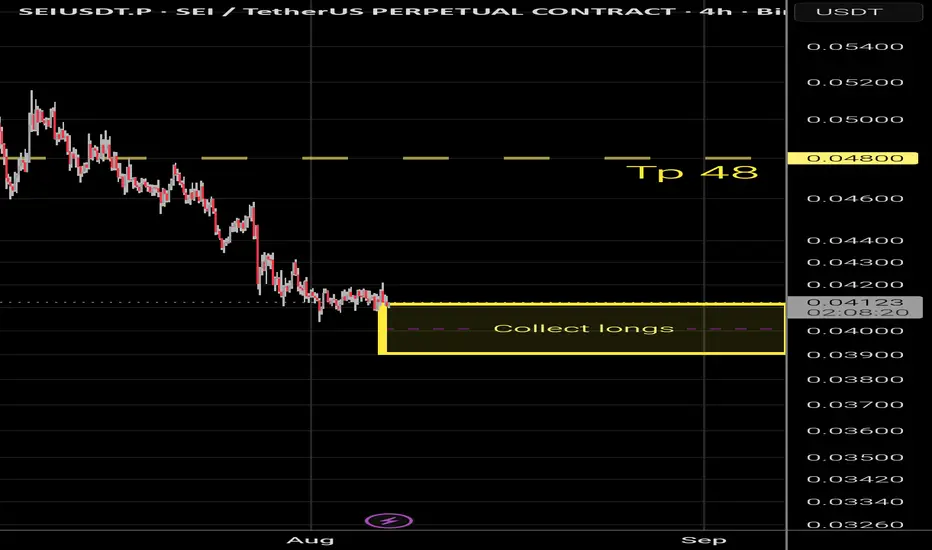
SEIExodus 14:21 — “And the waters were divided.”
SEI standeth before the sea, pursued by fear and surrounded by those who believe there is no road forward.
Between 0.039 and 0.041, the faithful shall gather at the shore while the multitude trembleth before the waters.
Then shall the sea divide.
A path once hidden shall appear, and 0.048 shall await upon the other side.
Let the fearful behold only the waves. Those who understand the sign shall prepare to cross.
SEI/USDT H2: Potential downward correction for SEI🎯 TP1: $0.046956 (+1.87%) │ TP2: $0.046062 (+3.74%)
🛑 SL: $0.049476 (-3.40%) │ R/R: 1 : 1.1
⚠️ SL is placed beyond the nearest candle tails to reduce the risk of accidental triggering
FUNDAMENTAL BACKGROUND
SEI is moving in line with the general altcoin trend without a local catalyst. The Fear & Greed Index is in the Extreme Greed zone (83), indicating market overheating, which increases the risks of sharp corrections. Tomorrow, 08/26/2026, key macro data on the Core PCE Price Index and US quar
Sei, Bitcoin & Crypto · New All-Time Highs All AcrossThere is a mixture in the names of the patterns, I am mixing many charting systems when reading these charts, I am hoping that you can understand. It is good. Instead of going for one system only, we take from many systems to reach a more informed conclusion and also to make better choices when choosing to buy and hold, either to sell or keep holding or to buy more.
SEIUSDT. The ending diagonal points to a reversal. The main low happened March followed by a lower low this month, August. The low
SEI USDT LONG SIGNAL#9. .SEI/USDT – Trade Setup (LONG)
📈 Position Type: LONG
🕒 Timeframe: 1H
📊 Market: Futures
💰 Entry Zone:
0.04139
🛑 Stop-Loss:
0.04025
🎯 Take-Profit Targets:
• TP1: 0.04212
• TP2: 0.04320
• TP3: 0.04410
• TP4. 0.04493
Tp5.
⚙️ Leverage:
5*10
▫️ After TP1, move SL to Entry + 0.2%.
▪️ Exit Plan:
• 40% at TP1
• 20% at TP2
• 20% at TP3
20% at TP4
📌 Risk Management:
Risk only 1–2% of your capital per trade.
⚠️ Always check and confirm the setup on your chart before entering the
SEI at macro floor: base recovery toward $0.05021The Macro Picture 🗺️
SEI ground down from the $0.07979 macro ceiling all the way to the $0.04105 macro floor and has flattened onto it at $0.04180. The long, steady bleed has given way to a base right on support — exhaustion rather than continuation.
The Setup ⚙️
The Accumulation Zone 🟢
$0.04105–0.04180 is where the selling has dried up. Macro Support has held on retest, and this is the demand shelf a recovery would build from.
The Decision Point 🔴
$0.05971 (Local High) is the structural gate
SEI USDT LONG SIGNAL#132. SEI/USDT – Trade Setup (LONG)
📈 Position Type: LONG
🕒 Timeframe: 1H
📊 Market: Futures
💰 Entry Zone:
0.04515
🛑 Stop-Loss:
0.043330
🎯 Take-Profit Targets:
• TP1: 0.04695
• TP2: 0.04763
• TP3: 0.04897
• TP4: 0.05060
⚙️ Leverage:
5*10
▫️ After TP1, move SL to Entry + 0.2%.
▪️ Exit Plan:
• 40% at TP1
• 20% at TP2
• 20% at TP3
20%. at. TP4
📌 Risk Management:
Risk only 1–2% of your capital per trade.
⚠️ Always check and confirm the setup on your chart before entering the tra
SEI USDT LONG SIGNAL#93 SEI /USDT – Trade Setup (LONG)
📈 Position Type: LONG
🕒 Timeframe: 1H
📊 Market: Futures
💰 Entry Zone:
0.04563
0.04490
🛑 Stop-Loss:
0.04425
🎯 Take-Profit Targets:
• TP1: 0.04679
• TP2: 0.04868
• TP3: 0.05083
• TP4: 0.05318
⚙️ Leverage:
5 *10
▫️ After TP1, move SL to Entry + 0.2%.
▪️ Exit Plan:
• 40% at TP1
• 20% at TP2
• 20% at TP3
20% at. TP4
📌 Risk Management:
Risk only 1–2% of your capital per trade.
⚠️ Always check and confirm the setup on your chart before entering t
SEI USDT LONG SIGNAL#73. SEI/USDT – Trade Setup (LONG)
📈 Position Type: LONG
🕒 Timeframe: 1H
📊 Market: Futures
💰 Entry Zone:
0.04774
0.04674
🛑 Stop-Loss:
0.04580
🎯 Take-Profit Targets:
• TP1: 0.04895
• TP2: 0.05028
• TP3: 0.05153
• TP4: 0.05274
⚙️ Leverage:
5–10x
▫️ After TP1, move SL to Entry + 0.2%.
▪️ Exit Plan:
• 40% at TP1
• 20% at TP2
• 20% at TP3
20% at. TP4
📌 Risk Management:
Risk only 1–2% of your capital per trade.
⚠️ Always check and confirm the setup on your chart before entering the