Sent - Bullish - RR: 1:11Dear my friends,
Observing the SENT/USDT trading pair on the 4H timeframe, I spotted an opportunity and would like to share it with you.Looking at the downtrend line since March, the price has truly respected this trendline. After touching the trendline 3 times, the price fell back each time. Only on the fourth touch did the price actually break out of the trendline. However, it was then pushed back down to the previous support zone. After that, it continued to accumulate, bounced up, and was subsequently rejected back to the support area again.Right now, the price is forming a very small ascending triangle below this trendline and above the support zone.I switched to a higher timeframe and was really surprised to see a very clear bullish divergence on the daily chart.I then started looking at the resistance zones above to identify take-profit levels. I found two quite distant TPs: one at the $0.25 area and another at the $0.46 area.So, we would have:
Entry: at the current price
TP1: 0.25
TP2: 0.46
RR: 1:11 I hope my sharing will be useful for everyone.
In-depth trading ideas
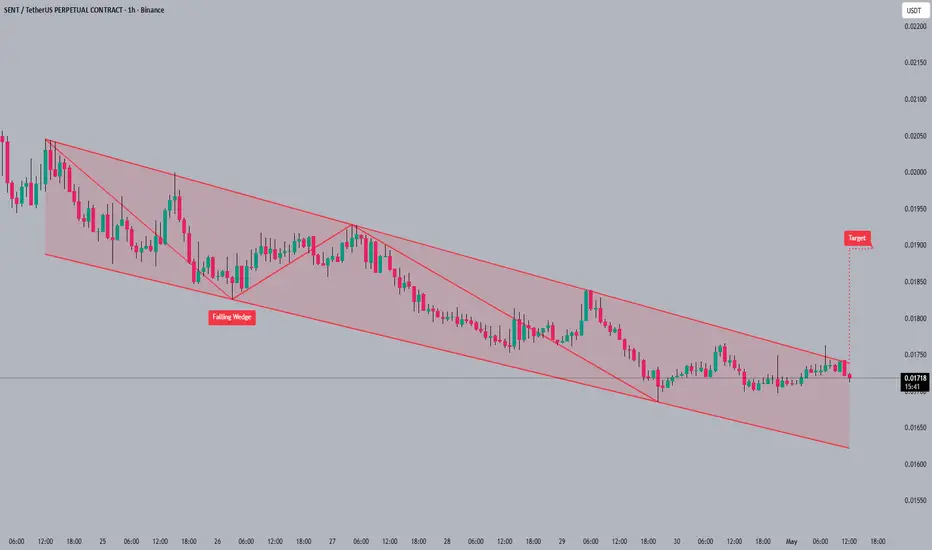
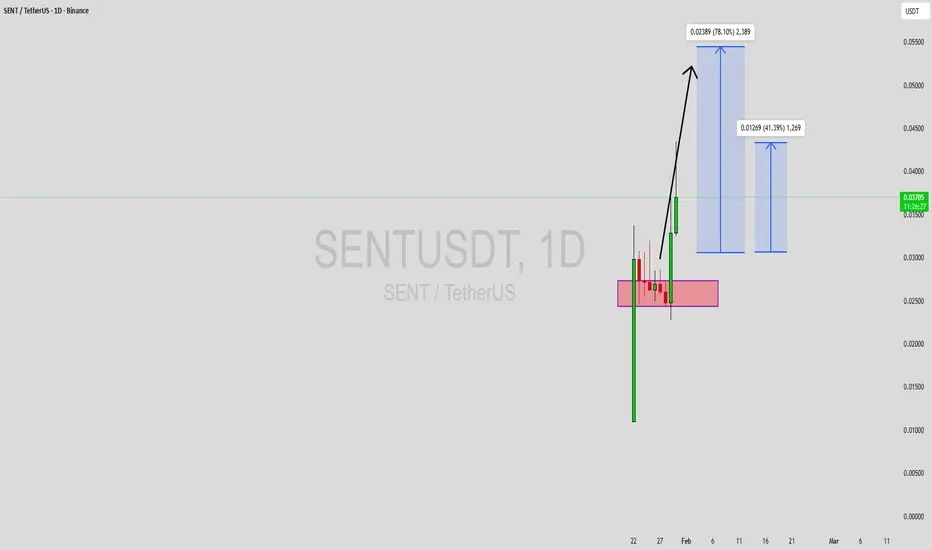
SENTUSDT Forming Falling WedgeSENTUSDT is forming a clear falling wedge pattern, a classic bullish wave signal that often indicates an upcoming breakout. The price has been consolidating within a narrowing range, suggesting that selling pressure is weakening while buyers are beginning to regain control. With consistent volume confirming accumulation at lower levels, the setup hints at a potential bullish breakout soon. The projected move could lead to an impressive gain of around 90% to 100% once the price breaks above the wedge resistance.
This falling wedge pattern is typically seen at the end of downtrends or corrective phases, and it represents a potential shift in market sentiment from bearish to bullish. Traders closely watching SENTUSDT are noting the strengthening momentum as it nears a breakout zone. Good trading volume adds confidence to this pattern, showing that market participants are positioning early in anticipation of a sustained upward move.
Investors' growing interest in SENTUSDT reflects rising confidence in the project's long-term fundamentals and current technical strength. If the breakout confirms with sustained buying volume, this could mark the start of a fresh bullish leg. The ongoing consolidation phase suggests that buyers are steadily accumulating positions while bearish pressure continues to weaken, creating favorable conditions for further upside.
Traders might find this a valuable setup for medium-term gains, especially as the falling wedge pattern nears completion and buying momentum continues to accelerate. A confirmed breakout above resistance could attract additional market participation and potentially drive the price toward its projected upside target over the coming weeks.
✅ Show your support by hitting the like button!
✅ Leave a comment below! (What is your opinion about this coin?)
Your feedback and engagement keep me inspired to share more insightful market analysis with you!
SENTUSDT Forming Falling WedgeSENTUSDT is forming a clear falling wedge pattern, a classic bullish wave signal that often indicates an upcoming breakout. The price has been consolidating within a narrowing range, suggesting that selling pressure is weakening while buyers are beginning to regain control. With consistent volume confirming accumulation at lower levels, the setup hints at a potential bullish breakout soon. The projected move could lead to an impressive gain of around 90% to 100% once the price breaks above the wedge resistance.
This falling wedge pattern is typically seen at the end of downtrends or corrective phases, and it represents a potential shift in market sentiment from bearish to bullish. Traders closely watching SENTUSDT are noting the strengthening momentum as it nears a breakout zone. The healthy trading volume adds confidence to this pattern, showing that market participants are positioning early in anticipation of a reversal.
Investors’ growing interest in SENTUSDT reflects rising confidence in the project's long-term fundamentals and current technical strength. If the breakout confirms with sustained volume, this could mark the start of a fresh bullish leg. The current market structure suggests that buyers are steadily gaining control while bearish pressure continues to weaken.
Traders might find this a valuable setup for medium-term gains, especially as the falling wedge pattern completes and buying momentum accelerates. A confirmed breakout could attract additional market participation and potentially drive the price toward significantly higher levels in the coming weeks.
✅ Show your support by hitting the like button!
✅ Leaving a comment below! (What is your opinion about this Coin?)
Your feedback and engagement keep me inspired to share more insightful market analysis with you!
SENTUSDT 1D#SENT has broken above both the falling wedge resistance and the SMA50 on the daily chart. The daily candle has not closed yet, but RSI and MACD are indicating the potential for further bullish continuation.
The potential upside targets are:
🎯 $0.01923
🎯 $0.02182
🎯 $0.02391
🎯 $0.02600
🎯 $0.02898
🎯 $0.03278
⚠️ Always remember to use a tight stop-loss and maintain proper risk management.
SENTUSDT Forming Falling WedgeSENTUSDT is forming a clear falling wedge pattern, a classic bullish wave signal that often indicates an upcoming breakout. The price has been consolidating within a narrowing range, suggesting that selling pressure is weakening while buyers are beginning to regain control. With consistent volume confirming accumulation at lower levels, the setup hints at a potential bullish breakout soon. The projected move could lead to an impressive gain of around 90% to 100% once the price breaks above the wedge resistance.
This falling wedge pattern is typically seen at the end of downtrends or corrective phases, and it represents a potential shift in market sentiment from bearish to bullish. Traders closely watching SENTUSDT are noting the strengthening momentum as it nears a breakout zone. The strong trading volume adds confidence to this setup, showing that market participants may be positioning early in anticipation of a trend reversal.
Investors’ growing interest in SENTUSDT reflects increasing confidence in the project's long-term potential and current technical strength. If the breakout confirms with sustained volume, this could mark the beginning of a fresh bullish leg. Traders may find this a valuable setup for medium-term gains, especially as the falling wedge pattern approaches completion and buying momentum continues to build.
✅ Show your support by hitting the like button!
✅ Leave a comment below! (What is your opinion about this coin?)
Your feedback and engagement keep me inspired to share more insightful market analysis with you!
SENTUSDT 1D#SENT is moving inside a falling wedge pattern on the daily chart. In case of a breakout above the wedge resistance and the daily EMA50, the potential upside targets are:
🎯 $0.01923
🎯 $0.02182
🎯 $0.02391
🎯 $0.02600
🎯 $0.02898
🎯 $0.03278
⚠️ Always use a tight stop-loss and maintain proper risk management.
SENTUSDT Forming Falling WedgeSENTUSDT is forming a clear falling wedge pattern, a classic bullish reversal signal that often indicates an upcoming breakout. The price has been consolidating within a narrowing range, suggesting that selling pressure is weakening while buyers are beginning to regain control. With consistent volume confirming accumulation at lower levels, the setup hints at a potential bullish breakout soon. The projected move could lead to an impressive gain of around 90% to 100% once the price breaks above the wedge resistance.
This falling wedge pattern is typically seen at the end of downtrends or corrective phases, and it represents a potential shift in market sentiment from bearish to bullish. Traders closely watching SENTUSDT are noting the strengthening momentum as it nears a breakout zone. The good trading volume adds confidence to this pattern, showing that market participants are positioning early in anticipation of a reversal.
Investors’ growing interest in SENTUSDT reflects rising confidence in the project’s long-term fundamentals and current technical strength. If the breakout confirms with sustained volume, this could mark the start of a fresh bullish leg. Traders might find this a valuable setup for medium-term gains, especially as the wedge pattern completes and buying momentum accelerates.
✅ Show your support by hitting the like button and
✅ Leaving a comment below! (What is your opinion about this Coin?)
Your feedback and engagement keep me inspired to share more insightful market analysis with you!
SENT READY FOR BREAKOUT🔥 Fortune AI Radar — SEED_ALEXDRAYM_SHORTINTEREST2:SENT
Fresh activity detected on SEED_ALEXDRAYM_SHORTINTEREST2:SENT today.
Data suggests increasing market interest & buyers stepping in.
Technicals currently lean bullish, with momentum trending upward.
Whales showing hints of accumulation and hype rising among trader
SENT REVERSAL LOADING🔥 Fortune AI Radar — SEED_ALEXDRAYM_SHORTINTEREST2:SENT
Fresh activity detected on SEED_ALEXDRAYM_SHORTINTEREST2:SENT today.
Data suggests increasing market interest & buyers stepping in.
Technicals currently lean bullish, with momentum trending upward.
Whales showing hints of accumulation and hype rising among trader
SENT ON RADAR🔥 Fortune AI Radar — SEED_ALEXDRAYM_SHORTINTEREST2:SENT
Fresh activity detected on SEED_ALEXDRAYM_SHORTINTEREST2:SENT today.
Data suggests increasing market interest & buyers stepping in.
Technicals currently lean bullish, with momentum trending upward.
Whales showing hints of accumulation and hype rising among traders.
This coin is flashing strong signals on short-term charts — worth keeping an eye on 👀
Not financial advice — always research before taking decisions
SENTUSDT Forming Bullish MomentumSENTUSDT is forming a clear bullish momentum pattern, a classic bullish reversal signal that often indicates an upcoming breakout. The price has been consolidating within a narrowing range, suggesting that selling pressure is weakening while buyers are beginning to regain control. With consistent volume confirming accumulation at lower levels, the setup hints at a potential bullish breakout soon. The projected move could lead to an impressive gain of around 90% to 100% once the price breaks above the wedge resistance.
This bullish momentum pattern is typically seen at the end of downtrends or corrective phases, and it represents a potential shift in market sentiment from bearish to bullish. Traders closely watching SENTUSDT are noting the strengthening momentum as it nears a breakout zone. The good trading volume adds confidence to this pattern, showing that market participants are positioning early in anticipation of a reversal.
Investors’ growing interest in SENTUSDT reflects rising confidence in the project’s long-term fundamentals and current technical strength. If the breakout confirms with sustained volume, this could mark the start of a fresh bullish leg. Traders might find this a valuable setup for medium-term gains, especially as the pattern completes and buying momentum accelerates.
✅ Show your support by hitting the like button and
✅ Leaving a comment below! (What is your opinion about this Coin?)
Your feedback and engagement keep me inspired to share more insightful market analysis with you!
SENT / USDT — HTF Demand Area | Risk-Managed Long SetupSENT / USDT is approaching a key demand zone.
If price shows a strong reaction from our entry area ($0.03134 – $0.02921), we can expect a potential bounce towards the $0.04169 target.
The invalidation level is placed slightly lower, which increases risk, so proper risk management is required.
Always wait for strong confirmation before entering.
Sentient SENT price analysis🧠 How can the “Sentient” project become a unicorn?
Easy — just follow the scenario we’ve already drawn 😏
(Current market cap: ~$250M)
📊 On OKX:SENTUSDT , we’re seeing:
• solid trading volumes
• price hitting a liquidity zone
• a correction already in progress
📉 Key idea: The weaker the correction, the stronger the next impulsive move.
🔻 Correction levels are marked on the chart.
Critical zone: $0.25
Below that level, #SENT loses attractiveness for us.
🛡 Conservative approach: Wait for price to securely break and hold above the trendline, then consider entries.
For now: 👀 Observe
📐 Make your own decisions
😴 …or simply ignore it
❓Do you see #SENT as a future unicorn, or just another short-term hype?
______________
◆ Follow us ❤️ for daily crypto insights & updates!
🚀 Don’t miss out on important market moves
🧠 DYOR | This is not financial advice, just thinking out loud
SENT Breakout Confirmed — Next Leg is Loading!#SENT
SEED_ALEXDRAYM_SHORTINTEREST2:SENT has successfully executed a textbook breakout! After a strategic liquidity sweep that cleared out early sellers, the price launched into a significant upward move.
We are currently observing a healthy pullback to retest the newly formed support zone between 0.0305 – 0.0285. This retest is a crucial "loading zone" to gather momentum for a powerful bullish continuation. If the support holds, our primary targets are set at the 2.618 ($0.050) and 3.618 ($0.060) Fibonacci extension levels.
However, disciplined trading requires a plan for every scenario. We must remain cautious; if the support fails to sustain the price and we see a breakdown, the bias shifts.
Specifically, if the price drops below the previous swing low, the bullish structure will be invalidated. Such a move would signal a trend reversal from bullish to bearish, potentially leading to a deeper "lower-low" sequence.
Keep a close eye on the 4H candle closes to confirm if the support is flipping back to resistance.
SENTUSDT Forming Bullish WaveSENTUSDT is forming a clear bullish wave pattern, a classic bullish reversal signal that often indicates an upcoming breakout. The price has been consolidating within a narrowing range, suggesting that selling pressure is weakening while buyers are beginning to regain control. With consistent volume confirming accumulation at lower levels, the setup hints at a potential bullish breakout soon. The projected move could lead to an impressive gain of around 60% to 70% once the price breaks above the wedge resistance.
This falling wedge pattern is typically seen at the end of downtrends or corrective phases, and it represents a potential shift in market sentiment from bearish to bullish. Traders closely watching SENTUSDT are noting the strengthening momentum as it nears a breakout zone. The good trading volume adds confidence to this pattern, showing that market participants are positioning early in anticipation of a reversal.
Investors’ growing interest in SENTUSDT reflects rising confidence in the project’s long-term fundamentals and current technical strength. If the breakout confirms with sustained volume, this could mark the start of a fresh bullish leg. Traders might find this a valuable setup for medium-term gains, especially as the wedge pattern completes and buying momentum accelerates.
✅ Show your support by hitting the like button and
✅ Leaving a comment below! (What is your opinion about this Coin?)
Your feedback and engagement keep me inspired to share more insightful market analysis with you!