SENTIENT/USD TETHER
No trades
No trades
In-depth trading ideas
SENT Poised to Climb: Key Technicals Align for a Long MoveBYBIT:SENTUSDT.P
SENT — Long
Stop loss: 0.014547
Take profit: 0.014944
SENT is showing bullish potential 📈. On the 2h chart, the SMA20 at 0.0152 is above the SMA50 at 0.0148, indicating a positive trend alignment. Aroon indicators confirm strength with Aroon Up at 85.7, heavily outweighing Aroon Down at 50. Parabolic SAR at 0.0144 suggests support is building near current price levels. RSI sits at 45.7, showing room for upward momentum without overbought pressure. Although CCI20 is
SENT at a Critical Resistance — Breakout or Rejection?SENT/USDT is currently in a very interesting position as price is testing the main Descending Trendline that has been pressuring price action for several months.
The yellow downtrend line shows a consistent structure of Lower Highs (LH) since the peak around $0.02850. As long as price remains below this trendline, bearish pressure has not been fully eliminated.
However, the current price around $0.01495 is beginning to approach this trendline, making this area a key decision zone for the next
SENTUSDT 1D#SENT is on the verge of a potential breakout. Keep an eye on the daily chart. In case of a breakout above the descending resistance and the Ichimoku Cloud, the potential upside targets are:
🎯 $0.01772
🎯 $0.01963
🎯 $0.02154
🎯 $0.02426
🎯 $0.02772
⚠️ Always use a tight stop-loss and maintain proper risk management.
Sent - Bullish - RR: 1:11Dear my friends,
Observing the SENT/USDT trading pair on the 4H timeframe, I spotted an opportunity and would like to share it with you.Looking at the downtrend line since March, the price has truly respected this trendline. After touching the trendline 3 times, the price fell back each time. Only on the fourth touch did the price actually break out of the trendline. However, it was then pushed back down to the previous support zone. After that, it continued to accumulate, bounced up, and was su
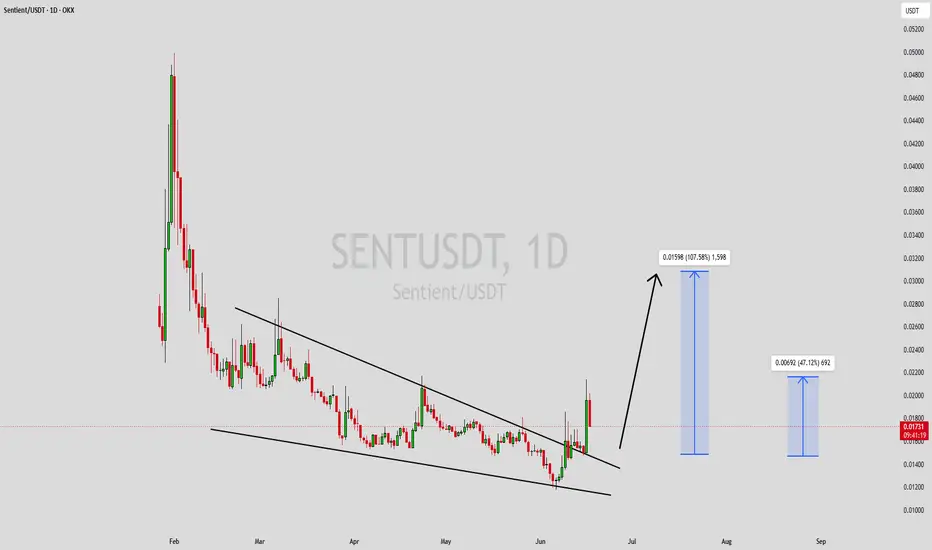
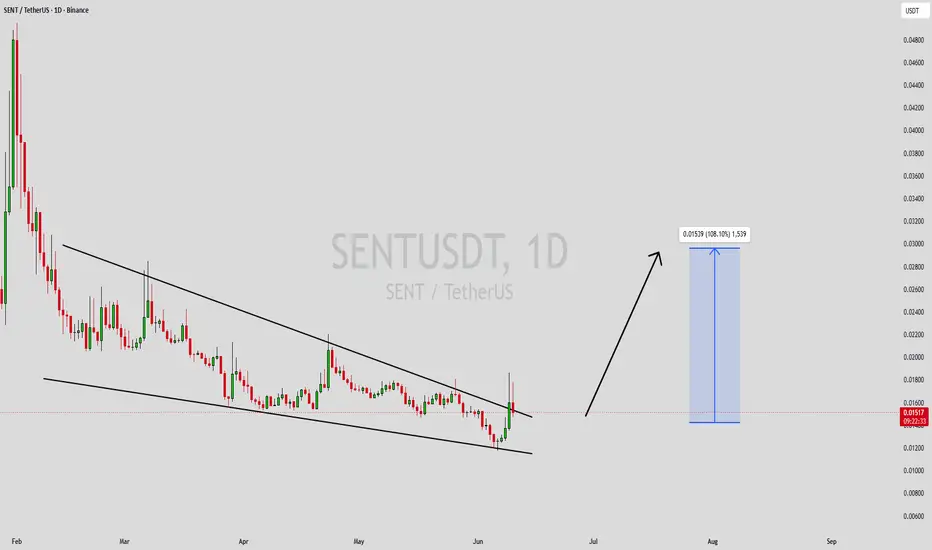
SENTUSDT Forming Falling WedgeSENTUSDT is forming a clear falling wedge pattern, a classic bullish wave signal that often indicates an upcoming breakout. The price has been consolidating within a narrowing range, suggesting that selling pressure is weakening while buyers are beginning to regain control. With consistent volume confirming accumulation at lower levels, the setup hints at a potential bullish breakout soon. The projected move could lead to an impressive gain of around 90% to 100% once the price breaks above the w
SENTUSDT 1D#SENT has broken above both the falling wedge resistance and the SMA50 on the daily chart. The daily candle has not closed yet, but RSI and MACD are indicating the potential for further bullish continuation.
The potential upside targets are:
🎯 $0.01923
🎯 $0.02182
🎯 $0.02391
🎯 $0.02600
🎯 $0.02898
🎯 $0.03278
⚠️ Always remember to use a tight stop-loss and maintain proper risk management.
SENTUSDT Forming Falling WedgeSENTUSDT is forming a clear falling wedge pattern, a classic bullish wave signal that often indicates an upcoming breakout. The price has been consolidating within a narrowing range, suggesting that selling pressure is weakening while buyers are beginning to regain control. With consistent volume confirming accumulation at lower levels, the setup hints at a potential bullish breakout soon. The projected move could lead to an impressive gain of around 90% to 100% once the price breaks above the w
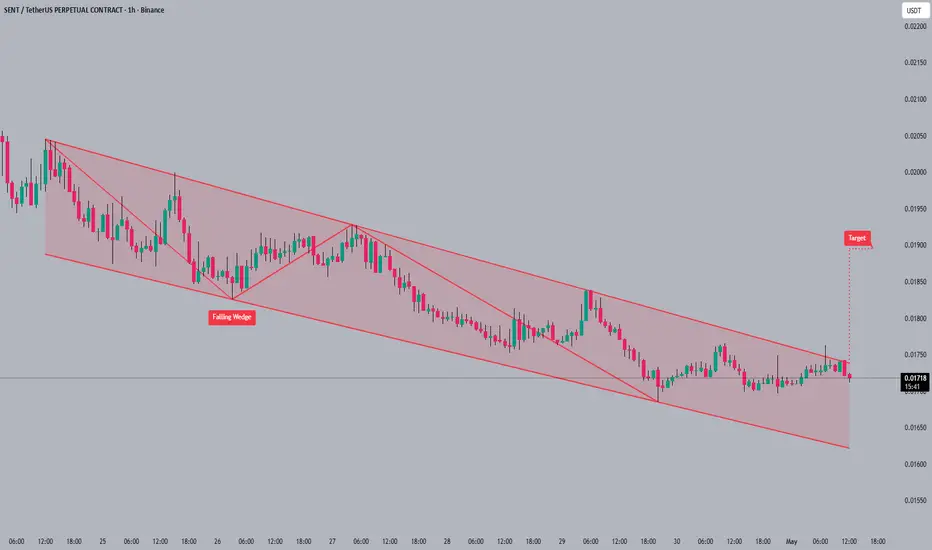
SENTUSDT 1D#SENT is moving inside a falling wedge pattern on the daily chart. In case of a breakout above the wedge resistance and the daily EMA50, the potential upside targets are:
🎯 $0.01923
🎯 $0.02182
🎯 $0.02391
🎯 $0.02600
🎯 $0.02898
🎯 $0.03278
⚠️ Always use a tight stop-loss and maintain proper risk management.
SENTUSDT Forming Falling WedgeSENTUSDT is forming a clear falling wedge pattern, a classic bullish reversal signal that often indicates an upcoming breakout. The price has been consolidating within a narrowing range, suggesting that selling pressure is weakening while buyers are beginning to regain control. With consistent volume confirming accumulation at lower levels, the setup hints at a potential bullish breakout soon. The projected move could lead to an impressive gain of around 90% to 100% once the price breaks above t
SENT READY FOR BREAKOUT🔥 Fortune AI Radar — SEED_ALEXDRAYM_SHORTINTEREST2:SENT
Fresh activity detected on SEED_ALEXDRAYM_SHORTINTEREST2:SENT today.
Data suggests increasing market interest & buyers stepping in.
Technicals currently lean bullish, with momentum trending upward.
Whales showing hints of accumulation and hype rising among trader
SENT REVERSAL LOADING🔥 Fortune AI Radar — SEED_ALEXDRAYM_SHORTINTEREST2:SENT
Fresh activity detected on SEED_ALEXDRAYM_SHORTINTEREST2:SENT today.
Data suggests increasing market interest & buyers stepping in.
Technicals currently lean bullish, with momentum trending upward.
Whales showing hints of accumulation and hype rising among trader
SENT ON RADAR🔥 Fortune AI Radar — SEED_ALEXDRAYM_SHORTINTEREST2:SENT
Fresh activity detected on SEED_ALEXDRAYM_SHORTINTEREST2:SENT today.
Data suggests increasing market interest & buyers stepping in.
Technicals currently lean bullish, with momentum trending upward.
Whales showing hints of accumulation and hype rising among traders.
This coin is flashing strong signals on short-term charts — worth keeping an eye on 👀
Not financial advice — always research before taking decisions
SENTUSDT Forming Bullish MomentumSENTUSDT is forming a clear bullish momentum pattern, a classic bullish reversal signal that often indicates an upcoming breakout. The price has been consolidating within a narrowing range, suggesting that selling pressure is weakening while buyers are beginning to regain control. With consistent volume confirming accumulation at lower levels, the setup hints at a potential bullish breakout soon. The projected move could lead to an impressive gain of around 90% to 100% once the price breaks abov
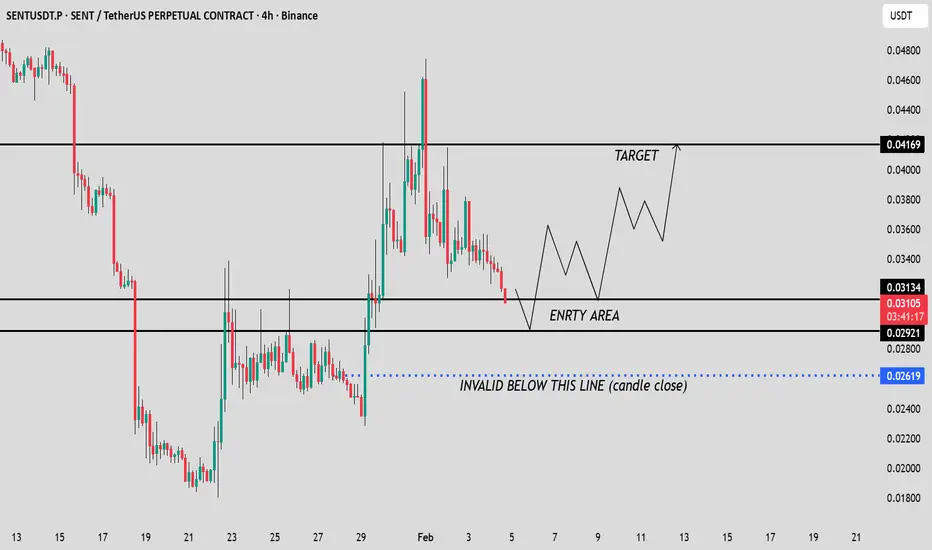
SENT / USDT — HTF Demand Area | Risk-Managed Long SetupSENT / USDT is approaching a key demand zone.
If price shows a strong reaction from our entry area ($0.03134 – $0.02921), we can expect a potential bounce towards the $0.04169 target.
The invalidation level is placed slightly lower, which increases risk, so proper risk management is required.
Always wait for strong confirmation before entering.
Sentient SENT price analysis🧠 How can the “Sentient” project become a unicorn?
Easy — just follow the scenario we’ve already drawn 😏
(Current market cap: ~$250M)
📊 On OKX:SENTUSDT , we’re seeing:
• solid trading volumes
• price hitting a liquidity zone
• a correction already in progress
📉 Key idea: The weaker the correction, the stronger the next impulsive move.
🔻 Correction levels are marked on the chart.
Critical zone: $0.25
Below that level, #SENT loses attractiveness for us.
🛡 Conservative approach: Wait for pri
SENT Breakout Confirmed — Next Leg is Loading!#SENT
SEED_ALEXDRAYM_SHORTINTEREST2:SENT has successfully executed a textbook breakout! After a strategic liquidity sweep that cleared out early sellers, the price launched into a significant upward move.
We are currently observing a healthy pullback to retest the newly formed support zone between 0.0305 – 0.0285. This retest is a crucial "loading zone" to gather momentum for a powerful bullish continuation. If the support holds, our primary targets are set at the 2.618 ($0.050) and 3.618 (
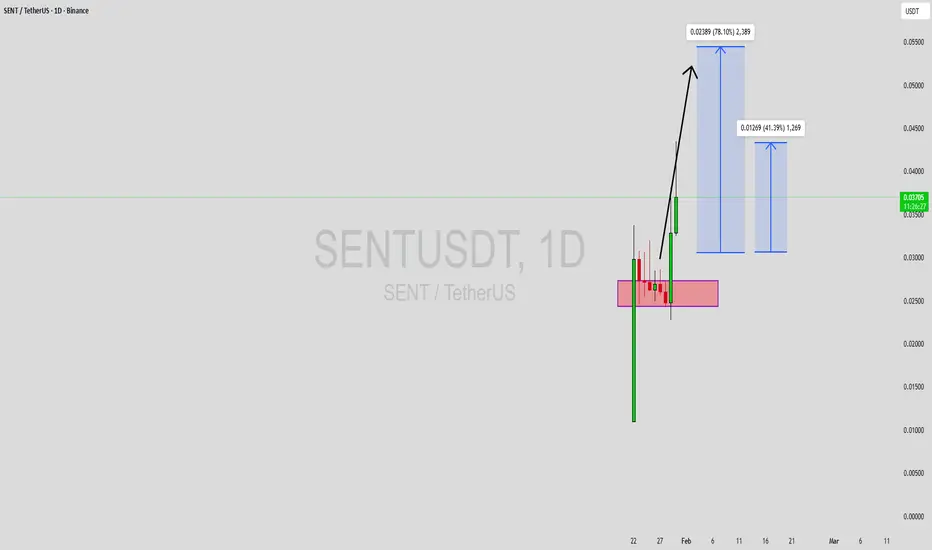
SENTUSDT Forming Bullish WaveSENTUSDT is forming a clear bullish wave pattern, a classic bullish reversal signal that often indicates an upcoming breakout. The price has been consolidating within a narrowing range, suggesting that selling pressure is weakening while buyers are beginning to regain control. With consistent volume confirming accumulation at lower levels, the setup hints at a potential bullish breakout soon. The projected move could lead to an impressive gain of around 60% to 70% once the price breaks above the