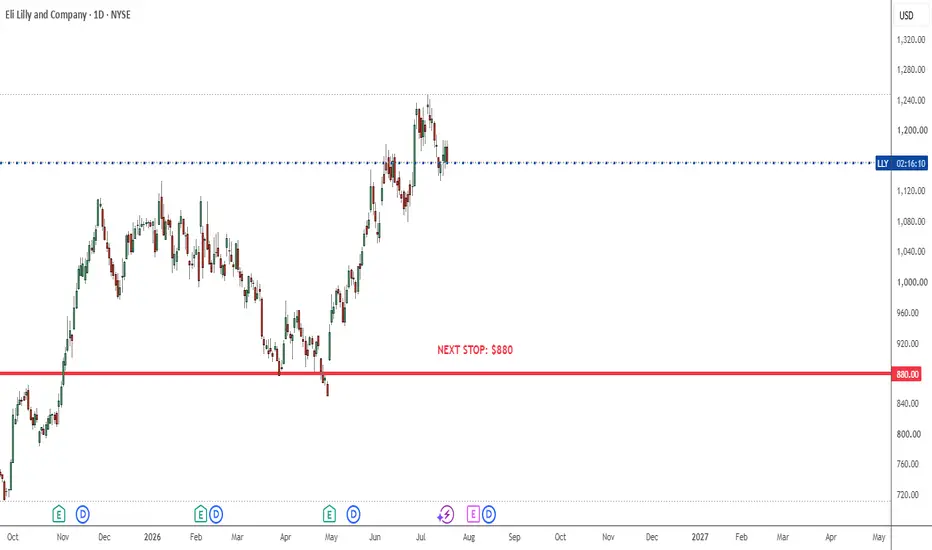
Chart Whisperer | Intuitive Market AnalysisI don’t look at the markets the way everyone else does. I consider myself a bit of a chart whisperer—not because I have a secret algorithm, but because years of staring at the screens have given me a deeply personal, intuitive feel for price action. My trading style is anchored in reading the natura
LLL
Eli Lilly and Company Thailand Depositary Receipts Repr 1 Sh
No trades
No trades
Compare with Eli Lilly and Company Thailand Depositary Receipts Repr 1 Sh
908.56 THB
651.10 B THB
2.06 T THB
847.09 M
Next report date
—
Report period
—
EPS estimate
—
Revenue estimate
—
Details
Sector
Industry
CEO
David A. Ricks
Website
Headquarters
Indianapolis
Founded
1876
ISIN
TH3932126701
FIGI
BBG022YHKNC2
Identifiers
ISIN TH3932126701
Eli Lilly & Co. engages in the discovery, development, manufacture, and sale of pharmaceutical products. The firm's products include diabetes, oncology, immunology, neuroscience, and other products and therapies. The company was founded by Eli Lilly on May 10, 1876 and is headquartered in Indianapolis, IN.
Could this be E-Lie Lilly? Institutions Just Showed Their Hand!There's an old saying we have in the South..."A lie doesn't care who tells it." That just simply means that when a lie wants to get out and be believed as truth, it doesn't care what method is used to accomplish that. Over the years, I've made my own addition to that..."A lie doesn't care who tell
ELI LILLY Strong RSI Bearish Divergence targets $1000.Eli Lilly (LLY) has been trading within a 14-month Channel Up and is currently on a Higher Highs rejection. The 1D RSI is under Lower Highs however, displaying a technical Bearish Divergence that we last saw within this pattern on the January 08 2026 High.
The result of this formation was a Bearish
LLY | Continued stock growth- Timeframe: Weekly
- Trade type: Buy stop order
- Price: 1,196.29
- Take Profit: Open
- Stop Loss: 1,134.40 (-5.20 %)
Idea: Long on a breakout above last week's high - bullish momentum continuation.
Entry: Buy stop above last week’s high.
Stop-loss: Below the low of the same candle.
If the weekly
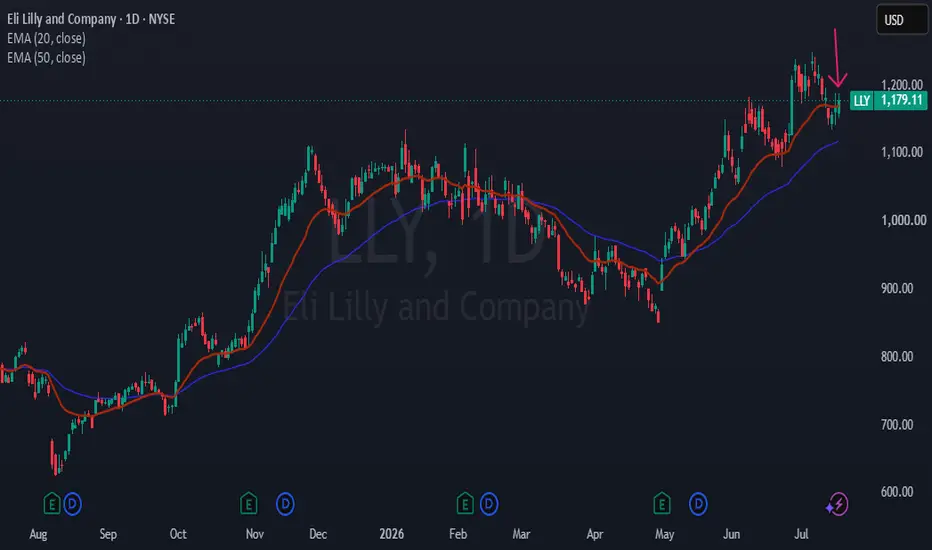
LLY: Buyers Return as Pullback Creates Entry OpportunityLLY is beginning to attract renewed buying interest following its recent retracement. The stock remains in a strong uptrend, continuing to make higher highs and higher lows while trading above well-aligned 20 and 50-day moving averages, signaling that bullish momentum remains intact.
Eli Lilly & Co
Fake, But Don't Break! Eli Lilly Still Has a Structural ProblemHappy Monday, Traders. For the past several day, LLY has been giving Fake-Out After Fake-Out to the upside, looking like its going to tske off again… But the Structure STILL Says DOWN. We have been following Eli Lilly since this H1 Break of Structure DOWN back on 6/29. And since then? This struct
LLY: Healthy Pullback… Or Bigger Problem Ahead?LLY… Uh Oh… Lilly Looking a Little Sick Here?
After a strong bullish run higher, LLY finally gave us something we had not seen in a while:
➡️ An H1 BOS DOWN
And more importantly…
…the market returned directly back into the H1 BOS Supply Source for the retest.
That retest matters.
Because once
LLY: 15-Month Base on Base & 235% Volume BreakoutThe Setup:
Eli Lilly ( NYSE:LLY ) is capitalizing on a massive fundamental double-catalyst—including new broad Medicare coverage for its weight-loss drugs—to trigger an explosive move. The stock has carved out a massive Base-on-Base structure on the monthly chart. After a deliberate retail shakeo
LLY- Breakout Above Persistent Resistance Opens Strong UpsideNYSE:LLY shares jumped over 7% on Friday on strong volume after positive regulatory and policy developments. The European Medicines Agency’s Committee for Medicinal Products for Human Use backed its cancer drug Jaypirca, while the company’s popular weight-loss treatments are also expected to be inc
Eli Lilly Rebounds From 20-Day Support as Uptrend ContinuesLLY is rebounding after retracing to its 20-day moving average, with buyers stepping in to support the trend. The stock remains in a strong uptrend, making higher highs and higher lows while trading above its well-aligned 20- and 50-day moving averages.
Eli Lilly & Co. is a $1.14 trillion market-ca
See all ideas
Summarizing what the indicators are suggesting.
Oscillators
Neutral
SellBuy
Strong sellStrong buy
Strong sellSellNeutralBuyStrong buy
Oscillators
Neutral
SellBuy
Strong sellStrong buy
Strong sellSellNeutralBuyStrong buy
Summary
Neutral
SellBuy
Strong sellStrong buy
Strong sellSellNeutralBuyStrong buy
Summary
Neutral
SellBuy
Strong sellStrong buy
Strong sellSellNeutralBuyStrong buy
Summary
Neutral
SellBuy
Strong sellStrong buy
Strong sellSellNeutralBuyStrong buy
Moving Averages
Neutral
SellBuy
Strong sellStrong buy
Strong sellSellNeutralBuyStrong buy
Moving Averages
Neutral
SellBuy
Strong sellStrong buy
Strong sellSellNeutralBuyStrong buy
6.034% YTM
Maturity dateSep 14, 2043
Coupon1.63% (Fixed)
5.981% YTM
Maturity dateMay 20, 2066
Coupon5.70% (Fixed)
5.981% YTM
Maturity dateAug 14, 2064
Coupon5.20% (Fixed)
5.974% YTM
Maturity dateOct 15, 2065
Coupon5.65% (Fixed)
5.964% YTM
Maturity dateFeb 9, 2064
Coupon5.10% (Fixed)
5.961% YTM
Maturity dateFeb 27, 2063
Coupon4.95% (Fixed)
5.914% YTM
Maturity dateFeb 12, 2065
Coupon5.60% (Fixed)
5.887% YTM
Maturity dateMar 15, 2059
Coupon4.15% (Fixed)
5.887% YTM
Maturity dateFeb 27, 2053
Coupon4.88% (Fixed)
5.886% YTM
Maturity dateFeb 9, 2054
Coupon5.00% (Fixed)
5.873% YTM
Maturity dateAug 14, 2054
Coupon5.05% (Fixed)
See all LLY23 bonds