In-depth trading ideas
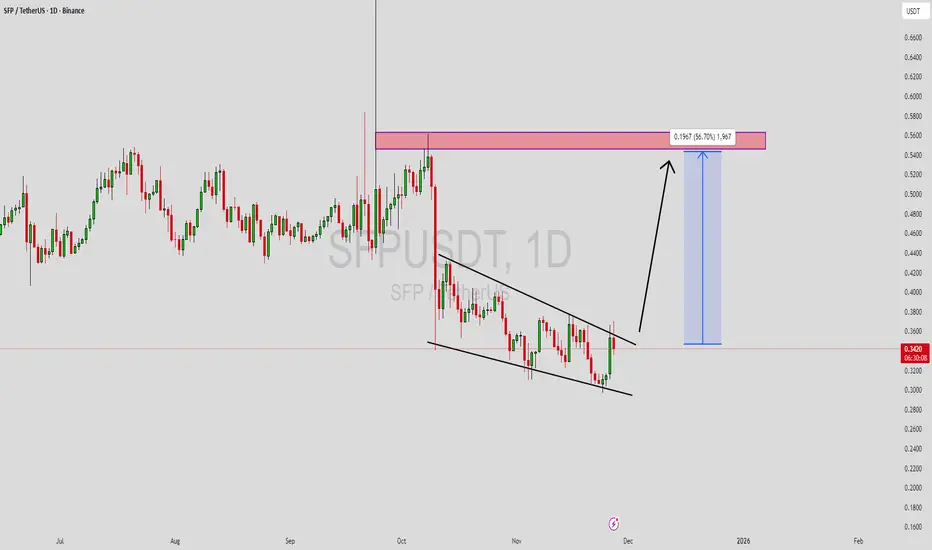
SFPUSDT Forming Falling WedgeSFPUSDT is forming a clear falling wedge pattern, a classic bullish wave signal that often indicates an upcoming breakout. The price has been consolidating within a narrowing range, suggesting that selling pressure is weakening while buyers are beginning to regain control. With consistent volume confirming accumulation at lower levels, the setup hints at a potential bullish breakout soon. The projected move could lead to an impressive gain of around 70% to 80% once the price breaks above the wedge resistance.
This falling wedge pattern is typically seen at the end of downtrends or corrective phases, and it represents a potential shift in market sentiment from bearish to bullish. Traders closely watching SFPUSDT are noting the strengthening momentum as it nears a breakout zone. Good trading volume adds confidence to this pattern, showing that market participants are positioning early in anticipation of a reversal.
Investors’ growing interest in SFPUSDT reflects rising confidence in the project's long-term fundamentals and current technical strength. If the breakout confirms with sustained volume, this could mark the start of a fresh bullish leg. The current price structure suggests that buyers are steadily gaining strength while bearish pressure continues to diminish, creating a favorable environment for a strong upward move.
Traders might find this a valuable setup for medium-term gains, especially as the falling wedge pattern approaches completion and buying momentum continues to build. A confirmed breakout above resistance could attract additional buying interest and potentially drive the price toward its projected upside target over the coming weeks.
✅ Show your support by hitting the like button!
✅ Leave a comment below! (What is your opinion about this coin?)
Your feedback and engagement keep me inspired to share more insightful market analysis with you!
SFPUSDT 1D#SFP is moving inside a descending channel on the daily chart. In case of a breakout above the channel resistance and the daily SMA50, the potential upside targets are:
🎯 $0.2533
🎯 $0.2689
🎯 $0.2844
🎯 $0.3065
🎯 $0.3347
⚠️ Always remember to use a tight stop-loss and maintain proper risk management.
SFPUSDT Forming Bullish MomentumSFPUSDT is currently forming a clear bullish momentum pattern, a classic wave structure that often signals an upcoming breakout. The price has been consolidating within a narrowing range, indicating that selling pressure is gradually weakening while buyers are beginning to regain control. With consistent volume supporting accumulation at lower levels, the setup suggests a strong potential for a bullish breakout in the near term.
If the price breaks above the wedge resistance, the projected move could be significant, with a potential gain of around 90% to 100%. This type of bullish momentum pattern is typically seen at the end of downtrends or corrective phases, signaling a possible shift in market sentiment from bearish to bullish.
Traders closely monitoring SFPUSDT are observing strengthening momentum as it approaches a key breakout zone. The presence of solid trading volume adds confidence to this setup, indicating that market participants may be positioning early in anticipation of a reversal.
Growing investor interest in SFPUSDT reflects rising confidence in its technical structure and overall potential. If the breakout is confirmed with strong and sustained volume, it could mark the beginning of a fresh bullish leg. This setup may present a valuable opportunity for medium-term traders as momentum builds and the pattern completes.
✅ Show your support by hitting the like button
✅ Leave a comment below (What is your opinion about this coin?)
Your feedback and engagement keep me motivated to share more insightful market analysis with you!
SFPUSDT Forming Falling WedgeSFPUSDT is forming a clear falling wedge pattern, a classic bullish reversal signal that often indicates an upcoming breakout. The price has been consolidating within a narrowing range, suggesting that selling pressure is weakening while buyers are beginning to regain control. With consistent volume confirming accumulation at lower levels, the setup hints at a potential bullish breakout soon. The projected move could lead to an impressive gain of around 40% to 50% once the price breaks above the wedge resistance.
This falling wedge pattern is typically seen at the end of downtrends or corrective phases, and it represents a potential shift in market sentiment from bearish to bullish. Traders closely watching SFPUSDT are noting the strengthening momentum as it nears a breakout zone. The good trading volume adds confidence to this pattern, showing that market participants are positioning early in anticipation of a reversal.
Investors’ growing interest in SFPUSDT reflects rising confidence in the project’s long-term fundamentals and current technical strength. If the breakout confirms with sustained volume, this could mark the start of a fresh bullish leg. Traders might find this a valuable setup for medium-term gains, especially as the wedge pattern completes and buying momentum accelerates.
✅ Show your support by hitting the like button and
✅ Leaving a comment below! (What is your opinion about this Coin?)
Your feedback and engagement keep me inspired to share more insightful market analysis with you!
SFPUSDT 12H#SFP is moving inside a descending channel on the 12H timeframe. It attempted to break out of the channel but was rejected by the SMA100. Keep an eye on it — price may retest the support before the next leg up. If it breaks above both the channel resistance and the SMA100, the potential targets are:
🎯 $0.3892
🎯 $0.4177
🎯 $0.4462
🎯 $0.4868
🎯 $0.5385
⚠️ Always remember to protect your capital with a proper stop-loss and disciplined risk management.
SFP/USDT – Daily Timeframe AnalysisSFP is attempting a breakout from a descending trendline after forming a strong support base around 0.35.
A successful breakout can trigger a bullish continuation toward key resistance levels.
Key Levels to Watch:
🔹 Entry Zone: Above 0.3704 (confirmed break)
🔹 TP1: 0.4291
🔹 TP2: 0.5382
🔹 Major Resistance: 0.4687
Bullish Scenario:
A clean breakout and retest of the trendline could push price toward TP1, and a strong continuation may reach TP2.
Invalidation:
Daily close back below 0.3500.
Chart looks promising, but waiting for confirmation is crucial. 📊💡
SFPSFP is out of trend — it has been moving horizontally for 2 years, indicating a stagnation of interest.
The price has been forming lower highs since the beginning of 2024, which strengthens the bearish structure.
The current candle is red, but not extreme, which suggests weak but consistent selling pressure.
SFPUSDT %132 Daily Volume SpikeSFPUSDT Analysis: Significant Volume Spike and Potential Move to Fresh Zones
There is a 132% daily volume increase in SFPUSDT, making it worth examining.
Currently, the price has almost exhausted the demand zone it recently reacted from. I believe it may now look for fresh demand zones at lower levels for the next significant reaction.
Key Points:
Volume Surge: 132% daily increase indicates strong activity.
Exhausted Zone: Demand zone has been nearly fully utilized.
Next Move: Watching for a potential test of fresh demand zones below.
If you think this analysis helps you, please don't forget to boost and comment on this. These motivate me to share more insights with you!
I keep my charts clean and simple because I believe clarity leads to better decisions.
My approach is built on years of experience and a solid track record. I don’t claim to know it all, but I’m confident in my ability to spot high-probability setups.
My Previous Analysis
🐶 DOGEUSDT.P: Next Move
🎨 RENDERUSDT.P: Opportunity of the Month
💎 ETHUSDT.P: Where to Retrace
🟢 BNBUSDT.P: Potential Surge
📊 BTC Dominance: Reaction Zone
🌊 WAVESUSDT.P: Demand Zone Potential
🟣 UNIUSDT.P: Long-Term Trade
🔵 XRPUSDT.P: Entry Zones
🔗 LINKUSDT.P: Follow The River
📈 BTCUSDT.P: Two Key Demand Zones
🟩 POLUSDT: Bullish Momentum
🌟 PENDLEUSDT.P: Where Opportunity Meets Precision
🔥 BTCUSDT.P: Liquidation of Highly Leveraged Longs
🌊 SOLUSDT.P: SOL's Dip - Your Opportunity
🐸 1000PEPEUSDT.P: Prime Bounce Zone Unlocked
🚀 ETHUSDT.P: Set to Explode - Don't Miss This Game Changer
🤖 IQUSDT: Smart Plan
⚡️ PONDUSDT: A Trade Not Taken Is Better Than a Losing One
💼 STMXUSDT: 2 Buying Areas
🐢 TURBOUSDT: Buy Zones and Buyer Presence
🌍 ICPUSDT.P: Massive Upside Potential | Check the Trade Update For Seeing Results
🟠 IDEXUSDT: Spot Buy Area | %26 Profit if You Trade with MSB
📌 USUALUSDT: Buyers Are Active + %70 Profit in Total
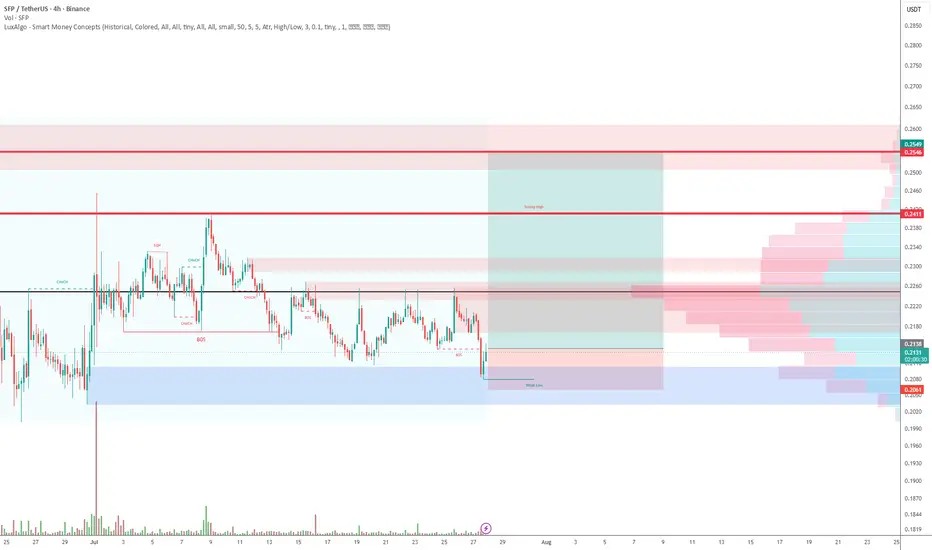
SFPUSDT | Watching the Blue Boxes for Bullish BreakoutsSFPUSDT has settled into a well‑defined area of interest and I’ll be focused on how price behaves inside the blue box. This zone has acted as support in prior pullbacks and now it could offer traders an opportunity for a quick upside move.
🟦 Blue Boxes = Support Zones
This areas has repeatedly attracted buyers and could act as a springboard. When price returns here, it’s a signal to pay close attention.
📈 Trade Plan
Low Time Frame Breakouts
Wait for a clear breakout on a 1hour/4hour chart inside the blue box. That tells us buyers are stepping in decisively.
Volume and CDV Confirmation
A genuine move will be backed by rising trading volume and positive shifts in Cumulative Delta Volume. Without those confirmations it’s safer to stay on the sidelines.
Defined Risk
Place stops just below the blue box so your downside is limited if support fails.
🤝 Why Trust This Setup
I focus on the setups that align volume, structure, and order flow with proven precision. My followers consistently see results because each level I share comes from real‑time market behavior and thorough analysis. Trade with the market’s confirmation and you’ll know you’re in sync with smart money rather than chasing noise.
📌I keep my charts clean and simple because I believe clarity leads to better decisions.
📌My approach is built on years of experience and a solid track record. I don’t claim to know it all but I’m confident in my ability to spot high-probability setups.
📌If you would like to learn how to use the heatmap, cumulative volume delta and volume footprint techniques that I use below to determine very accurate demand regions, you can send me a private message. I help anyone who wants it completely free of charge.
🔑I have a long list of my proven technique below:
🎯 ZENUSDT.P: Patience & Profitability | %230 Reaction from the Sniper Entry
🐶 DOGEUSDT.P: Next Move
🎨 RENDERUSDT.P: Opportunity of the Month
💎 ETHUSDT.P: Where to Retrace
🟢 BNBUSDT.P: Potential Surge
📊 BTC Dominance: Reaction Zone
🌊 WAVESUSDT.P: Demand Zone Potential
🟣 UNIUSDT.P: Long-Term Trade
🔵 XRPUSDT.P: Entry Zones
🔗 LINKUSDT.P: Follow The River
📈 BTCUSDT.P: Two Key Demand Zones
🟩 POLUSDT: Bullish Momentum
🌟 PENDLEUSDT.P: Where Opportunity Meets Precision
🔥 BTCUSDT.P: Liquidation of Highly Leveraged Longs
🌊 SOLUSDT.P: SOL's Dip - Your Opportunity
🐸 1000PEPEUSDT.P: Prime Bounce Zone Unlocked
🚀 ETHUSDT.P: Set to Explode - Don't Miss This Game Changer
🤖 IQUSDT: Smart Plan
⚡️ PONDUSDT: A Trade Not Taken Is Better Than a Losing One
💼 STMXUSDT: 2 Buying Areas
🐢 TURBOUSDT: Buy Zones and Buyer Presence
🌍 ICPUSDT.P: Massive Upside Potential | Check the Trade Update For Seeing Results
🟠 IDEXUSDT: Spot Buy Area | %26 Profit if You Trade with MSB
📌 USUALUSDT: Buyers Are Active + %70 Profit in Total
🌟 FORTHUSDT: Sniper Entry +%26 Reaction
🐳 QKCUSDT: Sniper Entry +%57 Reaction
📊 BTC.D: Retest of Key Area Highly Likely
📊 XNOUSDT %80 Reaction with a Simple Blue Box!
📊 BELUSDT Amazing %120 Reaction!
📊 Simple Red Box, Extraordinary Results
I stopped adding to the list because it's kinda tiring to add 5-10 charts in every move but you can check my profile and see that it goes on..
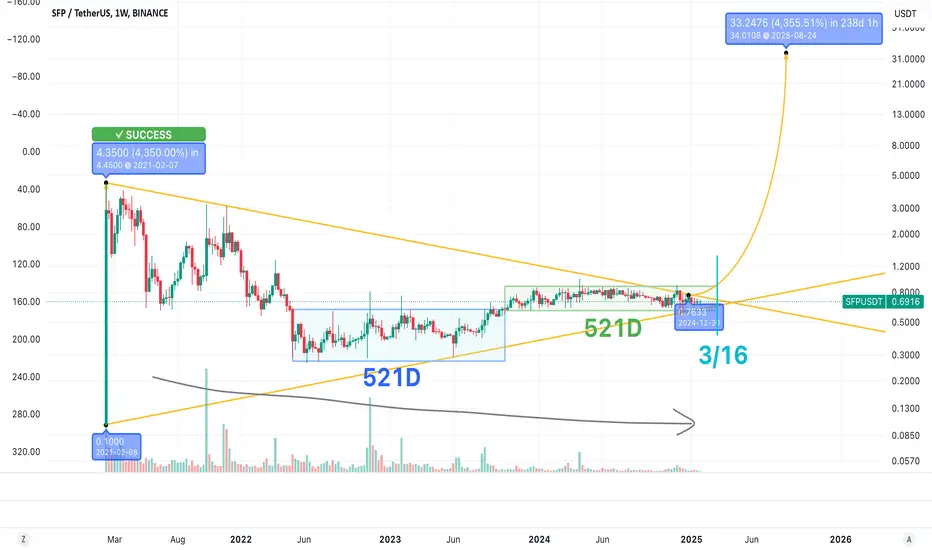
SFP’s 43x Potential: Now the Time to Jump In?SEED_DONKEYDAN_MARKET_CAP:SFP has been forming a large symmetrical triangle since its listing. The market makers have deliberately used two stages over more than 1,000 days to consolidate.
▍Stage 1: Consolidation lasted from 05/2022 to 10/2023, spanning 521 days (marked with a blue box).
▍Stage 2: Consolidation started in 10/2023 (marked with a green box).
If we estimate 521 days for this stage as well, the time point will fall on 03/16/2025, which coincides with the end of the large symmetrical triangle.
Trading volume has been in a long-term downtrend. When volume shrinks to its limit, a clear breakout direction will emerge.
Coupled with the upcoming peak bull market phase, it's likely to break upwards.
There’s an old saying in investing: the longer the consolidation, the higher the breakout.
The key players have spent 2.5 years patiently consolidating, concentrating the tokens in strong hands.
When coins like this break out, they tend to "take the elevator" straight up, leaving no chance to buy in later.
Based on the expected breakout range of the triangle, the maximum potential upside is approximately 43x from the breakout point, targeting a price of $34.
I believe this is the perfect time to enter. What do you think?
SFP /USDT SEED_DONKEYDAN_MARKET_CAP:SFP /USDT
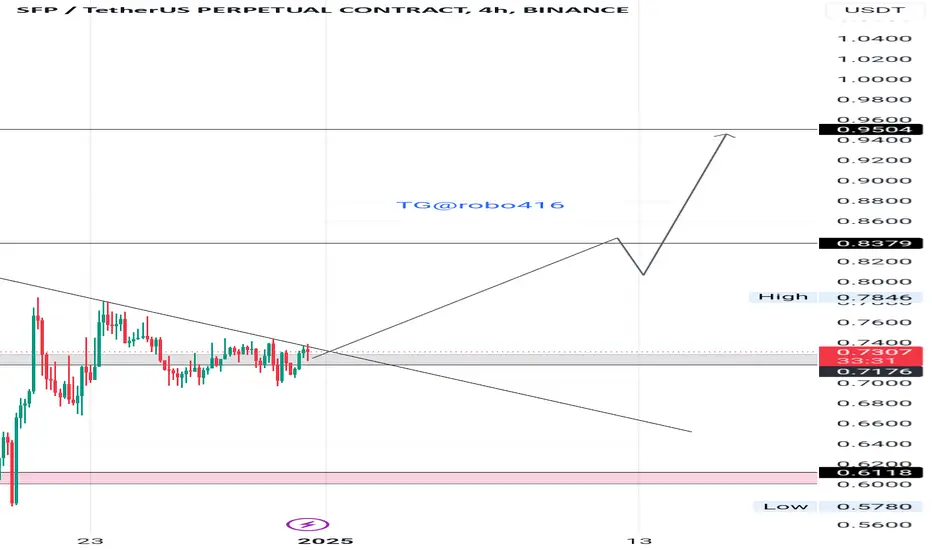
If #SFP breaks above $0.9751, a rally toward $1.2504 is likely, with the potential for further extensions to $1.5521 and $1.8803.
Failure to break resistance could result in a retest of the support zone around $0.7500.
$0.7500 - $0.8124: Strong support area where accumulation is likely to occur before further upward movement.
Resistance Levels (Targets):
$1.2500
$1.5521
$1.8803
SFP ROADMAP (3D)It looks like the SFP has formed a diametric from where we put the green arrow on the chart.
It now appears to be at the end of wave D.
By maintaining the green range, it can move towards the targets.
Closing a daily candle below the invalidation level will violate this analysis
For risk management, please don't forget stop loss and capital management
Comment if you have any questions
Thank You
Trade Signal: SFPUSDT - SellAttention, traders! We have identified a promising trading opportunity for the SFPUSDT currency pair using the EASY Quantum Ai strategy. Below are the details of our recommended trade setup:
Direction: Sell
Enter Price: 0.7213
Take Profit: 0.6796
Stop Loss: 0.7661
Rationale for the Forecast:
Our decision to recommend a sell position is based on a combination of technical and market sentiment analysis performed through the EASY Quantum Ai strategy. Historical price patterns show a potential downtrend with resistance observed at higher levels, enhancing the probability of a decline in value.
The current market exhibits signs of bearish pressure, influenced by recent macroeconomic factors affecting the broader cryptocurrency market. Technical indicators, such as moving averages and relative strength index, suggest a likely continuation of the downward momentum.
We advise all traders to monitor the market closely and manage your positions with regard to your individual risk preferences. Execute the trade only if it aligns with your trading strategy and risk management rules. Happy trading!
SafePal 847 Days Long Bullish Accumulation —New $10 ATH PossibleThe longer a pair stays in the accumulation phase, the bigger and stronger the bullish wave that follows.
We looked at hundreds and hundreds of the Bitcoin (BTC) trading pairs and we are now starting to spot some of the Tether (USDT) pairs. To be honest, I wanted to see how the market will react to Bitcoin before going fully in on this side, but not all charts are the same.
We just looked at Dash recently and we see the new ATL. This is enough to give us the go. Many pairs have not hit bottom and we stay away from those.
Here we have another unique chart, SafePal vs Tether —SFPUSDT.
The bottom was hit June 2022. Compare this to Dash which hit bottom in August 2024.
Can you see why I caution that we need to look individually at each chart? The difference is just too great.
SafePal can be read in two different ways:
1) Long-term higher lows and long-term accumulation is ultra-bullish. That's the classic way to see it.
2) The fact that it is relatively high and sideways can lead to a drop before the major bull-market. Say there is a strong crash and this pair crashes as well rather than detaching and moving up. This would not change our long-term bias and any drop would be bought.
As you can see, this chart can be read in different ways.
Seeing that SFPUSDT didn't move on the 5-August crash, we can assume that it won't move if there is another leg down. Regardless of what happens, we cannot guess the future, we can only take action.
The strategy? Buy and hold.
Whatever happens from now on doesn't really matter to us, we buy and hold.
➖ If prices move up; we buy and hold.
➖ If prices move down; we buy more and more.
Since we are approaching a major bull-market, the biggest for many in this game, the only wise choice right now is to buy and wait. The marketwide correction has been going for 6-8 months and most sellers are already exhausted. We like to be early in order to enjoy the entire ride on the way up.
A new All-Time High in 2025 can lead to a price tag of around $10. That's more than 1,200% potential for growth.
Thinking of this huge potential in such a short —one year— time, we prefer the proven and tested strategy of buy and hold.
You can approach the market in whatever way you like best, of course.
You should do your own research and planning.
I am just sharing my views and opinion.
When the market starts to move and growth sets in, when we look back at everything we tend to conclude that higher profits would have been possible by buying and holding rather than trying to trade. That's because buying and selling continually requires lots of experience and dedication, and most people only have a few hours or minutes to trade.
Unless this is your life's calling, you are better off going at it the easy way.
Whatever you choose... I am here to help you, to encourage you and to assist you.
Whatever you do, I am wishing you success.
Namaste.
SFP Potential Breakout Guaranteed +100%In this video,
I discussed why breaking this 0.08 levels would push us and give us a +100% move.
It's potentially because we've been consolidating near the resistance area.
Hopefully we do get that breakout to the upside.
I am closely watching this!
SLong
SFP Potential Breakout Guaranteed +100%In this video,
I discussed why breaking this 0.08 levels would push us and give us a +100% move.
It's potentially because we've been consolidating near the resistance area.
Hopefully we do get that breakout to the upside.
I am closely watching this!
SLong