SHIB USDT ENTRY**SHIB/USDT (1H) Short Setup:** Shiba Inu is bouncing after a sharp sell-off from the 0.50e-5 area and is now stalling just under the yellow moving average, which is acting as dynamic resistance. Price is showing weak momentum and lower-high candles, so I'm looking for a short entry around **0.47864e-5**. My stop loss is placed above the recent swing high at **0.48654e-5**, which invalidates the idea if price breaks and holds above it. My take profit is at **0.44786e-5**, near the previous low w
In-depth trading ideas
SHIBA/USD:A Nested Bullish Structure or One More Decline?SHIBA/USD | Is the Correction Complete?
⏱️ Reading Time: ~2–3 minutes
On the 4H chart, I’m considering Wave C of the larger corrective structure complete. But is SHIBA ready to begin a powerful bullish move?
Under the Elliott Wave Principle, the completion of a structure at one degree does not necessarily mean all lower-degree waves are complete. Even the final move may take the form of an Ending Diagonal. That’s why wave character and internal structure matter more than price movement alone
# SHIBA: Is a Powerful Impulse Taking Shape? | Elliott Wave Prin**Sometimes, market structure reveals something that seems hard to believe at first glance.**
On SHIB’s weekly chart, my bullish scenario is based on a five-wave motive pattern, viewed through the geometry of price on an arithmetic scale. Interestingly, the impulsive character remains visible even on the logarithmic chart.
The initial waves, deep corrections, and a potentially powerful upward move reveal a market structure worth examining. Similar price behavior can also be observed across oth
SHIB | Q3 2026 - Day ChartI have 7 day's left on the essentials plan. I might be enticed to come back during the holiday - year end sale. I dislike the ad's but freemium features is all I need to post idea's (private)
Anyways, here is SHIB with 3.12Billion Dollar marketcap.
Who's buying this stuff?? (*buy's $10) Its an SEC Digital Asset Commodity. Its being used as a commodity?? IDK but this is what price action says.
The Shiba Inu started Q3 off at a bunch of .0's405, June's SwingLow created 26 June. Bulls pushed pri
Shiba is bearish for a while Bearish bias remains dominant: The technical structure favors sellers until SHIB reclaims $0.00000462 with volume confirmation. All major EMAs remain above price.
Oversold indicators suggest potential bounce: Stochastic RSI deep in oversold territory and %B near channel bottom provide the best near-term bullish setup for a relief rally.
Volume is critical: Daily trading volume of $50–85 million is significantly below the $859 million peak on July 27. A sustained recovery requires stronger spot
(SHIB) shiba inuSee that green dotted line? That's where Shiba Inu started when it was first listed to Coinbase. Not so good, is it? Shiba Inu, in my view, expanded into too many side projects instead of focusing on the SHIB token from the beginning. When the company became a huge success story as the Dogecoin Killer, it rapidly branched off into those all tokens LEASH and BONE. Instead of doing that, and failing, Shiba Inu could have just been SHIB all this time. When I see new companies falling for the same i
Shib trade updateTRADE CLOSURE UPDATE – SHIB/USD 📊
Pair: SHIB/USD
Status: Trade Closed Early ❌
Analysis:
The price is failing to show any significant momentum and has entered a tight consolidation range. Since the market is moving sideways with minimal volume, it's best to exit now (at breakeven / slight profit) rather than tying up capital.
Protecting capital is priority #1. We’ll wait for a clearer opportunity! 💡💵
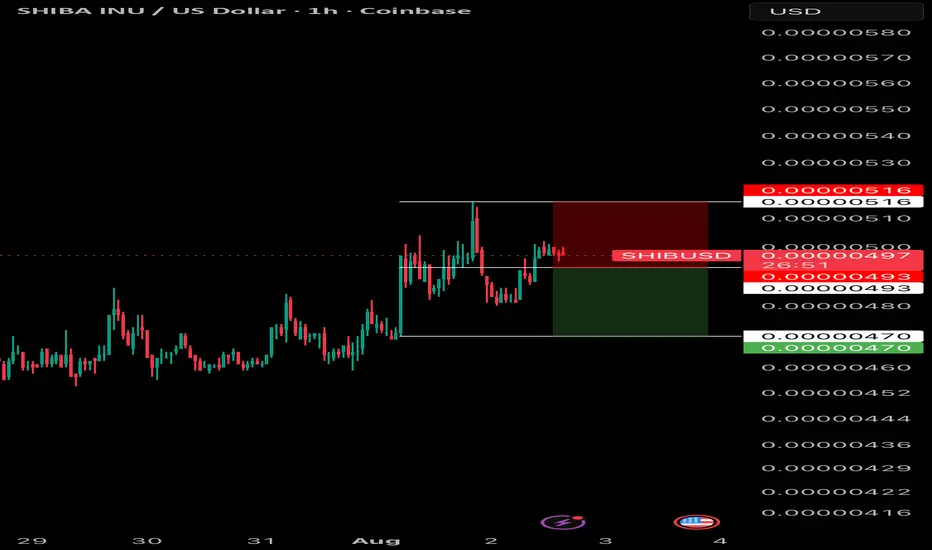
Trading Signal: SHIB/USD (Short Position)📉 Trading Signal: SHIB/USD (Short Position)
* Pair: SHIB/USD (1H Timeframe)
* Position: Short / Sell 🔴
🎯 Trade Levels:
* Entry Price: 0.00000493 (or Market Price: 0.00000497)
* Stop Loss (SL): 0.00000516 🛑
* Take Profit (TP): 0.00000470 🎯
> ⚠️ Risk Management: Always use proper risk management and position sizing before entering the trade!
>
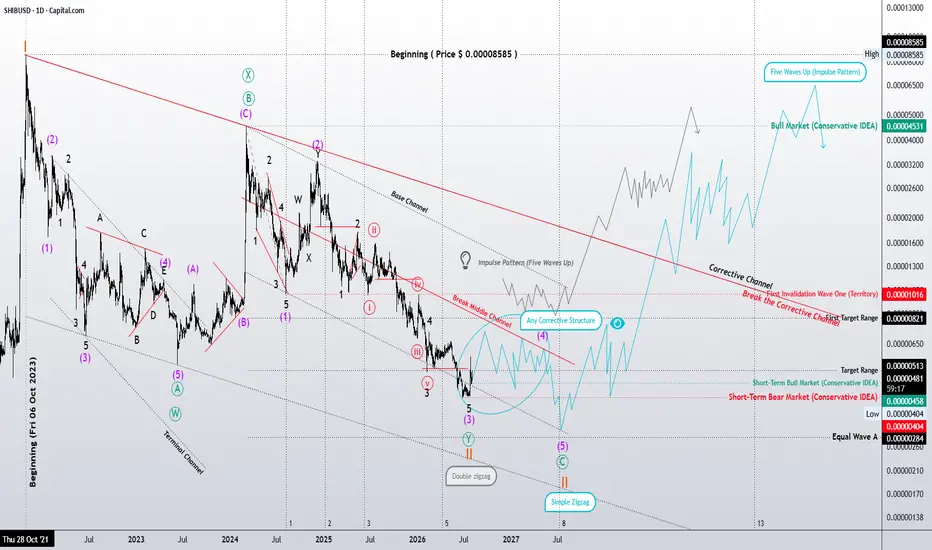
Two Valid Elliott Wave Scenarios Before the Next Bullish PhaseSHIBA Daily | Two Valid Elliott Wave Scenarios Before the Next Bullish Phase
A closer examination of the daily chart suggests that the current corrective structure can be interpreted in two valid ways under the Elliott Wave Principle.
The first scenario considers the correction as a completed or nearly completed Double Zigzag (W-X-Y). If this interpretation is correct, SHIBA may already be approaching the end of its higher-degree correction, allowing the market to begin building a new bullish
SHIBA | Is the First Major Cycle Ending? A Potential Golden Era SHIBA | Is the First Major Cycle Ending? A Potential Golden Era Ahead?
Based on my personal interpretation of the current Elliott Wave Principle structure, SHIBA may be approaching the completion of its first major corrective cycle. Either the correction has already ended, or the market may require only the completion of the remaining lower-degree waves before a new motive cycle can begin.
This view is based on my wave count, Fibonacci relationships, and the current price structure. According
Sal......👇
* CRYPTOCAP:SHIB 4H | Bearish Outlook*
Price: *0.0000046027* (-4.70%)
*Key Points:*
1. *Rejection at Supply Zone*: SHIB got rejected hard from the 0.0000057621 resistance zone. This red box is acting as strong supply.
2. *Lost CG Level*: Price failed to hold above 0.0000048764. Now trading below it at 0.0000046027. As long as we’re under this level, bears are in control.
3. *Next Target*: The big green demand zone sits around *0.0000025509*. If we lose current support, the next drop coul
The most significant chart of inefficiency: SHIBA INUCould Shiba have created one of the most significant Double Tops in the history of assets?
Shib, along with a large portion of the Memecoin sector, is currently entering a crypto winter that COULD potentially reset nearly all tokens, coins, and memes lacking inherent utility, broad adoption, or significant social awareness.
Consider the 38 million coins that have been produced.
Which ones are truly necessary to you?
Which ones offer you real value or utility?
Which ones might be able to sub
SHIB: liquidity sweep before bullish reversionThe Macro Picture 🗺️
SHIB's structural reset has fully extended — the $0.00000540 macro floor that held the range for four months has broken on a sustained close, the prior invalidation level at $0.00000510 was swept, and price has dropped into the lower extension. RSI now reads sub-30 with its moving average curling flat after a near-vertical descent, the textbook condition for sellers to exhaust. The broken floor pocket above now sits as the natural mean-reversion magnet, and a final liquidi
SHIB at macro floor: sweep before range reversionThe Macro Picture 🗺️
SHIB has spent 2026 tracing a measured structural reset — from the $0.00001000 macro ceiling printed in January, price descended in clean stair-steps before carving a multi-month range floor near $0.00000540. The body of that range has acted as a volatility playground between $0.00000570 and $0.00000680, with bulls and bears trading the same pocket for nearly four months. Price has now slipped back to the lower boundary, and the macro floor desperately needs to be tested.
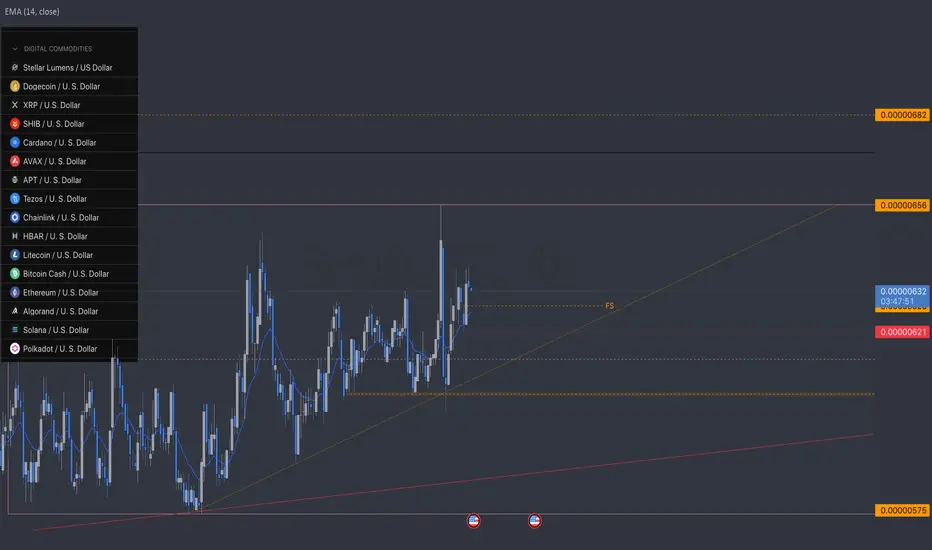
SHIB | May 2026 | 4hr Chart16 Digital Asset Commodities listed by the SEC is listed on the chart.
SHIB is listed at a Digital Asset Commodity and commodities are bought and sold in bulk.
Here are some levels of interest for those buying SHIB in bulk.
** T.A explained **
Multiple Time-Frame Analysis; Color Code:
Strength favors the higher timeframe.
Yearly timeframe = black
Monthly timeframe = pink
weekly = grey
daily = red
4hr = orange
1hr = yellow
15min = blue
5min = green if they are shown. (Level visibility on in
Shiba Inu Forecast: Will SHIB Rise or Drop Further?SHIB/USDT is currently trading in a consolidation phase after a long period of weakness. Shiba Inu remains one of the most popular memecoins, but its price structure continues to reflect strong dependence on market sentiment, momentum and speculative demand.
After losing a large share of its value from the October 2021 all-time high, SHIB is now moving sideways within a narrow short-term range. The latest price action shows no clear trend direction, with the EMA-20 running almost flat and price
$SHIB LIQUIDITY ZONE //PROCEED WITH CAUTION//We have just stepped into NEW all-time low territory, could we go lower absolutely, but if not, this is what they call the liquidity zone this is where we begin to load up on all the Shib we can get I expect it to go lower to 0.00000302 before we see a bounce upwards if it breakout lower below this point there is no telling how much more freefalling there will be. Proceed with caution
SHIB | March 2026- T.A explained -
BackSide (BS)
FrontSide (FS)
Inverse BS (Inv.BS)
Inverse FS (Inv.FS)
BS & FS levels are expected support when dashed lines, tested when dotted and resistance when solid lines.
The inverse is true for the Inv. BS Inv. FS levels, they are resistance as dashed lines, tested as dotted and support as solid lines.
Monthly timeframe is color pink
weekly grey
daily is red
4hr is orange
1hr is yellow
15min is blue
5min is green if they are shown.
strength favors the higher timeframe
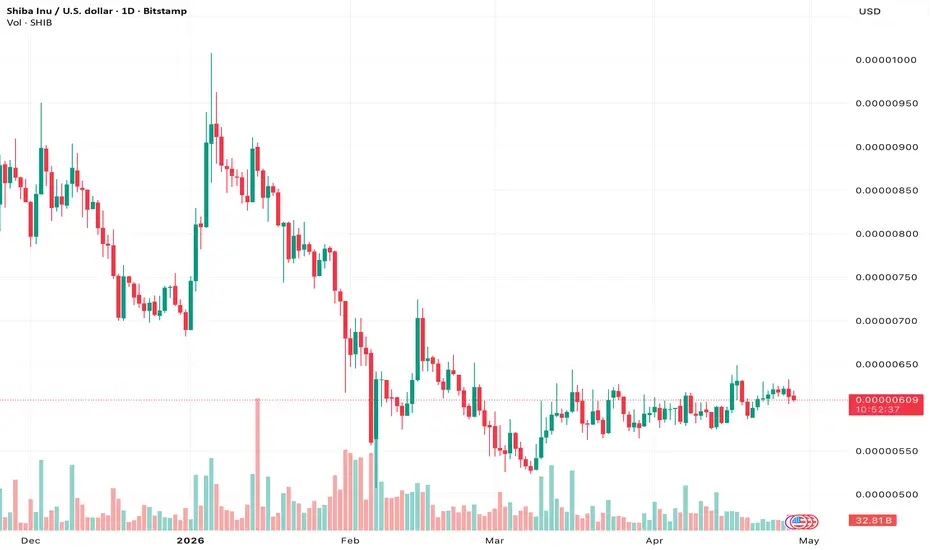
Shiba Inu under pressure as sellers defend key resistance:Current Price: 0.0000062 (Analysis was generated on Monday Morning)
Direction: SHORT
Confidence level: 62%(Several professional traders describe weak momentum, capped upside, and selling pressure near resistance, outweighing longer-term bullish community narratives.)
Targets
Target 1: 0.0000058
Target 2: 0.0000055
Stop Levels
Stop 1: 0.0000068
Stop 2: 0.0000072
Key Insights:
Here’s what’s driving this setup. Multiple traders describe SHIB as “surviving” rather than thriving, which matters.
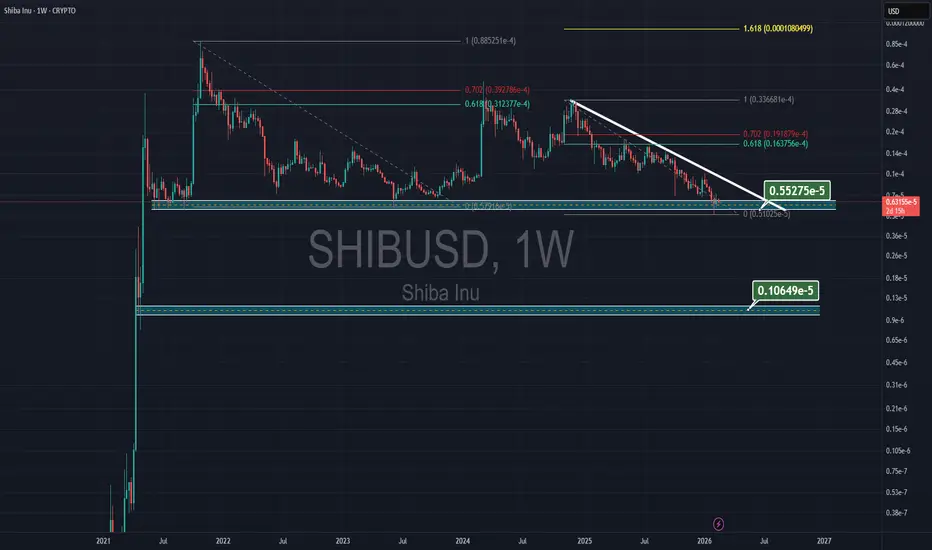
SHIBUSD Testing Major 2021 Support – Potential Wedge CompletionShiba Inu (SHIBUSD) is currently testing its 2021 lows, a very strong and significant support level at the former wave 4 swing low. Notably, price action may also be completing subwave (5) of a wedge pattern within wave C of a larger ABC zig-zag corrective decline.
This structure suggests that a rebound could develop soon. However, the first meaningful bullish confirmation would only come with a move above the former wave (4) swing high. Until then, the broader corrective pressure remains intac
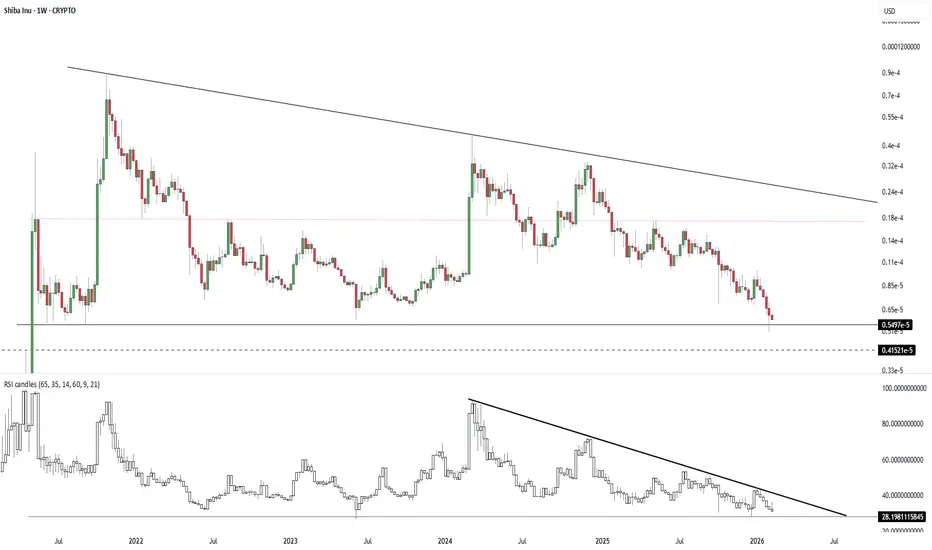
SHIBA: Testing the Final Line of Defense
Major Support Zone (The "Floor"): The price is currently hovering right above the critical historic support level at $0.00000549. This zone acts as the "last line of defense."
Bullish Scenario: If this level holds, it presents a high Risk/Reward (R/R) long opportunity, as it has historically been a strong accumulation zone for Smart Money.
Bearish Risk: A weekly close below this level could trigger a free fall towards the $0.00000415 region (dashed line).
Descending Resistance The asset has