SHIB: Breakout From the CorrectionCRYPTOCAP:SHIB SHIB has finally broken out of the descending corrective structure we have been watching.
The breakout is important, but I’m not interested in chasing the first move. The better setup is a pullback into the breakout area, followed by clear bullish price action.
Trading Setup
Entry: On a confirmed pullback and bullish rejection from the support zone.
Invalidation: 0.00000500
Target 1: 0.00000665
Target 2: 0.00000780
Why this setup?
The descending structure was acting as a correction rather than a new bearish trend. Once price broke above it, the structure changed.
Now we want to see the old resistance/support area hold during the pullback. A successful retest would give us confirmation that the breakout is real and that buyers are defending the new structure.
Why these targets?
0.00000665 is the first measured target from the previous bullish structure and gives us the initial continuation objective.
0.00000780 is the larger extension target and represents a more ambitious continuation of the current bullish wave.
The main idea is simple: breakout → pullback → confirmation → continuation.
If the pullback fails and price loses the invalidation level, the bullish setup is no longer valid.
Risk Warning: This is educational market analysis, not financial advice. Crypto markets are highly volatile. Always manage your risk and position size.
In-depth trading ideas
SHIBUSDT Forming Falling WedgeSHIBUSDT is forming a clear falling wedge pattern, a classic bullish reversal signal that often indicates an upcoming breakout. The price has been consolidating within a narrowing range, suggesting that selling pressure is weakening while buyers are beginning to regain control. With consistent volume confirming accumulation at lower levels, the setup hints at a potential bullish breakout soon. The projected move could lead to an impressive gain of around 20% to 30% once the price breaks above the wedge resistance.
This falling wedge pattern is typically seen at the end of downtrends or corrective phases, and it represents a potential shift in market sentiment from bearish to bullish. Traders closely watching SHIBUSDT are noting the strengthening momentum as it nears a breakout zone. The good trading volume adds confidence to this pattern, showing that market participants are positioning early in anticipation of a reversal.
Investors’ growing interest in SHIBUSDT reflects rising confidence in the project’s long-term fundamentals and current technical strength. If the breakout confirms with sustained volume, this could mark the start of a fresh bullish leg. Traders might find this a valuable setup for medium-term gains, especially as the wedge pattern completes and buying momentum accelerates.
✅ Show your support by hitting the like button and
✅ Leaving a comment below! (What is You opinion about this Coin)
Your feedback and engagement keep me inspired to share more insightful market analysis with you!
$SHIB | 1D | BUY SETUP |Everyone is chasing the newest micro-cap memes, leaving BINANCE:SHIBUSDT left for dead. But while the market looks for the next 100x lottery ticket, a massive liquidity pool is quietly consolidating into a textbook high-R/R setup.
The numbers suggest the "boomer meme" narrative is missing the bigger picture.
📊 THE TOKENOMICS GAP
Newer memes launch with heavy VC backing, low initial floats, and imminent unlock schedules.
CRYPTOCAP:SHIB has:
• 100% circulating supply (approx. 589T after VB's historic 410T burn)
• No venture capital unlocks or insider vesting pressure
• Active burn mechanisms via Shibarium transaction fees
In a market plagued by supply inflation, SHIB offers rare structural stability.
🎯 THE TECHNICAL SETUP (1D Timeframe)
We are currently trading at $0.00000615, sitting right under a Daily Selling Order Block ($0.00000622 – $0.00000649).
Buying the breakdown/pullback is where the asymmetry lies:
• Daily Buying Order Block: $0.00000554 – $0.00000534
• Entry Price: $0.00000554 (confluence with the OB top)
• Stop Loss: $0.00000524 (just below the OB invalidation)
🎯 TARGETS & RISK/REWARD
Chasing the current price offers poor R/R. Patiently waiting for the retest of the buying OB gives:
• Target 1: $0.00000596 (+7.58% | 1.40 R/R)
• Target 2: $0.00000704 (+27.08% | 5.00 R/R)
• Max Risk: Only 5.42% from entry
THE DISCONNECT:
The market thinks SHIB has lost its edge because it's consolidated for weeks. In reality, the 1D chart shows a clear transition of market structure. A pullback to the buying OB is not a sign of weakness—it's the healthy retest required to fuel a clean 5:1 R/R expansion toward $0.00000704.
🚨 Invalidation: A daily close below $0.00000524 invalidates the bullish order block and setup.
Patience over FOMO.
Are you bidding the SHIB pullback or watching from the sidelines? 👇
SHIBUSDT | H4SHIBUSDT is currently trading in a short-term bullish recovery structure on the H4 timeframe after a period of consolidation between the 0.00000500–0.00000560 range.
The market previously formed a clear accumulation structure after the decline from higher levels, with buyers repeatedly defending the 0.00000500 demand zone. The recent impulsive move from the lower range created a breakout above the consolidation resistance, showing increased buying pressure and a potential shift in short-term momentum.
Price is currently testing the key resistance zone around 0.00000555–0.00000560, which aligns with:
• Previous range high resistance
• Liquidity above recent swing highs
• Breakout confirmation area
• Upper boundary of the current consolidation structure
This zone represents a critical decision area where the next expansion move could develop.
Primary Scenario – Bullish Continuation
• Clean H4 close above 0.00000560
• Acceptance above the breakout zone
• Successful retest of the FVG / imbalance area
• Continued buyer momentum toward higher liquidity
Upside targets:
• 0.00000620
• 0.00000664 (Major Resistance / Supply Zone)
A successful breakout above 0.00000560 would confirm the continuation structure and could allow SHIB to target the higher supply area around 0.00000664.
Alternative Scenario – Pullback & Demand Retest
• Failure to break and hold above 0.00000560
• Short-term rejection from resistance
• Price returns toward the breakout base
Downside targets:
• 0.00000520–0.00000515 (FVG / Retest Zone)
• 0.00000500 (Major Demand Support)
• 0.00000475 (Liquidity Sweep Area)
A controlled pullback into the FVG zone would still maintain the bullish structure if buyers defend the previous breakout area.
Key Levels
Immediate Resistance:
🔴 0.00000555 – 0.00000560
Liquidity Target:
🔴 0.00000620
Major Supply Zone:
🔴 0.00000664
FVG / Retest Zone:
🟡 0.00000515 – 0.00000525
Key Support:
🟢 0.00000500
Lower Liquidity Zone:
🟢 0.00000475
Until SHIB loses the 0.00000500 support zone, the current H4 structure remains constructive, with price attempting to expand higher after the consolidation phase.
Bias: Bullish above 0.00000500
Key Decision Zone: 0.00000555–0.00000560
Bullish Confirmation: Acceptance above 0.00000560
Upside Targets: 0.00000620 → 0.00000664
Bearish Invalidation: Sustained acceptance below 0.00000500
SHIB — A NEW BULLISH TREND COULD BE STARTING?📊 Technical Analysis — SHIB/USDT
Time Frame: 5D
Current Price: ~0.00000546
Structure: Long-term bearish trend → potential bullish reversal
Key Observation: 🟢 Descending TrendLine has been broken to the upside
📉 Pattern & Market Structure
SHIB has been trading beneath a long-term Descending TrendLine, which has acted as dynamic resistance since the major high around 0.00003343.
The chart shows a prolonged sequence of lower highs and lower lows, confirming the previous bearish structure.
However, the latest price action has finally broken above the Descending TrendLine. This is an important technical development because the trendline had contained price for an extended period.
🟢 A confirmed breakout can signal a transition from a bearish trend into an accumulation/recovery phase.
The breakout itself is bullish, but confirmation remains important. Ideally, SHIB should hold above the broken trendline and avoid falling back into the previous downtrend structure.
---
🟢 BULLISH SCENARIO — BREAKOUT CONFIRMATION
If SHIB successfully maintains its position above the Descending TrendLine, the probability of a larger recovery increases.
🎯 Potential upside levels:
1️⃣ $0.00000660
🔹 First important resistance
🔹 Approximately +21% from the chart price area
🔹 A breakout above this level would strengthen the bullish structure.
2️⃣ $0.00000930
🔹 Major resistance / previous supply zone
🔹 Approximately +70%
🔹 Reaching this level would represent a significant recovery from the current structure.
3️⃣ $0.00001150
🔹 Major horizontal resistance
🔹 Approximately +110%
🔹 A successful break could open the door toward a much larger continuation.
4️⃣ $0.00001400
🔥 Major long-term target/resistance
🔹 Approximately +156%
🔹 This is the highest marked resistance on the chart and would represent a substantial bullish reversal.
---
🔄 POSSIBLE RETEST
One of the most important things to watch after the breakout is a potential retest of the broken Descending TrendLine.
📌 Breakout → Retest → Hold → Continuation
This would be a classic bullish confirmation structure.
If price returns toward the former trendline and buyers defend the area, the previous resistance can potentially become new dynamic support.
🟢 A successful retest would make the breakout significantly stronger.
---
🔴 BEARISH SCENARIO — FALSE BREAKOUT
The bullish thesis becomes weaker if SHIB fails to hold above the broken trendline.
⚠️ If price falls back below the Descending TrendLine and begins closing candles beneath the breakout area, this could indicate a false breakout / bull trap.
Potential downside levels to monitor:
🔻 0.00000500 – 0.00000520
→ Immediate breakout/retest area.
🔻 0.00000405
→ Major chart low / critical structural support.
If 0.00000405 is decisively lost, the current bullish reversal thesis would be substantially weakened and the broader bearish structure could resume.
---
🧠 KEY TECHNICAL TAKEAWAY
The most important development on this chart is not simply the upside movement, but the fact that SHIB has finally broken a long-term descending resistance trendline.
📉 Before: Lower highs + lower lows + price below descending resistance.
🟢 Now: Descending TrendLine breakout + possibility of a structural trend transition.
🔥 The next confirmation would be a sustained move above 0.00000660.
If SHIB can reclaim 0.00000930 → 0.00001150, the breakout could develop into a much larger medium-to-long-term recovery.
📌 Bullish invalidation:
Loss of the breakout structure + decisive break below 0.00000405.
---
🚀 CONCLUSION
SHIB is showing its first significant bullish technical development after a prolonged downtrend.
🟢 Primary Bias: Bullish after Descending TrendLine breakout
🎯 First Target: 0.00000660
🎯 Second Target: 0.00000930
🎯 Third Target: 0.00001150
🔥 Major Target: 0.00001400
⚠️ Key Support: 0.00000500–0.00000520
🛑 Critical Structure: 0.00000405
The ideal bullish confirmation would be a retest of the broken trendline followed by a strong continuation candle.
> ⚠️ This is a technical analysis based on the chart structure and not financial advice. Always DYOR.
#SHIB #ShibaInu #SHIBUSDT #Crypto #Cryptocurrency #Altcoins #TechnicalAnalysis #PriceAction #Bullish #Breakout #TrendlineBreakout #CryptoTrading #AltcoinSeason
SHIB Price Action: Consolidation Before the Next Move?Shiba Inu (SHIB) price action has been trading around the lower boundary of a higher-timeframe range for an extended period. This prolonged period of consolidation places attention on whether the market is developing an accumulation phase before a potential expansion, although further price and volume confirmation would be needed.
Volume may be an important factor in assessing the strength of any developing move. If SHIB begins to show increased buying participation and successfully reclaims the range-low support area, the possibility of a rotation towards the upper boundary of the established range and its associated resistance may increase. Sustained price acceptance within the range would provide additional technical support for this scenario.
However, if price remains unable to reclaim and maintain the range-low support, the market may continue to consolidate around current levels. A failure to establish a sustained recovery could also increase the possibility of further downside or continued weakness within the existing trading region.
Overall, the higher-timeframe range low remains an important technical area for SHIB. Price behaviour and volume around this region may provide insight into the market's next potential move, but no particular direction is guaranteed.
----------------------------------------------------------------------------------------------
Don't invest unless you're prepared to lose all the money you invest. This is a high-risk investment and you should not expect to be protected if something goes wrong. Take 2 mins to learn more: coinjar.com/uk/risk-summary
The article is an opinion expressed by the author at a point in time and does not represent the views of CoinJar UK Limited or CoinJar Australia Pty Ltd. Take care to consider the date of this article and be aware that this opinion is based on circumstances at the time of publishing. No responsibility or liability is accepted for any errors of fact or omission expressed therein. Past performance is not a reliable indicator of future results.
This above article is not to be read as investment, legal or tax advice and it takes no account of particular personal or market circumstances; all readers should seek independent investment advice before investing in cryptocurrencies.
We recommend you obtain financial advice before making a decision to use your credit card to purchase cryptoassets or to invest in cryptoassets.In the UK, it's legal to buy, hold, and trade crypto, however cryptocurrency is not regulated in the UK. It's vital to understand that once your money is in the crypto ecosystem, there are no rules to protect it, unlike with regular investments.
You should not expect to be protected if something goes wrong. So, if you make any crypto-related investments, you're unlikely to have recourse to the Financial Services Compensation Scheme (FSCS) or the Financial Ombudsman Service (FOS) if something goes wrong.
----------------------------------------------------------------------------------------------
#SHIBUSDT Medium-term Bullish potential !#SHIB
The price is moving within a descending channel on the 1-hour timeframe and has reached the lower boundary. It is now poised for a bounce and is expected to retest this boundary.
The Relative Strength Index (RSI) indicates a downward trend, which is likely to continue given the overbought conditions.
There is a key support zone in green at 0.00000445. The price has bounced off this zone several times, making it a strong support level.
The price is trending towards the 100-period moving average, which we are approaching. This trend supports an upward move.
Entry Price: 0.00000473
Target 1: 0.00000480
Target 2: 0.00000490
Target 3: 0.00000504
Stop Loss: At the resistance zone in green
Remember this simple rule: Money management.
Any questions? Please leave a comment.
Thank you.
SHIBUSDT: The Bullish Reversal Most Traders Could MissYello Paradisers! Are SHIB traders about to get caught on the wrong side of the next major move while the chart is already showing the first signs of a bullish reversal?
💎#SHIB is currently presenting a high-probability setup based on price action and market structure. According to Dow Theory, the market had previously been trading in a bearish structure, continuously forming Lower Lows (LL).
💎However, at the most recent Lower Low, price created a hidden bullish divergence against the RSI indicator. This is an important signal because it suggests that bearish momentum may be weakening even though price pushed into a new low.
💎Following this divergence, #SHIB entered a sideways consolidation phase. The key development came when price broke out of this range with a strong bullish impulse, confirming fresh buying pressure and creating the first Higher High (HH) in the current structure.
💎This Higher High is significant because it may represent the first serious sign that the previous bearish market structure is beginning to shift.
💎#SHIB is correcting that bullish impulse through an ABC corrective structure. If this correction remains healthy and buyers defend the key support area around Point C, the market could be preparing for another bullish expansion.
💎Adding further confirmation, the structure around Point C is also showing characteristics of a Head and Shoulders reversal pattern on the higher timeframe. When combined with the RSI divergence, breakout from consolidation, first Higher High, and current ABC correction, the overall technical picture becomes increasingly supportive of a potential bullish reversal.
💎The next reaction from Point C will therefore be extremely important. A strong bullish confirmation from this area could increase the probability that SHIB continues building a new Higher High and Higher Low structure.
At the same time, Paradisers should not anticipate the move without confirmation. A technically attractive setup is never a guarantee, and disciplined traders always wait for the market to prove the idea before committing capital. The strongest traders are not those who enter first. They are those who enter when the probabilities are clearly on their side. Stay patient, protect your capital, and trade the structure—not the emotions of the crowd.
MyCryptoParadise
iFeel the success🌴
Shiba Inu Reclaimed Key Structure. Mapping The Expansion.Shiba Inu Reclaimed Key Structure. Mapping The Expansion.
When community conviction aligns with technical structure, market moves can unfold rapidly.
(Note: Zooming out on the chart provides full visual clarity of the macro channels and Fibonacci expansion projections).
Fundamental & Ecosystem Context
While originally born as a meme token, Shiba Inu has evolved into an active ecosystem supported by Shibarium (its Layer-2 scaling solution) and one of the most dedicated communities in the space—the "ShibArmy."
SHIB has historically demonstrated that when liquidity returns to retail-favorite assets, volatility expands aggressively. However, as traders, we leave hype behind and focus strictly on price structure and risk management.
Technical Analysis & Key Structure
Looking closely at the 4-hour chart, SHIB has completed a clean breakout from its multi-week descending channel.
More importantly, price has pushed back above the critical horizontal pivot zone (highlighted by the blue box between 0.00000495 and 0.00000505). As shown in the detailed historical view, this specific zone has acted as a battleground with multiple rejections and bounces over time. Reclaiming it shifts the short-term bias from absorption to momentum.
Targets & Fibonacci Logic
The targets are projected using a combination of previous impulse legs, key structural resistance, and Fibonacci expansion levels:
Support / Retest Zone: 0.00000495 – 0.00000505
Short-Term Target: 0.00000610 (100% Fibonacci Expansion)
Mid-Term Target: 0.00000710 (161.80% Fibonacci Expansion)
Invalidation Level: 0.00000480
Risk Perspective
The invalidation level at 0.00000480 is positioned closely below the current structure. This provides an excellent Risk-to-Reward ratio.
However, if price breaks and closes below 0.00000480, the breakout is considered a false expansion, and price will likely retest the macro lows. We do not hold trades against invalidation. Define your risk, wait for pullback confirmation, and manage your capital prudently.
Patience before execution.
Risk Warning:
Trading cryptocurrencies involves significant financial risk. Meme-tier and high-volatility assets carry elevated market risk. This analysis represents a personal market view, not financial advice. Always define your risk before entering any trade.
SHIB: Bears Still Have the Upper HandPrimary Downtrend Threatens to Resume
SHIB continues to show signs that its primary downtrend may be resuming. The recent sequence of medium-term lower highs and lower lows is keeping the broader technical picture firmly tilted towards the bears.
Breakout Turns Into a Fakeout
The explosive move to $0.0⁵583 initially looked promising, but SHIB failed to hold above the previous $0.0⁵520 resistance level. The subsequent reversal has turned that move into a clear fakeout, with price giving back much of the advance.
Moving Averages Continue to Weigh
Price has fallen back below the bearishly crossed 100/50-Day EMAs, with both averages continuing to act as overhead resistance. Bulls also failed to reclaim the previous $0.0⁵520 level during the latest recovery attempt.
Bulls Need to Reclaim $0.0⁵468
The first meaningful improvement would come from a break above the recent $0.0⁵468 swing high. This would give SHIB a short-term bullish change of character, although considerably more work would be required to reverse the broader downtrend.
Another Breakdown Would Strengthen the Bears
The recent $0.0⁵435 swing low is now the immediate level to watch. A break below would continue the bearish structure and shift attention back towards the June 25 low around $0.0⁵405, although extremely low volume suggests selling conviction remains limited.
In Summary
SHIB remains under pressure after failing to hold its breakout above $0.0⁵520, with the spike to $0.0⁵583 increasingly looking like a fakeout. Price remains below the bearishly crossed 100/50-Day EMAs, while the recent structure continues to favour sellers. Bulls need to reclaim $0.0⁵468 to produce a short-term change of character. Below, a break of $0.0⁵435 would put the June low around $0.0⁵405 firmly back in focus.
SHIB Rejection: Is the Next Move Lower…!Yello Paradisers, is #SHIB latest rejection shows that the recent recovery is already running out of strength? Although the move may still look like a normal pullback to many traders, the broader structure, resistance reaction, supply pressure, and Volume Spread Analysis suggest that the market may be preparing for another bearish phase.
💎#SHIB has clearly respected the descending resistance trend-line and failed to break above it. This rejection is a key probability of ongoing structural weakness. At the same time, Overall structure is bearish and price mitigate the order block zone of daily time frame during the retracement.
💎As long as price holds momentum within the supply zone the probability favours continuation lower. The immediate moderate support sits around 4100, which now acts as the first downside magnet if selling pressure persists.
💎From Volume Spread Analysis perspective, the sequence is even more revealing. We saw a buying climax followed by a climactic action bar. This combination typically shows distribution. In simple terms, institutions use these aggressive spikes to offload positions into retail enthusiasm. When the crowd feels confident, smart money distributes quietly.
💎#SHIB swept the upper trigger line of the buying climax but failed to sustain higher levels, followed by a candle breaking below the lower trigger line. Further formation of two bar reversal adds more weight for bearish scenario. This is a classic confirmation that supply is dominating. If bearish momentum continues, the next probability of major downside target sits around 3720 and it could be reached sooner than most expect.
💎If #SHIB manages to break above the key resistance at 5870 with a strong momentum candle, this whole bearish probability would be invalidated, and we could instead see a bullish continuation. As always, we let price confirm our bias.
Discipline is key, Paradisers! The charts may look volatile, but this is where professionals thrive and amateurs panic. Don’t let emotions guide your trades. Wait for clear confirmation and manage risk like a pro. Strive for consistency, not quick profits. Treat the market as a businessman, not as a gambler.
MyCryptoParadise
iFeel the success🌴
SHIBUSDT IS FLASHING A SHORT-TERM BULLISH REVERSALYello, Paradisers! are SHIB sellers about to get trapped right at major support before the next bullish expansion begins?
💎SHIBUSDT is currently showing several bullish signals from the 4H and Daily support areas, increasing the probability of a short-term upside move if buyers continue defending these levels.
💎On the 1H timeframe, SHIB has broken out of its descending channel together with a bullish CISD. More importantly, the breakout was accompanied by unusually high selling volume compared with the surrounding candles. When heavy selling appears near support but price refuses to continue lower, it can indicate that sellers are becoming trapped and that buyers are starting to absorb the selling pressure.
💎At the same time, we can see a bullish divergence forming on the MACD. Price has been testing lower areas while momentum is improving, which suggests that bearish pressure may be weakening. SHIB is also forming a potential double-bottom structure directly around support, adding another confirmation to the bullish scenario.
💎When we combine the descending-channel breakout, CISD, heavy selling-volume absorption, MACD bullish divergence, and double-bottom formation, the probability of a bullish reaction becomes significantly stronger.
💎For upside targets, the first important area is around 0.00000471, where we have 1H liquidity and resistance. If buyers successfully push through this level, the next major target sits around 0.00000484, where additional 4H resistance and liquidity are located.
💎For entries, one approach is to wait for a pullback toward the Fibonacci golden-ratio area and look for confirmation before entering. A more aggressive approach would be a direct entry from the current area, but in that case, the invalidation should remain below the most recent swing low to maintain a proper risk-to-reward ratio.
💎For the safer retest setup, the invalidation area can be placed around 0.00000451, depending on the exact entry and confirmation received during the pullback.
💎The setup is developing well, but confirmation still matters. Do not chase price simply because several bullish signals are appearing at the same time. The strongest trades usually come when structure, momentum, liquidity, and risk management all align.
Stay patient and let the market confirm the setup before committing capital. Consistency comes from taking high-probability opportunities with controlled risk, not from forcing trades.
MyCryptoParadise
iFeel the success🌴
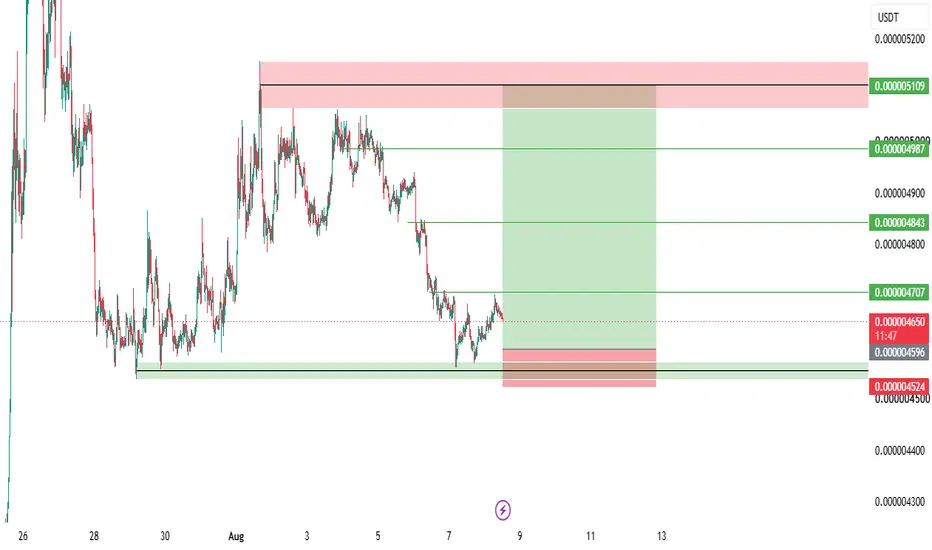
SHIB USDT LONG SIGNAL#30. SHIB /USDT – Trade Setup (LONG)
📈 Position Type: LONG
🕒 Timeframe: 1H
📊 Market: Futures
💰 Entry Zone:
0.000004559
🛑 Stop-Loss:
0.000004520
🎯 Take-Profit Targets:
• TP1: 0.0000047
• TP2: 0.000004840
• TP3: 0.000004985
• TP4. 0.0000051
Tp5.
⚙️ Leverage:
5*10
▫️ After TP1, move SL to Entry + 0.2%.
▪️ Exit Plan:
• 40% at TP1
• 20% at TP2
• 20% at TP3
20% at TP4
📌 Risk Management:
Risk only 1–2% of your capital per trade.
⚠️ Always check and confirm the setup on your chart before entering the trade.
Shiba Inu has begun a long-term bullish trend (1D)It appears that Shiba Inu's multi-year correction has come to an end, and it is now at the beginning of a medium term uptrend. Compared to most other altcoins, SHIB is in a unique position and could sustain this bullish trend for several months.
A correction is expected from the supply zone before the uptrend resumes.
The green zone offers a low-risk area to join this bullish trend.
Let's see what happens.
If you have a coin or altcoin you want analyzed, first hit the like button and then comment its name so I can review it for you.
Do you also think SHIB is bullish?
SHIBA INU SIXTH ANNIVERSARYShiba Inu celebrated its sixth anniversary on August 1, 2026, commemorating its launch in 2020. The milestone was highlighted by the community reaching over 1.6 million on-chain holders, with nearly 79,000 new wallets added in July alone. Major exchanges like LBank hosted celebratory giveaways. This is bullish for SHIB because growing holder counts signal sustained adoption and community strength, which are critical for meme coins. The anniversary-driven attention contributed to a sharp price increase, demonstrating the token's continued cultural relevance. SHIB posted its first positive monthly performance since April 2026, gaining over 11% in July. The rally was supported by a massive spike in token burn rates, which removed 3.25 billion CRYPTOCAP:SHIB from circulation, and a significant increase in transactions from large investors ("whales"). This is a positive shift in momentum, indicating that deflationary pressure from burns and renewed interest from deep-pocketed investors are helping to stabilize and lift the price after months of decline. SHIB's price surged 15.5% over the past week, trading at $0.00000496 on August 1. This rally brought its market cap to $2.9 billion, placing it just $300 million behind Hedera (HBAR) for the 25th spot among all cryptocurrencies. The move was backed by a 66% jump in trading volume. This technical breakout is bullish as it shows genuine buying pressure, not just speculative hype. Climbing the market cap rankings could attract further investor attention and liquidity, though maintaining this position requires sustained momentum. SHIB is riding a wave of celebratory sentiment, deflationary burns, and technical strength as it enters its seventh year. The key question now is whether this anniversary-fueled rally can evolve into a sustained climb back up the market cap rankings.
SHIBUSDT Technical and Fundamentals AnalysisFundamental bias
Bias for SHIBUSDT: Bearish (SHIB weaker than USDT) on a medium‑term horizon, with medium confidence.
Why (3–5 key reasons):
Post‑bubble, downtrend structure: SHIB trades around the 0.000004–0.000005 area with market cap near 2.4–2.5 billion dollars, roughly 94% below its 2021 ATH, and recent technical analysis shows price below all major moving averages in a textbook bearish formation.
Macro risk appetite is cautious, not euphoric: The crypto Fear & Greed Index at 37 (“Fear”) and commentary about macro and regulatory headwinds indicate a market that is not eager to pile into high‑beta meme coins yet.
US dollar fundamentals are solid: The US economy is expanding at a solid pace, inflation is easing toward mid‑3% levels, and the Fed is holding rates at 3.5–3.75%, giving USD positive real yields and stability advantages over speculative tokens.
Tokenomics headwind for SHIB: Roughly 589 trillion tokens already circulate and almost all supply is out; even a doubling of market cap only marginally improves per‑token price, making big sustainable moves harder without enormous new capital inflows.
Event‑driven rallies, not structural demand: Recent SHIB spikes have been linked to short‑term burn surges and regional trading bursts rather than persistent ecosystem revenue growth, which usually fades once hype cools.
SHIB | Meme SZN is Knocking & The Dog is Barking AgainCrypto meme coin traders be like: 90% down: "Just a healthy correction"
9% up: "WE ARE SO BACK !" come on guys! but I got some goood news..
Every crypto cycle has that one coin that ignores logic, laughs at fundamentals, and sends CT into full "WAGMI" mode. Today, that dog is barking again! SHIB is catching fresh bids as traders rotate back into high beta meme coins, helped by a jump in token burns, improving ecosystem sentiment, and a broader risk on mood across crypto. The market suddenly remembered that memes don't need permission to pump
Today's rally feels like classic degen behavior. Bitcoin starts looking healthy, altcoins wake up, and suddenly everyone becomes a "long term investor" in a coin they sold yesterday. Higher burn activity gives the SHIB Army something to celebrate, while FOMO traders are chasing green candles like they're limited edition NFTs. The chart says "momentum," but Crypto Twitter says "SEND IT."
As always, respect volatility because meme coins can print gains faster than they print emotional damage
wait! where is the good news MoonMaster ? well we got crypto bull market ahead and this is how coins pump in bull market, liquidity usually trickles from Bitcoin to large cap alts, then into the ultimate casino.. meme coins. That's when Meme SZN starts whispering "GM" before screaming "TO DAA MOON" Historically, once retail fully wakes up, DOGE, SHIB, and the rest of the meme gang often become exit liquidity... until they become everyone's favorite bags again. That's just crypto bein crypto
Zoom out, dont be too happy
For now, the bulls have grabbed the leash, but this is still SHIB, where a 20% candle is considered "just warming up." If the overall market stays bullish, the dog may keep running. If not, expect paper hands to panic, diamond hands to post motivational memes, and degens to shout "buy the dip" before the dip finishes dippin
In crypto, fundamentals pay the bills, but sometimes memes pay for the Lambos.
WAGMI..probably🚀
SHIB Analyses-15, [July 26, 2026]Welcome to my page! I share daily technical analyses of crypto assets and other charts here.
BINANCE:SHIBUSDT
💡Market Analysis:
Price has broken above the major descending trendline with strong bullish momentum (solid body breakout). Following the strategy, we look for entry on a pullback to the broken key zone with invalidation below the recent swing low.
Key Support & Resistance:
Key Resistance: 0.00000660 / 0.00000940
Key Support Area: 0.00000500 - 0.00000410
🎯 Trade Entry & Exit Plan:
Entry : Breakout/Pullback of trendline or key zones with >80% candle body.
Stop Loss : Behind the last wave or the last breakout candle.
Take Profit : Minimum R:R 2, with further targets at major horizontal levels.
⚠️Risk Management:
Maximum 1% risk per trade.
❤️Please share your thoughts and comments on this analysis!