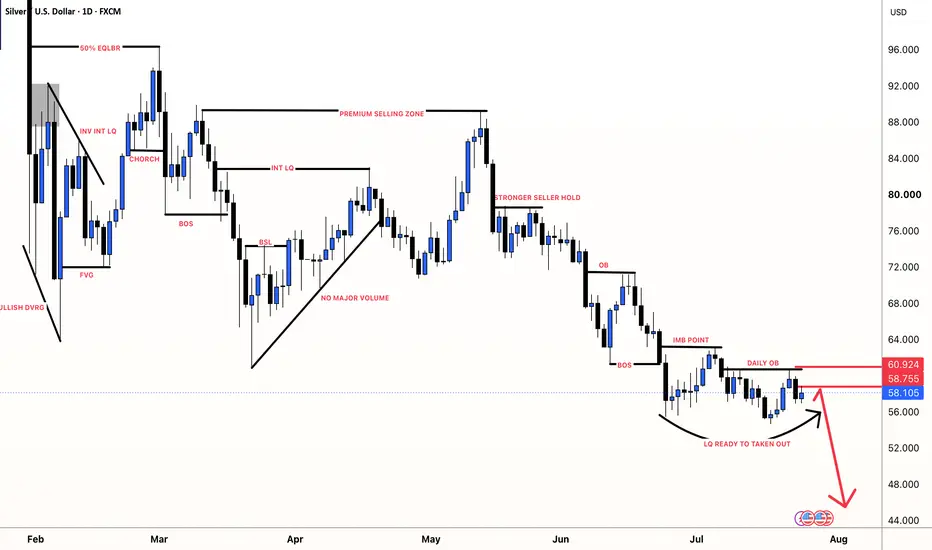
#SILVER: XAG Is Ready To Meltdown, Get Ready Next $40Silver has once again failed to break through a critical resistance level. Given this, we believe the short-term bullish trend is over and a sharp decline is likely. We’ve identified a potential entry and exit zone and a target price of $40. This move will probably be a swing trade and could take some time to complete.
Like and comment for more trading ideas.
Team Setupsfx_
In-depth trading ideas
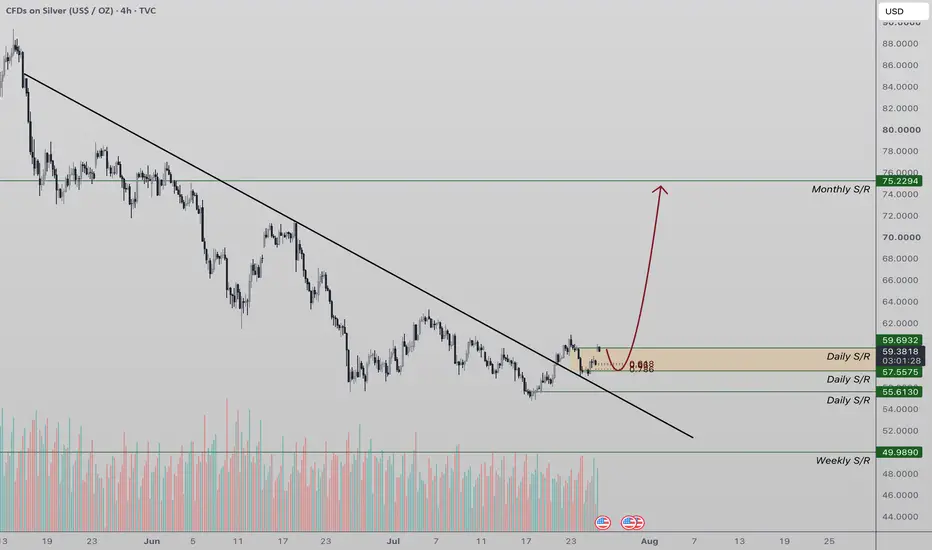
Silver Eyes Breakout, $75 Incomming Silver price action continues to display strength after successfully holding above the key high timeframe support at $57.
This region has now been retested and confirmed, with additional confluence coming from the 0.618 Fibonacci retracement and the dynamic resistance trendline that has now flipped into support. The successful defence of this area suggests buyers are absorbing selling pressure and building a foundation for the next leg higher.
As long as price action remains above the $57 support, the current structure continues to favour accumulation rather than distribution. Consolidation above this level would reinforce bullish market structure and increase the probability of another impulsive move higher. The recent retest also removes inefficiencies left by the previous rally, creating a healthier market structure before continuation.
The next major hurdle sits around the $59 resistance, which aligns closely with the psychological $60 level. A decisive breakout and daily close above this region would confirm bullish continuation and likely trigger fresh momentum from both technical traders and breakout participants. If this occurs, the path towards the next major high timeframe objective around $75 becomes increasingly probable.
For now, bulls remain in control while price holds above support. The $57 level remains the key invalidation point, while a break above $59 could be the catalyst that begins Silver's next major expansion phase.
XAG/USD Bearish Rejection Signals Further DownsideSilver remains under bearish pressure after rejecting the 59.50–60.00 resistance zone, where strong selling interest entered the market. The failure to break above this level suggests that buyers are losing momentum while sellers continue to dominate the trend.
The downside move is being supported by a combination of technical weakness and fundamental factors. A stronger US Dollar, profit-taking after the recent rally, and cautious market sentiment ahead of key US economic data and Federal Reserve expectations are all contributing to the decline. These factors have reduced buying interest in precious metals and increased bearish pressure on Silver.
Resistance: 59.20 / – 60.00
Support: 57.50 / : 56.00
Technically, Silver has formed a lower high, indicating a potential trend continuation to the downside. If price remains below the 59.20–60.00 resistance area, sellers are likely to stay in control. A break below the 57.50 support could accelerate the decline toward the next major support near 56.00.
Hope you found this analysis helpful. 👍
Like, Comment & Follow for more updates. Trade safe.
XAG/USD | Bearish structure remains intactBy examining the 4H chart of Silver we can see that after it was rejected by the Supply Zone, went as low as 56.64, and it is currently being traded around 57.90.
Despite the positive news regarding war, another ceasefire and negotiations restarting, Silver couldn't make an upwards move and dropped even further, showing that it is still bearish. Tonight we also have FOMC, which can shake the market entirely.
In my view, Silver remains bearish regardless of FOMC, it may surge after the FOMC news, but I expect it to drop afterwards, continuing its bearish movement considering all the geopolitical tensions.
However if Silver manages to break above the 4H FVG and stabilize above it, it could go towards the Supply Zone to retest it, sweeping the liquidity pools above the 60.09 and 60.92 levels respectively.
#XAGUSD: Silver Is Getting Ready For Big Move, Will FOMC Affect?🔺Silver is poised for a significant decline. However, to reach our second target, stronger fundamental support is required which will be confirmed after the FOMC meeting scheduled for 19:00 BST. There is one entry zone with a clear invalidation and entry point.
🔺We have also marked two take-profit targets with the final target at $44. In our view, a small entry with accurate risk management can be successful but is risky as the exact outcome of the news is uncertain.
🔺We recommend closely monitoring the news and allowing the market to settle. If the news is hawkish or interest rates are increased, it will trigger a sharp decline in silver prices. Conversely, if the news is dovish, the price is likely to become bullish and a sharp bullish impulse may occur.
Silver Price Action: Bullish Reaction Setup Near Key SupportSilver is currently trading near the equilibrium area after a strong bearish move from the premium zone. The chart suggests a potential liquidity sweep and bullish reaction from the discount/support area.
A possible bullish scenario is a dip toward the 56.16–56.15 support zone, followed by a strong rejection and bullish confirmation. If price successfully reclaims the 57.04–57.42 area, the upside targets could be 58.80 (PDL), 59.70 (PWH), and potentially 60.90 (PDH/Strong High).
This analysis is based on market structure, liquidity levels, premium/discount zones, and potential price reaction. Wait for confirmation before considering any trade setup, and always manage risk according to your own strategy. This is an educational market analysis, not financial advice.
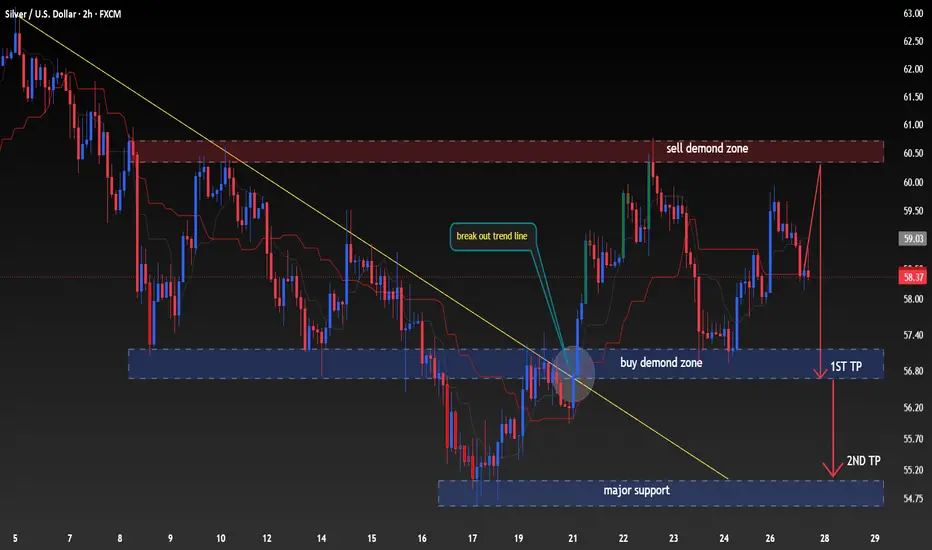
XAGUSD (Silver) – 2H Chart Analysis...XAGUSD (Silver) – 2H Chart Analysis
Based on the chart structure, price has rejected from the sell-side supply zone (60.40–60.70) and is currently trading below a short-term resistance. The recent pullback suggests sellers are attempting to regain control while the previous breakout demand zone is being retested.
📉 Bearish Scenario (Preferred)
Entry Area: Around 58.30–58.50
🎯 Target 1: 56.80
Previous demand zone and first support.
Likely area for partial profit-taking.
🎯 Target 2: 54.80 – 55.00
Major higher-timeframe support.
Strong demand zone where buyers may return.
🛑 Invalidation Level:
A sustained close above 60.40–60.70 would weaken the bearish outlook and increase the probability of a move toward higher resistance.
XAGUSD | 2H | Technical Outlook
Silver is showing signs of weakness after reacting from a higher-timeframe supply zone. The recent rejection suggests that sellers remain active while price trades below key resistance. If bearish momentum continues, the market may revisit nearby demand levels before determining its next directional move.
The first area to monitor is around 56.80, where previous buying interest was observed. If selling pressure remains strong and this support fails to hold, the next technical objective is the 54.80–55.00 region, which aligns with a significant higher-timeframe support zone.
A recovery above the recent supply area would reduce the probability of this bearish scenario and could indicate renewed buying strength. As always, wait for confirmation from price action and manage risk according to your own trading plan.
Key Levels
Resistance: 60.40–60.70
Support 1: 56.80
Support 2: 54.80–55.00
XAGUSD: Silver continues to weaken within a bearish channelXAGUSD remains within a downward-sloping price channel, characterized by a series of lower highs. The price is currently trading below both the EMA34 and EMA89, indicating weak recovery momentum and continued seller dominance.
The $58.70 level acts as key resistance. Should the price attempt a recovery but face rejection at this level, selling pressure could drive silver back down to the $55.80 area, corresponding to the channel's lower boundary.
Fundamentally, the US dollar is supported by expectations that the Federal Reserve will maintain a cautious stance as the market awaits US employment data. This environment continues to weigh on precious metals in the short term.
A "SELL" strategy is preferred if the price weakens below $58.70, with an immediate target of $55.80.
Silver Forecast: POI Retest Could Trigger a Sharp DeclineXAGUSD is trading below a significant Point of Interest (POI) near the 59.30–59.70 resistance zone, where sellers are expected to remain active. The current market structure favors a bearish continuation as long as price stays below this supply area.
A short-term pullback into the highlighted POI could provide a high-probability selling opportunity before the next downside expansion. If the resistance holds, Silver may continue its decline toward the 54.79 support level.
Key Technical Levels
* Market Bias: Bearish
* Resistance (POI): 59.30–59.70
* Trend: Bearish
* Confirmation: Bearish rejection from the POI
* Target: 54.79
This analysis is based on price action, market structure, liquidity concepts, and resistance zone analysis. Always wait for confirmation before entering any trade and follow proper risk management.
⸻
Not Financial Advice. This analysis is for educational purposes only. Always do your own research and manage your risk before trading.
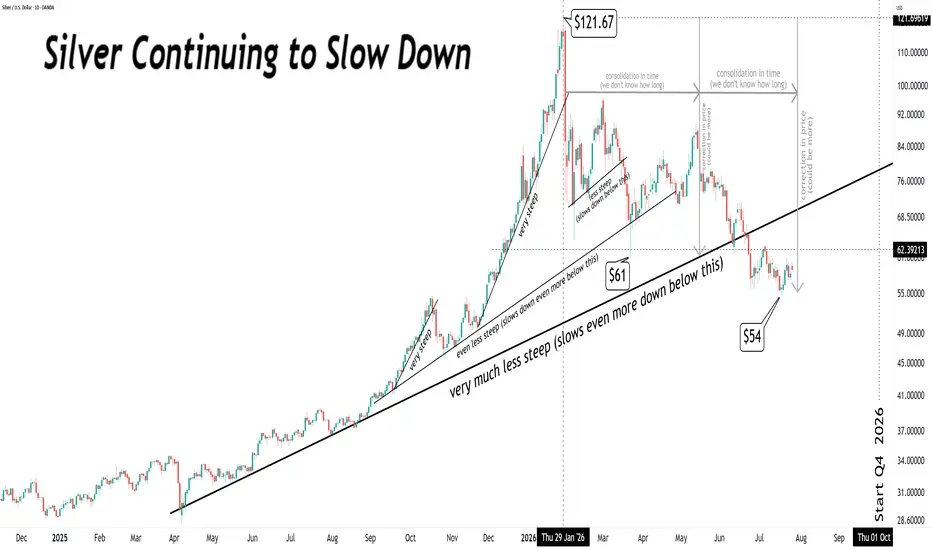
Silver (XAGUSD)Silver (XAGUSD) | Long-Term Outlook
After reaching a major peak near $121, Silver has faced persistent selling pressure, leading to an extended corrective phase. The recent weekly decline suggests that bearish momentum remains dominant as buyers continue to struggle at higher prices.
As long as $62 remains a strong resistance level, the broader corrective trend is likely to continue. A failure to reclaim this level could expose Silver to a deeper decline toward the Demand Zone at $51.20–46.42, with an extended correction potentially reaching the $40 area.
Bullish Confirmation
The long-term bullish outlook will strengthen only if Silver can:
Form a strong weekly rejection candle from support.
Establish a higher low (HL) and confirm a bullish market structure.
Hold firmly above the $39 level, signaling that long-term buyers are defending the trend.
Until these confirmations appear, traders should remain cautious and treat any short-term rebounds as corrective moves rather than a confirmed trend reversal.
Key Levels
Resistance: $62.00
Demand Zone: $51.20–46.42
Major Support: $40.00
Bullish Structure Confirmation: Hold above $39.00
Always wait for price action confirmation and manage risk appropriately before entering any trade.
🔥Trading futures, forex, CFDs and stocks carries a risk of loss.
Please consider carefully whether such trading is suitable for you.
This content is not financial advice. Always conduct your own financial due diligence.
>>GooD Luck 😊
❤️ Like and subscribe to never miss a new idea!
XAG/USD | finally breathing!By analyzing the 4H chart of Silver we can see that it surged with this week's open, going from 58.19 all the way to 60.09, but then it was rejected by the supply zone and it is now being traded at around 59.50.
With geopolitical tensions easing down, US and IR stopping attacks on each other, and the news of negotiations taking place once more, I expect Silver to continue going higher, unless the tensions and the war escalate once more, I don't see Silver drop.
Now I expect Silver to retest the 4H FVG and the Supply Zone once more and break above them eventually, sweeping the minor liquidity pool above the 60.92 in the process and then go towards the liquidity pools above the 61.86 and 63.27 levels respectively.
However if Silver is rejected by the FVG or the supply zone, it could drop to the lower 4H FVG and if it fails to stabilize above the FVG's C.E. at 57.64, it'll drop further towards the 57.06 to sweep the sellside liquidity there.
XAGUSD: Contracting triangle still favors the bearsXAGUSD is currently compressed within a triangle pattern, yet the overall structure has not broken free from the downtrend. Upside attempts consistently stall around the $59.50 level, while the price continues to fluctuate below the Ichimoku Cloud and multiple overhead Fair Value Gaps (FVGs).
Fundamentally, silver remains under pressure from the US dollar and US Treasury yields, as the Federal Reserve has yet to signal clear monetary easing. This makes it difficult for buying momentum to be sustained in the short term.
The preferred scenario is for the price to face continued rejection below $59.50, followed by a move down to test the rising support line near $57.10. A break below this level could trigger intensified selling pressure.
Current outlook: Prioritize SELL positions if the price weakens below $59.50, with an initial target at $57.10.
XAG/USD Near Trendline Support | Watching for a Possible BreakdoSilver is approaching an important technical support area where an ascending trendline intersects with recent price action. Following the rejection from range resistance, the market is entering a key decision zone that may determine the next short-term direction.
The illustrated projection suggests that price may attempt a brief recovery before encountering selling pressure and revisiting lower support levels. This remains one possible technical scenario and should be confirmed through future price action.
If buyers successfully defend the trendline and reclaim the recent swing high, the technical picture would improve. Until then, support and resistance remain the primary areas to monitor.
Important Levels
Support
57.80
57.30
56.70
Resistance
58.50
58.90
59.00
Potential Targets
Target 1: 57.80
Target 2: 57.30
Target 3: 56.70
Technical Breakdown of the ChartThe Reversal Structure:The price dropped significantly within a descending channel (represented by the white parallel trendlines). It found a floor, formed a base, and has now broken out of that downward channel.The Support Zone: The horizontal orange/brown shaded box highlights a demanded support area near the $57.00 - $57.50 level.The Trigger Event: As highlighted by the orange box, the price returned to test this support floor and rejected lower prices. It printed a candlestick with a long lower shadow (similar to a Dragonfly or Standard Doji variant) directly on that support line.The Current Shift: Following that test of support, the asset bounced cleanly. It is now trading inside a new ascending (upward) channel marked by the blue trendlines, signaling that buyers are temporarily in control.
XAG Entery levels!Hello guys!
Two green zones can be two suitable entry steps for a spot perspective!
Based on the summary of US institutions' forecasts and the uncleared block in the $70 range, we can consider $70 as the equilibrium price for silver. After entering at lower prices, we hold it until it reaches this price.
NFA-DYOR
#javanshiracademy #Retrader
SILVER (XAG/USD): Bullish Move From Support ConfirmedThis morning, 📈SILVER is showing a strong bullish move on the intraday chart.
The price violated the neckline of a double bottom pattern on an hourly timeframe.
We anticipate a continued upward movement in the market.
The next target is set at 58.76.
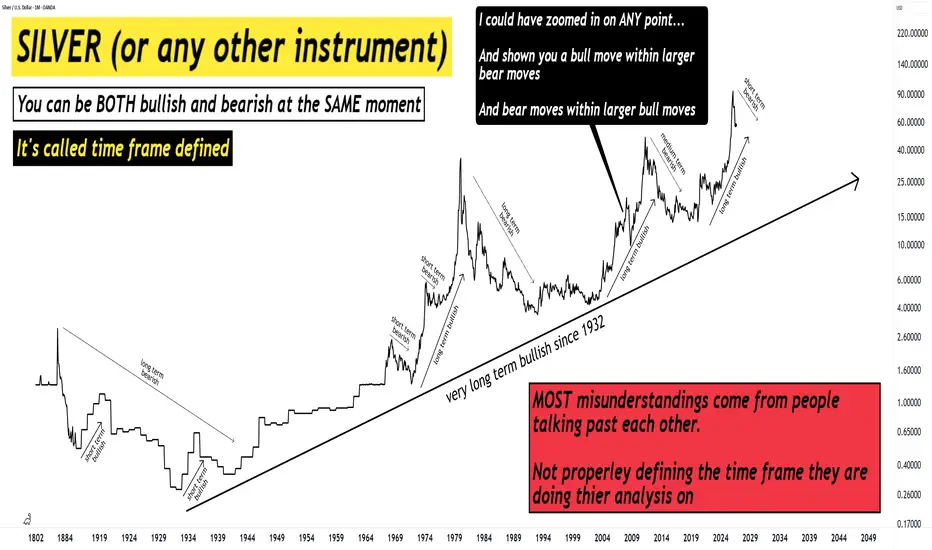
Eventually, silver will stage a CRAZY rally.Eventually, silver will stage a CRAZY rally.
But it's unlikely to be the one that sends it straight to $250+.
Once that rally fizzles out, the real waiting begins. The true breakout pattern could take twice as long to form.
We haven't even started the first rally.
XAG/USD (Silver) Technical Analysis🥈 XAG/USD (Silver) Technical Analysis – Bearish Retracement Ahead 📉
Silver remains within a broader bullish structure, but the current price action suggests that the recent rally may be losing momentum. After creating a strong impulsive move, price filled the highlighted gap (imbalance) and is now showing signs of rejection near the 59.50–60.00 supply region.
🔍 Market Structure
✅ Higher highs and higher lows confirm the larger bullish trend.
⚠️ Price has reached a premium area where sellers are becoming active.
📉 The recent rejection from the imbalance indicates weakening bullish momentum.
🎯 A short-term pullback is likely before any continuation higher.
📊 Key Levels
🟢 Resistance: 60.90–61.00
🔴 Current Rejection Zone: 59.40–59.80
🟩 Target (FVG / Demand Zone): 57.20–57.60
🛡️ Major Support: 55.00
💡 Trading Outlook
A temporary bullish retracement toward 59.60–59.90 is possible, but unless buyers reclaim and hold above 60.00, the probability favors a bearish move into the Fair Value Gap (FVG) around 57.20–57.60. This zone could attract fresh buying interest for the next bullish leg.
🎯 Trade Bias
📈 Short-Term Bias: Bearish
🎯 Sell Zone: 59.50–59.90
🛑 Invalidation: Sustained breakout above 60.00–60.20
📉 Bearish Target: 57.20–57.60
⚠️ Conclusion: The chart suggests a short-term corrective decline after the imbalance fill. Watch for rejection near current resistance, as sellers may drive price toward the highlighted FVG demand zone before the broader uptrend resumes.
Heading toward 38.2% Fib resistance?XAG/USD is rising toward the resistance level, which is a pullback resistance that is slightly above the 38.2% Fibonacci retracement and could reverse from this level to our take profit.
Entry: 58.16
Why we like it:
There is a pullback resistance that is slightly above the 38.2% Fibonacci retracement.
Stop loss: 59.82
Why we like it:
There is a pullback resistance level.
Take profit: 56.81
Why we like it:
There is a pullback support level.
Enjoying your TradingView experience? Review us!
Please be advised that the information presented on TradingView is provided to Vantage (‘Vantage Global Limited’, ‘we’) by a third-party provider (‘Everest Fortune Group’). Please be reminded that you are solely responsible for the trading decisions on your account. There is a very high degree of risk involved in trading. Any information and/or content is intended entirely for research, educational and informational purposes only and does not constitute investment or consultation advice or investment strategy. The information is not tailored to the investment needs of any specific person and therefore does not involve a consideration of any of the investment objectives, financial situation or needs of any viewer that may receive it. Kindly also note that past performance is not a reliable indicator of future results. Actual results may differ materially from those anticipated in forward-looking or past performance statements. We assume no liability as to the accuracy or completeness of any of the information and/or content provided herein and the Company cannot be held responsible for any omission, mistake nor for any loss or damage including without limitation to any loss of profit which may arise from reliance on any information supplied by Everest Fortune Group.