$SIREN is sitting at a key decision point. Price has been holdinCRYPTOCAP:SIREN is sitting at a key decision point. Price has been holding the support zone after bouncing from the lower trendline, while continuing to press against the descending resistance.
A clean 4H close above the trendline and the 50 EMA would be the first real sign that momentum is shifting back to the bulls. If that happens, a move toward the 99 EMA and higher resistance levels becomes much more likely.
For now, the support zone is doing its job. As long as it holds, the breakout setup remains valid. The next few candles will be important.
In-depth trading ideas
SIREN — The Coin That Looks Too Good to Be True
For weeks now, I’ve been seeing people post ideas about SIREN, some of them multiple times. From that, I can only conclude that many have either been stopped out repeatedly or even liquidated.
The fact that they keep posting the same idea is a classic example of becoming married to a coin. It’s like realizing a relationship isn’t working, yet continuing to force it because you’re afraid of losing the other person. Not exactly the best foundation for a healthy marriage.
Technical Analysis
First of all, one of the biggest mistakes traders make is believing that “buy low, sell high” is a complete strategy.
In reality, “buy a higher low, sell high” makes far more sense. A higher low suggests that buyers are actually stepping in and defending price, rather than simply trying to catch a falling knife.
In the case of SIREN, many traders seem to be trying to predict the behavior of a herd that consists of only one or two cows. That’s almost impossible.
Markets work best when there is broad participation. The more traders involved, the more meaningful technical analysis becomes. When ownership is highly concentrated, price action can be dictated by a very small number of participants, making chart patterns and technical levels far less reliable.
Of course, I understand the math. If the coin rises from its current price, the percentage gains can look very attractive.
At the time of writing, SIREN is trading around 0.0428.
Let’s do the dream calculation.
A trader puts €100 into SIREN with 5x leverage, creating a €500 position. If SIREN somehow manages to climb from 0.0428 back to its all-time high around 4.50, the position would increase by roughly 105x.
That €500 position would grow to approximately €52,500.
Sounds amazing.
Yeah, sure.
The first problem is that there is a very high probability you get liquidated long before that happens.
The second problem is that people often underestimate how quickly low-liquidity coins can collapse. Just because SIREN is trading at 0.0428 today doesn’t mean it can’t trade at 0.00428 tomorrow. Or 0.000428. Or even lower.
A coin can lose 90%, then another 90%, then another 90%.
Many traders understand compound gains, but somehow forget that compound losses work exactly the same way.
If you want to take a trade like this, trade an amount you are genuinely willing to lose and preferably without leverage.
Even highly respected coins such as SOL can be dangerous. A beautiful chart pattern does not guarantee a successful trade. In fact, SOL is a good example of a market where the largest wallet holders own only a relatively small percentage of the supply compared to many microcaps.
Yet even there, if everybody becomes bullish at the same time, the trade becomes crowded. When too many traders pile into the same long position, a long squeeze can occur. Price first moves sharply lower, triggering stop losses and liquidations before continuing in the intended direction.
The problem is that attractive upside alone is not a trading edge. Liquidity, participation, and market structure matter just as much.
A coin can double in price, but if a handful of wallets control most of the supply, you’re not really analyzing a market anymore — you’re trying to predict the decisions of a few individuals.
The question is not:
“Can SIREN reach $4.50 again?”
The question is:
“Why would people still use SIREN two years from now?”
That is a much harder question to answer.
Marketing creates attention.
Utility creates longevity.
At the moment, I’m not convinced that a nice website alone is enough to justify a long-term investment thesis.
My Position
Despite all of the above, I have opened a small position.
A market order of just $20.
Why?
Because that’s exactly what I’m willing to lose.
I’m not betting the farm.
I’m not taking leverage.
I’m not pretending I know where the price will be next month.
I simply recognize that there is a small chance of an outsized return and a very real chance that the entire position goes to zero.
For me, that’s the difference between a calculated speculation and an investment.
Final Thoughts
For that reason, I personally prefer trading highly liquid top-50 cryptocurrencies, taking smaller moves with controlled risk.
Coins like SIREN may offer lottery-ticket returns, but they should be treated accordingly.
The chart may look promising, but for me the real question is not whether SIREN can go higher.
The real question is whether there are enough independent buyers and sellers to make technical analysis reliable in the first place.
Until that question is answered, I’ll treat SIREN exactly for what it is:
A speculative bet with potentially huge upside, but equally huge risk.
IF you have another 200 bucksSIREN, another SCAM COIN, potentially gonna go up again, maybe in 3 weeks time.
Position your IDLE Casino 200 bucks, for 20k.
Analysis here is that Dev team still has a lot of coins on their hand, they need retails to purchase, so they are going to do their routine manipulation to higher price, once you are convinced, they will start dumbing against you.
They done it 3 times, this is 4th . Somehow this is their monthly revenue.
SIREN: Preparing for a 150% Breakout? SIREN is showing signs of accumulation after an extended consolidation phase. If momentum returns and key resistance levels are reclaimed, the setup could support a much larger expansion move, with a potential 150% upside target from current levels.
For this scenario to play out, buyers need to maintain support, volume must continue increasing, and the broader market environment should remain favorable. A clean breakout above major resistance would be the first confirmation that bulls are taking control.
Key levels to watch:
• Major resistance breakout zone
• Volume expansion
• Higher highs and higher lows structure
Remember, potential does not equal certainty—wait for confirmation and manage risk accordingly.
SIREN – 30% Correction Loading?SIREN has had a strong run, but signs of exhaustion are starting to appear as momentum slows and profit-taking increases. If key support levels fail to hold, a 30% correction could be the next major move.
A pullback of this size would be normal after a strong rally and could help reset the market before the next trend develops. Traders are now watching support zones closely to see whether buyers step in or sellers take control.
The next few days could be critical for SIREN’s price action.
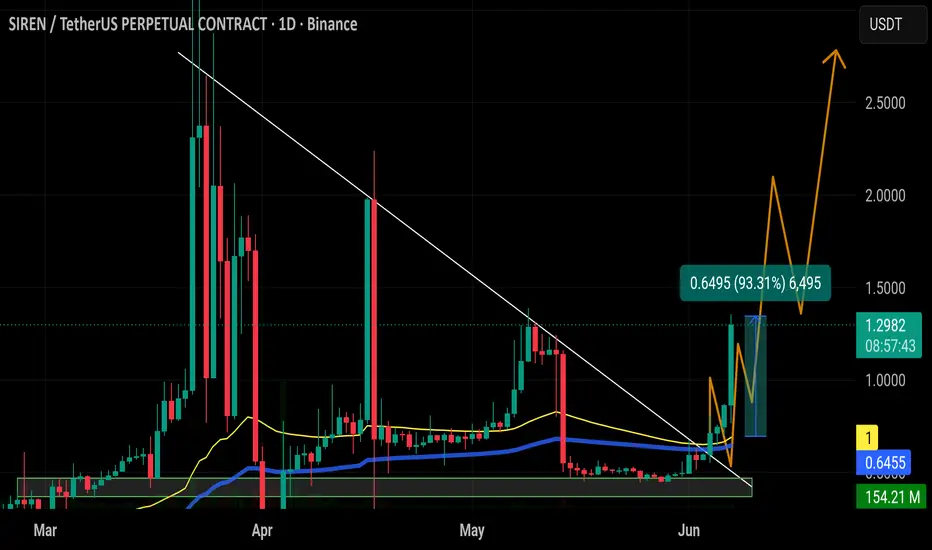
$SIREN respected the breakout perfectly and delivered a massive 🚀 CRYPTOCAP:SIREN respected the breakout perfectly and delivered a massive +93% pump after holding above the descending trendline.
The breakout confirmation attracted strong buying pressure, and as long as the breakout zone continues to hold as support, CRYPTOCAP:SIREN could be preparing for another leg higher toward key resistance levels ahead. 📈🔥
SIRENUSDT Forming Bullish MomentumSIRENUSDT is forming a clear bullish momentum pattern, a classic bullish wave signal that often indicates an upcoming breakout. The price has been consolidating within a narrowing range, suggesting that selling pressure is weakening while buyers are beginning to regain control. With consistent volume confirming accumulation at lower levels, the setup hints at a potential bullish breakout soon. The projected move could lead to an impressive gain of around 240% to 250% once the price breaks above the key resistance zone.
This bullish momentum pattern is typically seen at the end of downtrends or corrective phases, and it represents a potential shift in market sentiment from bearish to bullish. Traders closely watching SIRENUSDT are noting the strengthening momentum as it nears a breakout zone. The strong trading volume adds confidence to this pattern, showing that market participants are positioning early in anticipation of a reversal.
Investors’ growing interest in SIRENUSDT reflects rising confidence in the project's long-term fundamentals and current technical strength. If the breakout confirms with sustained volume, this could mark the start of a powerful bullish leg. Traders might find this a valuable setup for medium-term gains, especially as the pattern completes and buying momentum accelerates.
A move of this magnitude would place SIRENUSDT among the more attractive high-upside opportunities for traders seeking strong growth potential. As momentum continues to build, market participants will be closely monitoring the breakout level for confirmation of the next major trend.
✅ Show your support by hitting the like button!
✅ Leave a comment below! (What is your opinion about this coin?)
Your feedback and engagement keep me inspired to share more insightful market analysis with you! 🚀📈
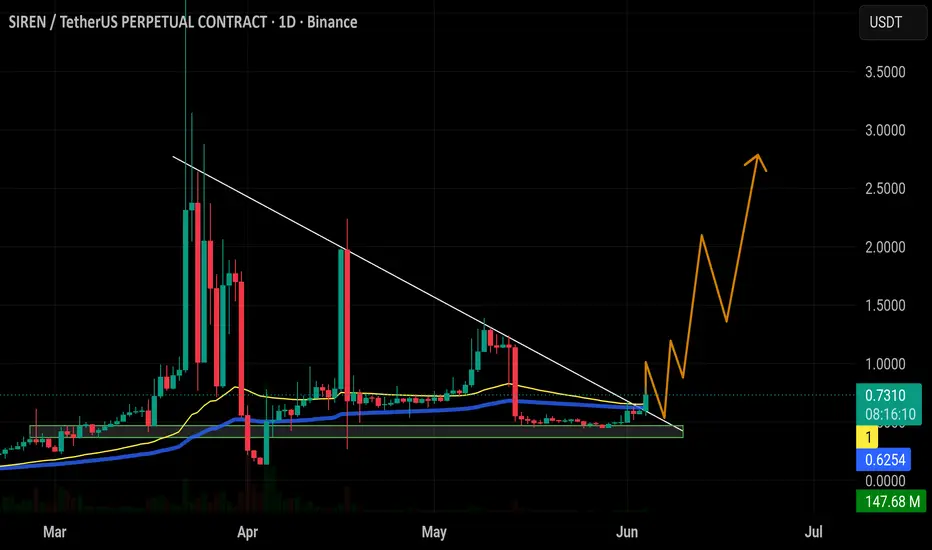
$SIREN is waking up after weeks of consolidation. Price has brokCRYPTOCAP:SIREN is waking up after weeks of consolidation. Price has broken above the descending trendline, volume is picking up, and buyers are starting to regain control.
The key level now is holding above the breakout zone around $0.65 to $0.70. If bulls can defend this area, the next major targets sit around $1.00, $1.50, and potentially $2.50+ as momentum accelerates.
The trend has shifted from compression to expansion. As long as support holds, this breakout could be the start of a much larger move. 🚀📈
SIREN/USDT - Strong Bullish Impulse Breaking Long-Term DowntrendMarket Structure
Price was in a prolonged downtrend for weeks, respecting a clear descending trendline.
Strong support formed around the 0.50 - 0.536 zone (Point C).
Major bullish development: Sharp impulsive move upward breaking the long-term descending trendline — labeled "New Impulse".
Current Situation
Price currently trading at ~0.5360
Healthy pullback after the impulse
Successfully broke out of the multi-week downtrend
Key Levels
Support:
0.5360 (Current)
0.5000 - 0.5150 (Major support zone)
Resistance:
0.60 - 0.62 (First target)
0.65 - 0.68 (Next major resistance)
0.80+ (Extension target if momentum continues)
Fundamentals & News
CRYPTOCAP:SIREN (BNB Chain) is an AI-powered meme coin project featuring SirenAIAgent — a dual-personality on-chain AI analyst (Golden for conservative guidance, Crimson for high-risk plays).
Positioned as the "first fully on-chain AI analyst agent" on BNB Chain.
Experienced extreme volatility: Massive pumps (ATH ~$3.6–$3.8, multi-billion market cap moments) followed by sharp corrections (including 80-90%+ drops). Heavy concentration concerns in early wallets noted by analysts like ZachXBT.
Currently ~$370M–$390M market cap with decent 24h volume. Strong social hype and community activity recently.
Note: High-risk speculative play — typical of AI meme narratives. Watch for sustained volume and real AI utility adoption.
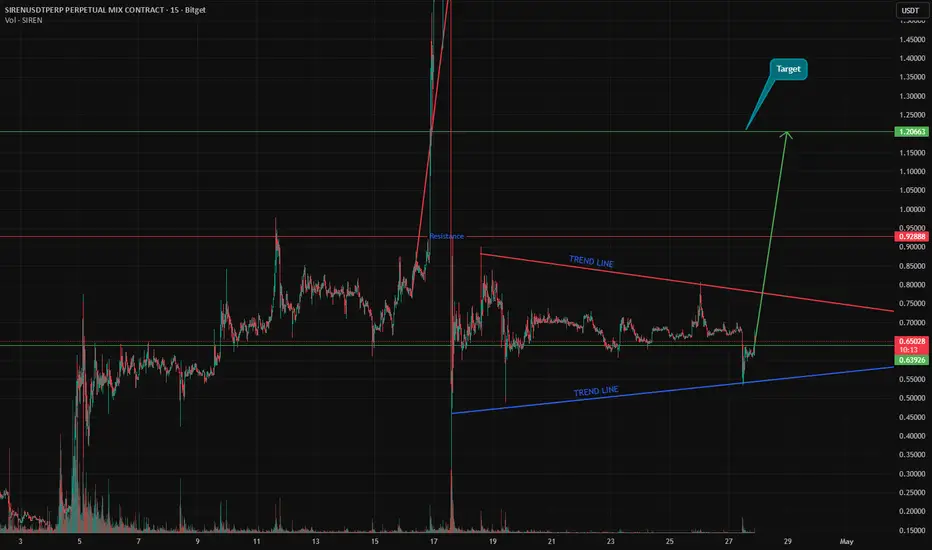
Descending Wedge Breakout Price has been consolidating within a descending wedge pattern for an extended period, forming lower highs while holding above a rising support trend line. After a prolonged compression, price has broken out to the upside, signaling a potential trend reversal.
Key Levels:
Current Price: 0.63926
Resistance: 0.92888 — first major hurdle to watch
Target: 1.20663 — upon successful breakout and resistance flip
The breakout from the wedge structure suggests bullish momentum is building. If price sustains above the breakout zone and clears the 0.92888 resistance, the next target is 1.20663, representing a significant upside move.
SIREN Update🚨📊 SIREN Update
After an amazing uptrend, SIREN faced strong selling pressure 📉
At the red resistance zone around $2,
sellers pushed the price down aggressively 🔴
Price has now dropped around -65% from the top ⚠️
Watching for stabilization and potential reaction at lower levels before the next move.
SIRENUSDT Breakout from Consolidation Box — Long SetupSIRENUSDT has finally broken out of its consolidation range with a decisive close above the box.
Bullish market structure is now evident through HHs and HLs formation, while rising volume suggests strengthening participation.
As long as price holds above the breakout zone, bias remains bullish for further upside expansion.
SIRENUSDT — Multi-Timeframe Surf Setup (15M → 1H → 4H Alignment)⚛️ THESIS:
This is a clean multi-timeframe continuation setup built on alignment across the 15M, 1H, and 4H.
Not chasing the move — this is about recognizing when the market transitions into trend acceptance across timeframes.
⚛️ STRUCTURE (WHAT I’M SEEING):
• 15M → strong reclaim and holding above short-term structure
• 1H → crossback and acceptance back above value
• 4H → beginning to rotate higher after compression
We’re no longer in expansion from lows —
we’re in the early stages of continuation if acceptance holds.
⚛️ THE EDGE (SURF SETUP):
Price is now “surfing” higher timeframes:
✔ Holding above key EMAs
✔ Building higher lows
✔ No aggressive rejection from value
This is where most traders get chopped —
trying to fade strength instead of recognizing acceptance.
⚛️ EXECUTION PLAN:
🟢 Primary Scenario (Continuation):
If price continues to hold above current structure:
→ Look for continuation toward higher timeframe liquidity (4H range highs / prior expansion zones)
→ Entries favor pullbacks into structure (not chasing highs)
🔴 Invalidation:
If we lose:
→ 1H structure
→ Acceptance back below value
Then this becomes rotation again, not continuation.
⚛️ KEY IDEA:
This isn’t about calling a breakout.
This is about recognizing when:
Structure + Timeframe Alignment = Trend Acceptance
⚛️ COMMON MISTAKE HERE:
❌ Shorting into strength
❌ Fading higher lows
❌ Ignoring timeframe alignment
⚛️ FINAL THOUGHT:
Most traders look for entries.
I’m looking for environment first —
then executing when the market is already showing its hand.
👉 Not signals — just how I structure trades around market phases.
SIREN Explodes +500% — Can It Hit $1 Next?Today, I want to share an analysis of one of the trending AI projects these days, called Siren ( KUCOIN:SIRENUSDT ), in a 15-minute timeframe
Stay with me.
What is the Siren(SIREN) Project?
Siren is a BNB Chain token powered by SirenAIAgent — an AI trading assistant with two distinct personalities inspired by Greek mythology.
Golden Siren: Calm, strategic, and analytical guidance.
Crimson Siren: Bold, high-risk, momentum-driven insights.
Blending AI with DeFi, SIREN aims to deliver smart market analysis and trading tools in the evolving AI-agent narrative.
In the past 24 hours, SIREN token has managed to increase its price by over 500%, which has really drawn attention from the entire trading community.
Currently, the SIREN is moving near its supply lines, and Cumulative Long Liquidation Leverage($0.545-$0.496).
In terms of Elliott Wave theory, it seems that the SIREN has completed Wave 4, and we can expect a +50% price increase for the project to complete Wave 5.
I expect that the SIREN can pump at least to the Potential Reversal Zone(PRZ) .
What do you think about the SIREN? Can it surpass $1.00 in trading?
Cumulative Short Liquidation Leverage: $1.126-$0.876
Cumulative Long Liquidation Leverage: $0.242-$0.1916
💡 Please respect each other's opinions and express agreement or disagreement politely.
📌 Siren Analyze (SIRENUSDT), 15-minute time frame.
🛑 Always set a Stop Loss(SL) for every position you open.
✅ This is just my idea; I’d love to see your thoughts too!
🔥 If you find it helpful, please BOOST this post and share it with your friends.