SKY/USDT (4h) Approaching Resistance Inside a Rising WedgeSKY/USDT is moving higher inside a rising wedge on the 4H chart, with price approaching the upper resistance area.
A confirmed breakout above the upper trendline could support further upside. However, rising wedges often carry bearish risk, so rejection from resistance or a breakdown below the ascending support could signal a deeper correction.
In-depth trading ideas
SKYUSDT Forming Falling WedgeSKYUSDT is forming a clear falling wedge pattern, a classic bullish wave signal that often indicates an upcoming breakout. The price has been consolidating within a narrowing range, suggesting that selling pressure is weakening while buyers are beginning to regain control. With consistent volume confirming accumulation at lower levels, the setup hints at a potential bullish breakout soon. The projected move could lead to an impressive gain of around 60% to 70% once the price breaks above the wedge resistance.
This falling wedge pattern is typically seen at the end of downtrends or corrective phases, and it represents a potential shift in market sentiment from bearish to bullish. Traders closely watching SKYUSDT are noting the strengthening momentum as it approaches a key breakout zone. Good trading volume adds confidence to this pattern, showing that market participants are positioning early in anticipation of a potential reversal.
Investors’ growing interest in SKYUSDT reflects rising confidence in the project's long-term fundamentals and current technical strength. If the breakout confirms with sustained buying volume, this could mark the beginning of a fresh bullish leg. The current consolidation phase suggests that buyers are gradually taking control while bearish pressure continues to weaken, creating favorable conditions for a strong upward move.
Traders might find this a valuable setup for medium-term gains, especially as the falling wedge pattern nears completion and buying momentum continues to accelerate. A confirmed breakout above resistance could attract additional market participation and potentially drive the price toward its projected upside target over the coming weeks.
✅ Show your support by hitting the like button!
✅ Leave a comment below! (What is your opinion about this coin?)
Your feedback and engagement keep me inspired to share more insightful market analysis with you!
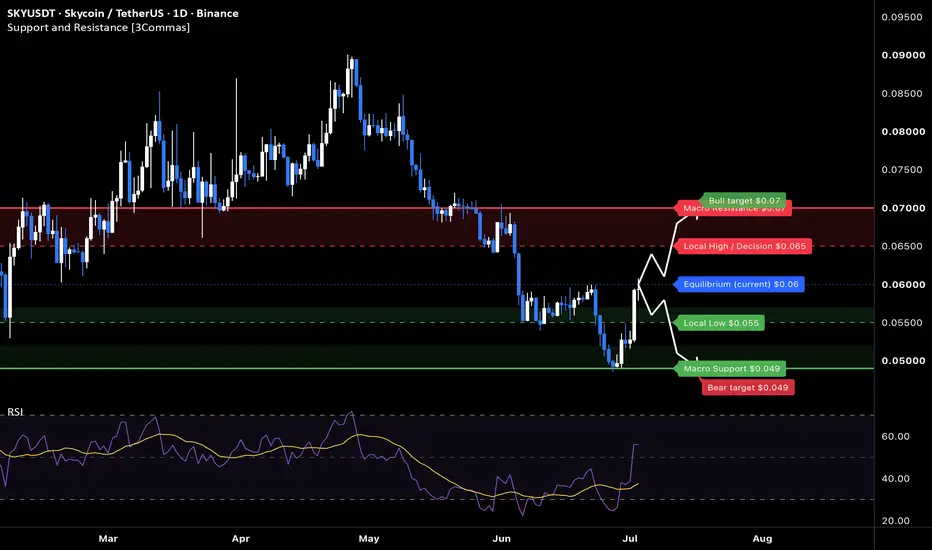
SKY: bullish spike toward $0.07The Macro Picture 🗺️
SKY spent May and June unwinding from its $0.09 structural peak, grinding down in a descending structure that finally bottomed on the $0.049 macro floor in late June. That flush stretched momentum to an extreme, and the floor held — the setup that so often sparks a sharp reversal. Price has now snapped back to $0.06 with RSI ripping off oversold toward the midline, the first decisive shift since the top. The recovery is young but forceful.
The Setup ⚙️
The Reaction: The $0.049 macro floor absorbed the selling and price has reversed hard, reclaiming $0.06 on the strongest impulse of the entire down-move. The velocity of the RSI recovery signals this is short covering plus fresh demand, not a slow drift.
The Ceiling: The first real test is the $0.065–$0.07 supply band, the zone that acted as support through the spring before the breakdown flipped it to resistance. The $0.065 decision is the level bulls need to reclaim to keep the reversal alive.
The Roadmap: Primary target sits at $0.07 — the macro resistance and the base of the old range, where the green roadmap points once $0.065 gives way. Invalidation: a sustained 1D close below $0.055 would invalidate this bullish reaction and reopen the path back toward the $0.049 macro floor.
#SKYUSDT Shows Bearish Shift After Buying Climax RejectionYello Paradisers! Are you tracking the evolving structure on #SKY (Skycoin), or are you still reacting to short-term moves while smart money continues to operate around key liquidity zones?
💎#SKYUSDT recently printed a clear Buying Climax (BC), where aggressive buy-side momentum pushed price into a liquidity grab above the previous highs. However, instead of continuation, the market quickly showed weakness, signaling that smart money may have been distributing positions into strength.
💎Following the Buying Climax, price formed a clear Change of Character (CHoCH) to the downside, confirming the first shift in momentum from bullish to bearish. This transition indicated that buyers were losing control while sellers started stepping in aggressively.
💎The market is now respecting a well-defined Bearish POI / Supply Zone (~0.083–0.085), where every rally attempt has faced rejection. This clean reaction from supply confirms that bearish pressure remains dominant and that the recent bullish expansion may have only been a liquidity-driven move.
💎Currently, price is trading near a critical Break of Structure (BoS) level around 0.077–0.078. A confirmed breakdown below this structure would strengthen the bearish outlook and likely trigger continuation toward lower liquidity zones.
💎It’s important to understand that after a Buying Climax, markets often transition into distribution or markdown phases. The failure to reclaim higher highs combined with weakening momentum suggests that sellers are gradually taking control of the structure.
💎Looking ahead, the primary Draw on Liquidity (DOL) sits within the major Demand Zone (~0.068–0.071), which aligns with the projected downside path and acts as the next significant liquidity target.
💎However, if price manages to reclaim and hold above the Bearish POI (~0.085) with strong bullish momentum, the bearish outlook would weaken and the market could attempt another expansion higher.
Discipline is key, Paradisers! Don’t get trapped chasing weak recoveries against structure. Respect the liquidity, follow the trend, and let the market confirm before reacting emotionally.
MyCryptoParadise
iFeel the success 🌴
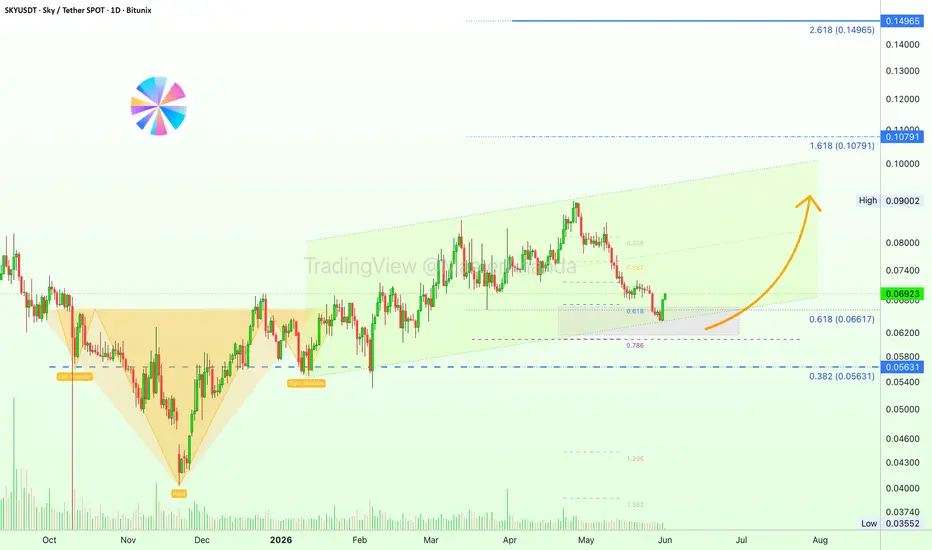
Sky Protocol: Retrace Complete & Bullish ResumptionOn this chart a retrace was expected and now it seems to be over.
SKYUSDT paused its uptrend in late April to clawback some of its growth. The dropping stopped right below 0.618 and above 0.786 Fib. retracement levels. A classic reversal zone. Coincidentally, the 0.618 Fib. extension based on the whole chart is also close by, 0.06617. Above this level, SKYUSDT can resume growing.
This a nice chart setup. Quite basic and standard.
The recent drop was preceded by months of rising prices. The next advance can also produce sustained growth. Day after day, week after week of higher prices until resistance gets challenged. The main levels can be seen mapped on the chart.
This is a strong chart setup with high probability for the appearance of a bullish continuation. A nice 100% based on a sustained uptrend.
Thank you for reading.
Namaste.
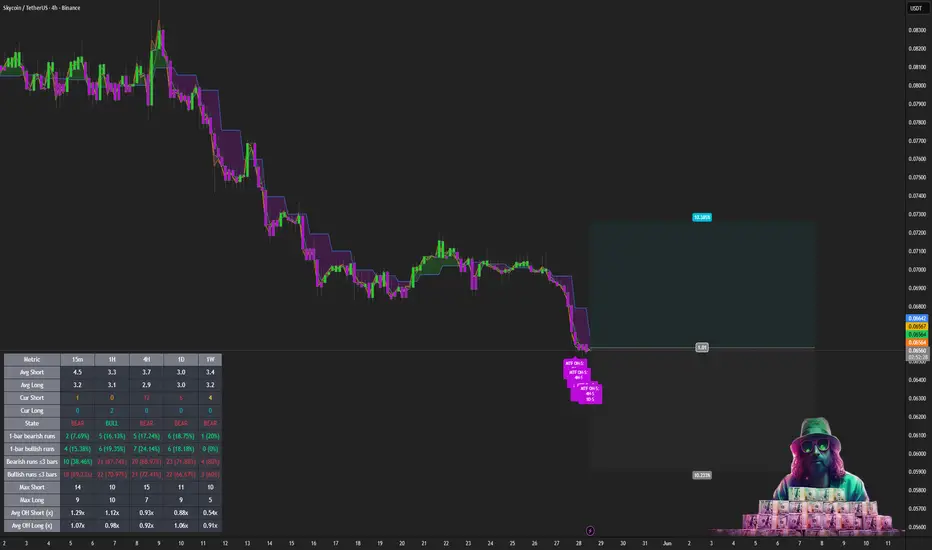
4h SKY LONG — ALMA Avg Strategy ALMA Averaging Strategy adds while ALMA phase stays SHORT and Cur Short minus Avg Short clears the entry min diff. Pyramiding: 25% per qualifying bar. Exits follow ALMA LONG plus min diff on the long leg — not the discretionary green TP lines drawn on the chart. Hard stop: 10% below working average when enabled.
ALMA board (~0.067, 27.05)
15m through 1W: SHORT on the formal tile. 4H: Cur Short 7 vs Avg Short ~3.6 — diff 3.4 bars, clears the 3-bar gate. 1D Cur Short 5 vs ~3.0. No Cur Long on the export tile — live chart already shows Cur Long 10 vs Avg Long ~2.6 while State still reads SHORT.
EMA / session grid (f5f421 Metric, ~0.07 print, 27.05)
15m Above with Cur Long 3; 1H through 1W Below. 1H Cur Short 26 vs Avg ~8.0 — extreme micro short crowding in that row. 4H Cur Short 12 vs ~9.1; 1D Cur Short 19 vs ~6.7. Dev% ramps: 4H ~+1.4%, 1D ~+6.3%, 3D ~+6.4% in the export — stretched below the slow EMA stack on the execution clocks. Live 4H table in the grab prints higher Dev (5.4% on 4H, ~10.9% on 1D) after the additional dump to ~0.065 — same “pressed below mean” read, sharper tag. Log burst same day: RSI 9 oversold; fractal low broken; new HTF bull/bear FVG — volatility around structure, not a clean trend handoff.
Footprint (4H)
At the green demand pocket (~0.0655–0.0665) the cluster print shows heavy trade at the lows with aggressive buy delta on the tails (large green delta cells vs the prior red waterfall) — absorption read, not proof of reversal. Fork: micro bids defend the shelf while 4H ALMA still wears a short-phase jacket.
VWAP / volume profile (4H)
Visible-range profile reads P-shape: HVN stacked at the 0.072–0.074 origin, thin LVN through the waterfall, fresh b-shape building at 0.0655–0.0660 — sellers already ran the vacuum; the fight is whether the low node holds. POC 0.07017 overhead: spot ~0.0655 sits ~6.6% under session fair, still outside value, not a reclaim. Bar volume anomaly: climax on the dump candle, then shrinking bodies with rising participation and positive footprint delta (~+256K / ~+292K) on the shelf — absorption attempt, not trend proof. Chart-TF support VWAP hugs the green pocket; red HTF ribbons tier above — daily ~0.0695–0.0705, weekly (widest) ~0.0715–0.072 caps relief. 4H touch stats: support FE P(≥1) ~84% (lines usually do something) but K/M br ~65% vs bounce ~35% — react, then often break. Forecast: defend support VWAP + b-node → mean reversion toward POC 0.070, then daily ribbon; lose 0.0655 through the VAL shelf → P-trap longs unwind toward ~0.063–0.064.
SMC — timeline
4H (~0.0679, 27.05): OB enter bull stack into the mid-0.068s, then MS Trend Down ~0.069 on the same session — two-way ledger into the drop.
1D (~0.0692, 26.05): daily print still inside the post-rally digestion band.
After the flush: ladder of FVG Enter Bull on 27–28.05 at ~0.0656–0.0658 — bid-side inefficiency filling into the waterfall low, aligns with ALMA adds, not a macro coronation.
Trend — 1D
Regime: tactical long inside a larger uptrend that just broke the orange channel — price testing the green higher-low rail near ~0.065. Hold that rail → mean-reversion toward the 0.068–0.072 congestion; sustained acceptance below ~0.063–0.064 re-opens the spring liquidity story. Geometry only — ALMA exits rule the script.
Derivatives — skew
Funding slightly positive; OI recovering off the late-May low; account book ~two-thirds short with L/S ratio ~0.5 — crowded short into a bounce attempt. CVD still soft on the edge; net long positioning negative in the strip — book not screaming aggressive lift yet. Contrarian fuel if price reclaims ~0.068 fast; squeeze risk if the shelf fails.
Social — attention vs sentiment
Sentiment pegged high (~75%) while social dominance and active posts spike on the last bars — loud crowd arriving late into a dump. Good for narrative pops; bad as sole thesis without price follow-through.
On-chain (1D bundle)
Active addresses and USD transaction volume show May spikes vs a quieter baseline — network woke up around the volatility window; not a widening holder base story by itself.
Positive factors
- ALMA 4H: Cur Short ~2× avg (diff 3.4 > min 3); entry gate satisfied; counter-short-add template
- EMA: 1H Cur Short 26 vs ~8 — fat short crowding; Dev% stretched on 4H/1D after dump to ~0.065
- Footprint: absorption ~0.0655–0.0665; buy delta on tails (~+256K / +292K on shelf bars)
- VP/VWAP: P-shape HVN 0.072–0.074; b-node 0.0655–0.066; POC 0.07017; support VWAP holds; weekly ribbon ~0.0715–0.072 caps pop
- SMC: FVG Enter Bull ladder 27–28.05 ~0.0656–0.0658 — lines up with ALMA Long Adds
- Derivatives: ~two-thirds of accounts short; L/S ~0.5; OI recovering off May low — squeeze fuel
- Trend 1D: price on green higher-low rail ~0.065; path toward 0.068–0.072 if rail holds
- Log: RSI 9 oversold; fractal low broken
- Backtest context: ~69% win; avg win ~+9.6% vs avg loss ~−6.5% on attached strip (not a live promise)
Negative factors
- SMC: MS Trend Down ~0.069 still fresh on 4H after bull OB stack
- Derivatives: CVD soft; net long positioning negative — no aggressive lift yet
- Trend 1D: orange channel broken — tactical bounce inside larger digestion, not macro reclaim
- Social: high sentiment + dominance spike into the dump — narrative without follow-through
- Footprint vs ALMA: micro bids at shelf while 4H ALMA phase still SHORT
- VP/VWAP: ~6.6% under POC; 4H stats K/M br ~65% on support — break bias after touch; HTF ribbons overhead
- Liquidity: thin alt — wrong bounce eats pyramids
- Risk: hard stop 10% caps nominal loss, not gap on perps
- Backtest: headline return on strip almost flat despite high win rate
#SKY Is About to Explode — Don’t Miss This…!Yello Paradisers! Are you prepared for a potential sharp move on #SKY, or are you still underestimating what’s quietly building behind the scenes? At first glance, this structure might seem like a simple and healthy pullback. But when we strip away emotions and analyse the chart objectively, a completely different narrative emerges. This is not random price action — this is a high-risk, high-opportunity zone where discipline matters far more than opinions.
💎#SKY has recently printed a classic selling climax, followed by a climactic action candle supported by ultra-high volume. This is a textbook indication of accumulation. Historically, this exact behaviour appears when smart money begins positioning ahead of a larger move. While subtle to the untrained eye, this probability carries significant weight for experienced traders.
💎#SKY swept the Selling Climax with an Automatic Rally structure and then aggressively breaking above the Automatic Rally trend-line with strong momentum. This is a key probability. It suggests weak hands are being forced out of the market while stronger participants continue accumulating positions with confidence. The most important level to monitor now is the high of the Climactic Action candle. A confirmed breakout above this region, supported by strong momentum and volume, could quickly open the path toward the 9460 a major resistance zone, which remains the next major structural target on the chart.
💎#SKY continues to respect its Order Block zone and Descending support trend-line during the recent retracement move, we have also observed clear RSI divergence, adding further confluence to the bullish scenario. As long as price holds momentum within the demand zone, the structure remains constructive, with 8280 acting as the first key resistance to monitor closely.
💎If #SKY fails to hold bullish momentum and a momentum candle closes below 6400, the current bullish probability becomes invalid. In that case, we could see further downside pressure.
That is why Paradisers, we are playing it safe right now. If you want to be consistently profitable, you need to be extremely patient and always wait only for the best, highest probability trading opportunities only on confirmations.
MyCryptoParadise
iFeel the success🌴
Sky Protocol · The Golden Era of Crypto Starts Now!An uptrend started from a low in November 2025. The bottom came-up as the inverted head and shoulders (iH&S) pattern, there is room for additional growth.
The ascending channel and volume profile show that more is possible on this trading pair—SKYUSDT.
"SKY is the native governance token of Sky Protocol, a decentralized finance ecosystem (formeraly MakerDAO) building a global savings and capital allocation network which powers the Sky Savings Rate and the leading yield-generating stablecoin, sUSDS. SKY holders can stake their SKY to participate in Protocol governance and receive rewards from protocol profits through programmatic buybacks and distributions."
The golden era of the Cryptocurrency market is only now getting started, it is still extremely early when it comes to everything Crypto, think about it.
Legislation only now is being drafted in relation to this new technology.
How old is the stock market? How long the big stocks have been rising for, decades? Some companies have been in a bull market for decades. Most of the Cryptocurrencies are not even five years old.
This is a new market. New is great. New is fresh. New offers endless opportunities. The Golden Era of Crypto is yet to happen; we are only getting started.
A new financial market is not something that matures in a matter of days, it takes decades. Bitcoin is less than 20 years old. There is plenty of time to grow.
Namaste.
SKY LONG — VWAP Swing Strat | SCORE 26ALMA board
15m–1D SHORT on the tile; 4H Cur Short 10 vs Avg Short ~3.5 — diff ~6.5 bars (~2.9× average short run). 3D LONG with Cur Long 2; 1W LONG with Cur Long 3 — slow grid already long while intraday through daily stay short. Same recipe as other VWAP-swing long notes: stretched 4H short persistence inside a higher-TF bid.
EMA / session grid
15m / 1H / 4H Below; 1H Cur Short 24 vs Avg Short ~5.8 — extreme micro short crowding. 1D Above with Cur Long 5; 3D Above with Cur Long 25 vs Avg Long ~3.5 — heavy slow-grid long persistence. 1W Below with Cur Short 36 — macro short-grind fork vs the 3D long book. 3D Dev% ~−6.1 — deep discount to the slow EMA while State stays Above; 1D Dev% mildly negative — local reset, not a full mean snap yet.
12H — VWAP swing
Recent Touch VWAP Low language ~0.074 zone; spot lifted toward ~0.076+ with fresh long-side arrow on the capture — skew is buy-the-lower-band within a still-rising anchored VWAP structure. Forecast: while the slope from the swing-low anchor holds, the path of least resistance retests prior Touch VWAP High pockets ~0.080–0.084; lose the April absorption lows (~0.071–0.073 cluster) and the swing thesis re-rates toward the spring liquidity shelf.
SMC — current and recent
4H (~0.07583, 19.04 04:00): dense bid stack ~0.071–0.075 vs local sell-response ~0.077–0.078; same-day tape mixes raid / enter bull language — liquidity ping-pong, not a clean breakout.
1D (~0.07622, 18.04): triple FVG cluster at the print — pivot skew; overhead PH / FVG ladder toward ~0.080–0.085; invalidation sub ~0.069–0.071 if the bull FVG floor fails.
1W (~0.07294, 06.04): higher-TF context still digesting the post-blow-off base — trade is a tactical long inside that regime until weekly structure proves otherwise.
Trend — 1D (geometry)
Scenario: hold the post-March higher-low fan / flag exit; March volume spike ~0.070 treated as absorption — if price revisits and loses that character, bias flips. Upside: flag resolution argues expansion toward ~0.094–0.100 zone on momentum continuation (geometry only — VWAP exits still rule the strategy).
On-chain (1D, sparse panes)
Early-April spike in new funded + active addresses then cooldown — onboarding burst into digestion; forecast: volatility can return when the quiet period breaks; no whale/TVL panes in bundle — do not over-read missing data.
Social — regime shift
April step-change: dominance and interactions lift from near-zero baseline; contributors/posts hold a plateau — attention is real, not a one-hour meme. Sentiment ~73% with mid Galaxy / AltRank — crowd bullish but not parabolic; skew is engagement without a guaranteed follow-through candle.
Backtest honesty (VWAP Swing Strat on attached SKY panel, Aug 2025 – Apr 2026)
About +14.0% net with profit factor ~3.31 on only 19 trades — small sample, pretty equity curve. Win rate ~68%; avg win ~5.9% vs avg loss ~−3.9% — positive expectancy on averages. Max equity drawdown ~13% headline; intrabar drawdown ~12.4% vs ~4.6% close-to-close — path wick risk inside trades. One largest loser ~54% of gross loss — tail dependence; book is not “smooth” under stress despite the headline PF. Average run-up phase ~61d vs drawdown phase ~51d — swing cadence, not scalper churn.
Bull case
4H ALMA short run ~2.9× average; 1H EMA short crowding; 3D Cur Long 25 with 3D Dev ~−6% — rubber-band long fuel into VWAP-low touch. SMC bid density under spot; social April engagement step.
Bear case
1W Below with Cur Short 36 — macro grind can cap rips. 4H overhead ~0.077–0.078 rejection language; hard stop off — a failed swing leaves manual risk. Thin trade count in backtest — edge may not survive regime change.
#SKY#SKY is currently consolidating after breaking out of a falling wedge pattern 🚀. The falling wedge suggests a potential trend reversal 🔄 with increased buying pressure. Bulls are targeting the 0.07650 resistance level for a continuation of the upward move 🎯.
Risk management is key 🔑 when trading breakouts; always set stop losses.
#SKY #crypto #trading #altcoin
Skycoin: hidden gem or fading star? key levels for todaySkycoin. Still alive and grinding or just another ghost chart? While majors are stealing the headlines, this small cap has been quietly consolidating as liquidity slowly comes back into alts, according to industry sources. Lately, sentiment around older infrastructure projects has improved and you can see it in these little pops on forgotten pairs.
On the 4H chart, price is bouncing out of the green demand zone around 0.070 with RSI pushing up from mid levels, showing fresh buyers stepping in. I’m leaning bullish as long as we hold above that demand, looking for a drift back into the red supply band near 0.078 where the last big wick got slapped down. Volume is still modest, so any sudden spike could fuel a quick face-ripper move instead of a slow grind.
My base plan: accumulate only on dips into 0.071‑0.072 and trail it toward 0.078‑0.080, where I’ll look to de‑risk. If 0.070 gives way on a 4H close, I treat it as a failed setup and expect a slide back to the lower green box around 0.066. I might be wrong, but for now this looks like one of those quiet charts that move just when everyone stops watching. ✅
#SKY #SKY is potentially breaking out of a falling wedge pattern 🚀, showing signs of bullish momentum. This formation suggests a possible trend reversal, and traders might look for confirmation through increased volume. The upside target is around 0.09200 🎯 if the breakout is sustained.
#SKY Patience is key; wait for confirmation before jumping into a trade 🧘.
#crypto #trading #altcoin
Skycoin: ready for a comeback? key levels and targets aheadSkycoin. Ready for round two on this forgotten alt, or was that pump the whole story? While majors chill after the latest BTC move, according to market sources traders are rotating into old-school small caps again, and Skycoin just had a vertical spike followed by a sharp flush. Price is still holding above the early March base, so the dump looks more like a clean-up than a full rug… so far.
On the 4H chart, price is sitting right on the first green demand zone around 0.07 after a big liquidation candle. Volume climaxed on the drop and is fading, while RSI bounced from oversold and is curling back toward the midline. That combo screams potential bounce to me, with the nearest liquidity magnets around 0.075 - 0.08.
My base plan: I like longs only while we hold this 0.07 box, hunting wicks into 0.07 - 0.068 with bullish reaction and targeting 0.075 first, then 0.08. If we get a 4H close below that lower green zone, I flip bias and look for a deeper sweep into 0.065 - 0.062 instead. I might be wrong, but I’m not buying the narrative that this move is dead just yet. ✅ Long bias above 0.07, ⚠️ trend flips if support cracks.
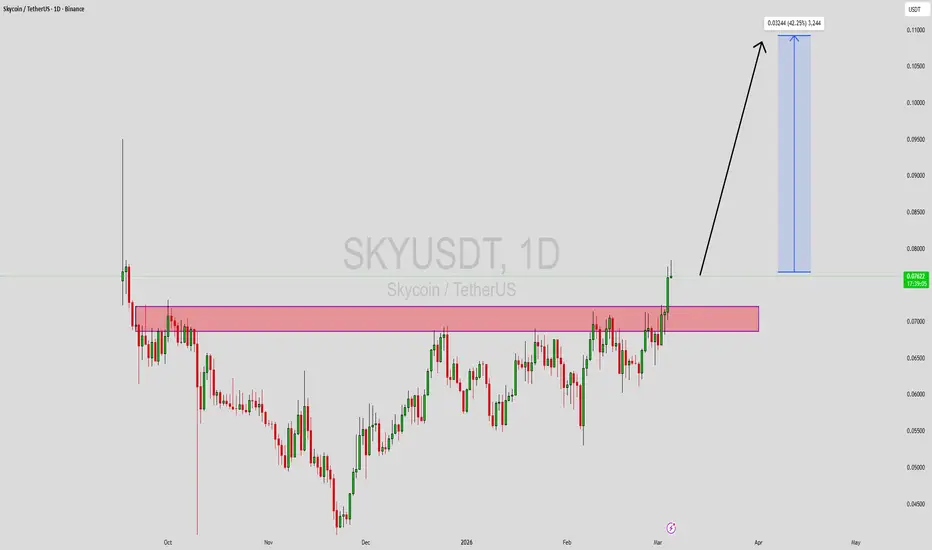
SKYUSDT Forming Bullish MomentumSKYUSDT is forming a clear bullish momentum pattern, a classic bullish reversal signal that often indicates an upcoming breakout. The price has been consolidating within a narrowing range, suggesting that selling pressure is weakening while buyers are beginning to regain control. With consistent volume confirming accumulation at lower levels, the setup hints at a potential bullish breakout soon. The projected move could lead to an impressive gain of around 30% to 40% once the price breaks above the wedge resistance.
This bullish momentum pattern is typically seen at the end of downtrends or corrective phases, and it represents a potential shift in market sentiment from bearish to bullish. Traders closely watching SKYUSDT are noting the strengthening momentum as it nears a breakout zone. The good trading volume adds confidence to this pattern, showing that market participants are positioning early in anticipation of a reversal.
Investors’ growing interest in SKYUSDT reflects rising confidence in the project’s long-term fundamentals and current technical strength. If the breakout confirms with sustained volume, this could mark the start of a fresh bullish leg. Traders might find this a valuable setup for medium-term gains, especially as the pattern completes and buying momentum accelerates.
✅ Show your support by hitting the like button and
✅ Leaving a comment below! (What is your opinion about this Coin?)
Your feedback and engagement keep me inspired to share more insightful market analysis with you!
TradeCityPro | SKYUSDT The Ideal Coin for Trading 👋 Welcome to TradeCity Pro!
Let's dive into the analysis of SKY, a coin that has been experiencing significant volume relative to its market cap and has seen logical and reasonable money inflows recently.
Higher Timeframe Analysis
On higher timeframes, SKY is currently consolidating just below a crucial resistance level at $0.07043, which is our daily resistance. A breakout above this level could lead to strong upward movement and trigger a more substantial bullish trend.
As long as the price stays above $0.05556, a breakout above $0.07043 would present an attractive entry point for spot positions, with a stop loss set just below $0.05556.
4-Hour Timeframe Analysis
On the 4-hour chart, SKY is stuck in a trading range between $0.06209 and $0.07043, where price has been oscillating.
Long Setup
A trendline from lower highs is forming, signaling a continuation pattern.
Once this trendline breaks, it could signal a long position opportunity, and we could follow the upward movement with a stop loss just below the trendline.
Short Setup
If we see a rejection at the trendline and a breakdown of the support at $0.06209, it would signal an opportunity for a short position.
In this case, we could target the $0.05561 level as the downside objective for our short trades.
📝 Final Thoughts
Stay calm, trade wisely, and let's capture the market's best opportunities!
This analysis reflects our opinions and is not financial advice.
Share your thoughts in the comments, and don’t forget to share this analysis with your friends! ❤️
Skycoin: ready for a second leg? key levels to watch aheadSkycoin. Is this old alt warming up for a second leg or was that spike the whole show? Recently the market has been rotating into smaller caps again, and Skycoin woke up with a sharp impulse up while most traders were still staring at majors. Now price is chilling right under a thick supply zone, so the next move from here can be juicy.
On the 4H chart, price is ranging just below resistance around 0.067–0.069 after a strong vertical pump. RSI cooled from overbought back to the mid‑50s without any real dump, which looks more like a pause than distribution. VPVR shows a chunky support node in the 0.063–0.065 area, so I’m leaning to the long side as long as that block holds. I might be wrong, but this looks like a classic consolidation before a breakout.
My base case ✅ a shallow pullback into 0.064–0.065 or a clean 4H close above 0.069 opens the road toward 0.072–0.075. If buyers fail and we get a firm close below 0.061, the bulls are trapped and I’d expect a slide toward 0.058 ⚠️. I’m stalking a long from the green zone and will reassess if that support gets sliced. Not financial advice, just my game plan.
SKYUSDT 1D#SKY is currently testing the resistance zone on the daily chart. Wait for a clean breakout before entering. If a breakout occurs, the potential upside targets are:
🎯 $0.07427
🎯 $0.08007
🎯 $0.08744
🎯 $0.09129
🎯 $0.09681
If price fails to break above the resistance zone, there is a possibility of forming a triple top and revisiting the following support levels:
$0.06333
$0.05937
$0.05573
⚠️ Always apply tight stop-losses and maintain strict risk management.
FireHoseReel | SKY Is Gaining Strong Momentum🔥 Welcome to FireHoseReel !
Let’s check what SKY is setting up right now.
👀 SKY – 4H Overview
SKY has managed to recover its recent price drop very well over the last few 4H candles and is now approaching a major breakout resistance.
If this bullish leg continues, SKY could experience further upside expansion.
📊 SKY Volume Analysis
Volume has increased clearly during the recent rise.
If the upcoming pullback is accompanied by decreasing volume, followed by a renewed expansion in buy volume and an upside move, this would serve as a strong confirmation of trend continuation.
✍️ SKY Trading Scenarios
🟢 Long Scenario
A pullback toward the $0.05582 resistance, followed by lower corrective volume, and then a strong volume expansion after confirming resistance-as-support, could activate our multi-timeframe long trigger.
🔴 Short Scenario
A break below the key support at $0.04893, accompanied by heavy selling pressure, could provide a valid short setup for SKY.
❤️ Risk Management & Emotional Discipline
Crypto trading is highly risky. Without proper risk management and emotional control, trading is no different from gambling.
Logic must always come before emotions. Learn to manage your trades, and enjoy the process of trading with control and discipline.
SKY/USDT – Symmetrical Triangle Breakout Suggests Strong Upside
Date: June 11, 2025
SKY/USDT has successfully broken out of a long-term symmetrical triangle pattern, signaling a potential bullish continuation. The breakout is backed by increasing volume and rising RSI, pointing to growing momentum.
📊 Technical Overview:
Current Price: $0.08954
Breakout Zone: ~$0.08500
Key Support Levels:
$0.06250 (previous consolidation base)
$0.04152 (major demand zone)
Resistance/Target Zones:
$0.14880 (intermediate target)
$0.15840 (historical resistance)
$0.17102 (macro resistance)
📈 Indicators:
RSI: 71.16 – entering overbought territory, confirming bullish momentum.
Moving Averages: All key EMAs (4, 50, 100, 200) are aligned to the upside, showing a clear trend reversal and strong price structure.
📉 Volume:
Volume has begun to increase significantly at the breakout point, adding validity to the move.
🔍 Chart Structure:
Price has broken above a converging resistance trendline after months of consolidation.
The ascending triangle base suggests a sustained accumulation phase.
A classic bullish breakout setup with well-defined measured move targets.
🎯 Upside Projections:
Short-Term Target: $0.14880
Mid-Term Target: $0.15840
Extended Target: $0.17102
📉 Invalidation:
A drop back below $0.085 and particularly below $0.06250 would invalidate this bullish breakout and indicate a false breakout.
Good trading!!