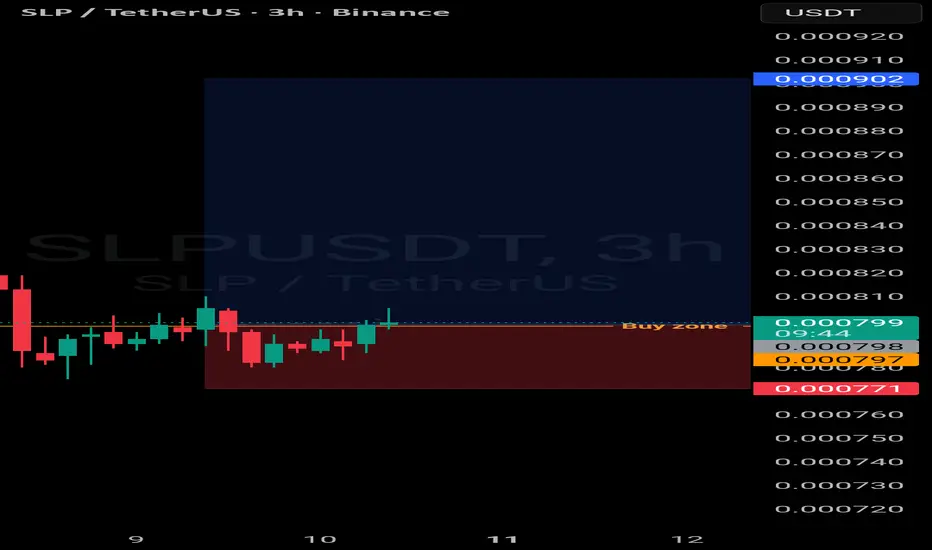
SLP/USDT | Multiple Bullish Divergences | Accumulation PhaseSLP/USDT | Multi-Confirmation Bullish Divergence & Potential Trend Reversal
ibb.co
Description
SLP/USDT – Weekly Chart
***
SLP remains in a long-term downtrend, but the current structure is showing several signs of bearish momentum exhaustion and potential accumulation.
The most important sig
#SLPUSDT Ready to go higher#SLP
The price is moving within a descending channel on the 1-hour timeframe and has reached the lower boundary. It is now poised for a bounce and is expected to retest this boundary.
The Relative Strength Index (RSI) indicates a downward trend, which is likely to continue given the overbought con
SLP / SLPUSDT Long Setup | Breaker Block ReclaimMARKET ANALYSIS
SLP is currently reacting from a key technical area highlighted on the chart.
As long as the protected support zone remains intact, the bullish market structure remains valid and higher liquidity targets may continue to attract price action.
A breakdown below the invalidation l
SLP / SLPUSDT Bullish Setup | Futures Trade IdeaMARKET ANALYSIS
SLP is currently reacting from a key technical area highlighted on the chart.
As long as the protected support zone remains intact, the bullish market structure remains valid and higher liquidity targets may continue to attract price action.
A breakdown below the invalidation l
SLP volume is back ?SLP appears to have found a new low, with volume returning and a short-term pump occurring on massive volume near the support zone. If this new support level holds strong, a heavy pump to the upside is expected in the near future.
Learn this : When price reaches a new low and volume spikes during
SLP is near major weekly LowSLPUSDT is currently ranging and consolidating near the key daily and weekly support zone of 0.0004 to 0.0005. This extended period of low volatility near strong support often precedes a significant move. A bullish reversal from this zone could lead to a minimum 2x to 3x gain.
Learn this: Low-risk
#SLPUSDT Ready to go higher#SLP
The price is moving within a descending channel on the hourly timeframe. It has reached the lower boundary and is trending towards a bounce. A retest of this boundary is expected.
The Relative Strength Index (RSI) indicates a downward trend, and this trend is likely to continue due to the ove
SLP Pump WarningSLP is trading near its all-time low (ATL) once again. Over the previous month, multiple daily candles showed massive pumps to the upside followed by rejections and declines. However, the volume of these green candles was significantly higher than the volume of the subsequent bearish candles. This
#SLP/USDT Ready to go higher#SLP
The price is moving within a descending channel on the 1-hour timeframe and has reached the lower boundary. It is now poised for a bounce and is expected to retest this boundary.
The Relative Strength Index (RSI) indicates a downward trend, which is likely to continue given the overbought con
See all ideas
Summarizing what the indicators are suggesting.
Oscillators
Neutral
SellBuy
Strong sellStrong buy
Strong sellSellNeutralBuyStrong buy
Oscillators
Neutral
SellBuy
Strong sellStrong buy
Strong sellSellNeutralBuyStrong buy
Summary
Neutral
SellBuy
Strong sellStrong buy
Strong sellSellNeutralBuyStrong buy
Summary
Neutral
SellBuy
Strong sellStrong buy
Strong sellSellNeutralBuyStrong buy
Summary
Neutral
SellBuy
Strong sellStrong buy
Strong sellSellNeutralBuyStrong buy
Moving Averages
Neutral
SellBuy
Strong sellStrong buy
Strong sellSellNeutralBuyStrong buy
Moving Averages
Neutral
SellBuy
Strong sellStrong buy
Strong sellSellNeutralBuyStrong buy
Displays a symbol's price movements over previous years to identify recurring trends.