SLP/USDT | Multiple Bullish Divergences | Accumulation PhaseSLP/USDT | Multi-Confirmation Bullish Divergence & Potential Trend Reversal
ibb.co
Description
SLP/USDT – Weekly Chart
***
SLP remains in a long-term downtrend, but the current structure is showing several signs of bearish momentum exhaustion and potential accumulation.
The most important signal is the presence of multiple bullish divergences across price, volume and momentum indicators:
• OBV : While price continues to form lower lows, OBV has developed a clear series of higher lows. This indicates that volume is not confirming the ongoing downside and suggests increasing underlying buying pressure.
• AO : The Awesome Oscillator is also forming higher lows while price continues to decline, creating a Regular Bullish Divergence and showing that downside momentum is gradually weakening.
• MFI : Money Flow Index is showing a higher-low structure against lower lows in price, suggesting that capital flow is improving despite the weakness in price.
• RSI : Momentum is also showing signs of relative strength compared with the price structure, adding another layer of confirmation to the potential reversal scenario.
From a price-action perspective, SLP is still trading inside a broad descending structure. The key trigger is a breakout of the descending trendline / resistance structure shown on the chart.
A confirmed breakout and weekly close above the relevant resistance zone would significantly strengthen the bullish reversal setup.
Key Levels
Breakout / Confirmation Zone:
A sustained breakout above the descending structure and the 0.00125–0.00150 resistance area would be the first major confirmation.
TP1 / First Resistance:
0.001250 – 0.001505
TP2:
0.003226 – 0.004218
TP3 / Major Long-Term Target:
0.146013 – 0.179424
The higher targets represent a long-term bullish scenario, not an expectation of an immediate move.
Bullish Scenario
Price holds the current support structure → breaks the descending trendline → confirms the breakout with volume → reclaims the 0.00125–0.00150 area → continuation toward the next resistance zones.
The strongest confirmation would come from price breakout + increasing volume + continued strength in OBV/MFI + positive AO momentum.
Invalidation
A decisive breakdown below the current support structure, accompanied by renewed weakness in OBV, MFI and AO, would weaken or invalidate the bullish reversal thesis.
Conclusion:
The chart is not confirming a reversal yet; however, the combination of Regular Bullish Divergence + improving volume/money-flow structure + weakening bearish momentum + descending trendline breakout setup makes SLP an interesting asset to monitor for a potential long-term reversal.
***
Not financial advice. DYOR.
In-depth trading ideas
#SLPUSDT Ready to go higher#SLP
The price is moving within a descending channel on the 1-hour timeframe and has reached the lower boundary. It is now poised for a bounce and is expected to retest this boundary.
The Relative Strength Index (RSI) indicates a downward trend, which is likely to continue given the overbought conditions.
There is a key support zone in green at 0.000452. The price has bounced off this zone several times, making it a strong support level.
The price is trending towards the 100-period moving average, which we are approaching. This trend supports an upward move.
Entry Price: 0.000520
Target 1: 0.000536
Target 2: 0.000554
Target 3: 0.000577
Stop Loss: At the resistance zone in green
Remember this simple rule: Money management.
Any questions? Please leave a comment.
Thank you.
SLP / SLPUSDT Long Setup | Breaker Block ReclaimMARKET ANALYSIS
SLP is currently reacting from a key technical area highlighted on the chart.
As long as the protected support zone remains intact, the bullish market structure remains valid and higher liquidity targets may continue to attract price action.
A breakdown below the invalidation level would weaken the current bullish scenario and require a reassessment of market conditions.
📍 Entry, Stop Loss and Take Profit levels are marked directly on the chart.
━━━━━━━━━━━━━━
⚠️ DISCLAIMER
This publication is provided solely for educational and market observation purposes.
Nothing contained in this analysis should be considered financial advice, investment advice, or a recommendation to buy or sell any financial instrument.
All trading and investment decisions remain solely the responsibility of the individual trader.
Always conduct your own research and apply proper risk management before entering any position.
━━━━━━━━━━━━━━
🎯 PARALOG
▪️Crypto Market Analysis
▪️BTC Futures Signals
▪️Bitcoin & Altcoin Market Analysis
Precision • Momentum • Timing
━━━━━━━━━━━━━━
Exchange: #MEXC Futures
#bitcoin #btc #crypto #futures #technicalanalysis
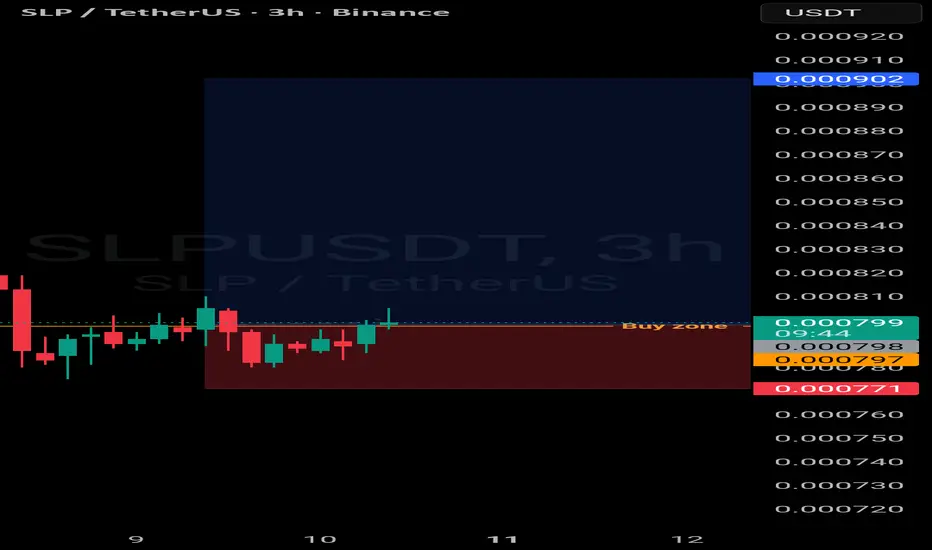
SLP / SLPUSDT Bullish Setup | Futures Trade IdeaMARKET ANALYSIS
SLP is currently reacting from a key technical area highlighted on the chart.
As long as the protected support zone remains intact, the bullish market structure remains valid and higher liquidity targets may continue to attract price action.
A breakdown below the invalidation level would weaken the current bullish scenario and require a reassessment of market conditions.
📍 Entry, Stop Loss and Take Profit levels are marked directly on the chart.
━━━━━━━━━━━━━━
⚠️ DISCLAIMER
This publication is provided solely for educational and market observation purposes.
Nothing contained in this analysis should be considered financial advice, investment advice, or a recommendation to buy or sell any financial instrument.
All trading and investment decisions remain solely the responsibility of the individual trader.
Always conduct your own research and apply proper risk management before entering any position.
━━━━━━━━━━━━━━
🎯 PARALOG
▪️Crypto Market Analysis
▪️BTC Futures Signals
▪️Bitcoin & Altcoin Market Analysis
Precision • Momentum • Timing
━━━━━━━━━━━━━━
Exchange: #MEXC Futures
#bitcoin #btc #crypto #futures #technicalanalysis
SLP volume is back ?SLP appears to have found a new low, with volume returning and a short-term pump occurring on massive volume near the support zone. If this new support level holds strong, a heavy pump to the upside is expected in the near future.
Learn this : When price reaches a new low and volume spikes during a bounce, it often indicates that buyers are stepping in aggressively. High volume on a reversal attempt is a strong signal that institutional or smart money is accumulating at these levels. This is often the first sign that a bottom may be forming.
The key now is whether this new support level holds. If price successfully defends this area and continues to show strength, a heavy pump to the upside becomes highly probable.
The massive volume on the recent bounce adds credibility to the move. It suggests that this is not just a dead cat bounce but a genuine attempt to reverse the trend.
Key levels to monitor are the new support zone as the foundation for the bullish case, the recent high as the first resistance, and the target zone beyond for potential gains. A confirmed breakout above the recent pump high would strengthen the bullish outlook.
SLP is near major weekly LowSLPUSDT is currently ranging and consolidating near the key daily and weekly support zone of 0.0004 to 0.0005. This extended period of low volatility near strong support often precedes a significant move. A bullish reversal from this zone could lead to a minimum 2x to 3x gain.
Learn this: Low-risk entries are often found at strong support levels where price has been ranging for a while. The stop-loss is clearly defined below the range, and the reward potential is multiple times the risk. That is what makes this type of setup attractive.
Key levels to monitor:
Support is the 0.0004–0.00055 zone. Resistance is the recent range high. A confirmed breakout above that range high, especially with volume, would confirm the start of the next bullish leg. Until then, patience is key. Wait for the breakout before adding to positions.
#SLPUSDT Ready to go higher#SLP
The price is moving within a descending channel on the hourly timeframe. It has reached the lower boundary and is trending towards a bounce. A retest of this boundary is expected.
The Relative Strength Index (RSI) indicates a downward trend, and this trend is likely to continue due to the overbought condition.
A key support zone has been identified in green at 0.000591. The price has bounced off this zone several times, making it a strong support level.
The price is trending towards the 100-period moving average, which we are approaching. This trend supports an upward move.
Entry Price: 0.000615
Target 1: 0.000627
Target 2: 0.000639
Target 3: 0.000656
You can close at the second target or wait for the third target to be reached. The choice is yours.
Stop Loss: At the resistance zone in green.
Remember this simple rule: Money management.
Any questions? Please leave a comment.
Thank you.
SLP Pump WarningSLP is trading near its all-time low (ATL) once again. Over the previous month, multiple daily candles showed massive pumps to the upside followed by rejections and declines. However, the volume of these green candles was significantly higher than the volume of the subsequent bearish candles. This divergence suggests that selling pressure is weak and that soon one of these pumps will continue, leading to a sustained move higher. A minimum 5x to 10x appreciation is expected from current levels.
SLP has returned to its all-time low (ATL) support zone. This level has been tested multiple times over recent weeks.
The price action shows a clear and repeating pattern. Each day with a strong pump to the upside is characterized by very high trading volume. Following each pump, the price is rejected and falls. However, the volume during these bearish rejections is significantly lower than the volume of the preceding green candles.
Educational Note: This volume divergence is a key technical signal. When an asset rises on high volume but falls on low volume, it indicates that buying pressure is stronger than selling pressure. The low-volume declines suggest that sellers are not aggressive and that the market is simply taking profits rather than distributing the asset. This behavior is often seen during accumulation phases near major support levels.
#SLP/USDT Ready to go higher#SLP
The price is moving within a descending channel on the 1-hour timeframe and has reached the lower boundary. It is now poised for a bounce and is expected to retest this boundary.
The Relative Strength Index (RSI) indicates a downward trend, which is likely to continue given the overbought conditions.
There is a key support zone (in green) at 0.000711. The price has bounced off this zone several times, making it a strong support level.
The price is trending towards the 100-period moving average, which we are approaching. This trend supports an upward move.
Entry Price: 0.000765
First Target: 0.000779
Second Target: 0.000797
Third Target: 0.000818
You can stop at the first and second targets and close the price, or continue towards the third target. Stop Loss: At the resistance zone (in green).
Remember this simple rule: Money Management.
Any questions? Please leave a comment.
Thank you.
SLPUSDT Forming Bullish MomentumSLPUSDT is forming a clear bullish momentum pattern, a classic bullish wave signal that often indicates an upcoming breakout. The price has been consolidating within a narrowing range, suggesting that selling pressure is weakening while buyers are beginning to regain control. With consistent volume confirming accumulation at lower levels, the setup hints at a potential bullish breakout soon. The projected move could lead to an impressive gain of around 90% to 100% once the price breaks above the wedge resistance.
This bullish momentum pattern is typically seen at the end of downtrends or corrective phases, and it represents a potential shift in market sentiment from bearish to bullish. Traders closely watching SLPUSDT are noting the strengthening momentum as it nears a breakout zone. The good trading volume adds confidence to this pattern, showing that market participants are positioning early in anticipation of a reversal.
Investors’ growing interest in SLPUSDT reflects rising confidence in the project’s long-term fundamentals and current technical strength. If the breakout confirms with sustained volume, this could mark the start of a fresh bullish leg. Traders might find this a valuable setup for medium-term gains, especially as the pattern completes and buying momentum accelerates.
✅ Show your support by hitting the like button and
✅ Leaving a comment below! (What is your opinion about this Coin?)
Your feedback and engagement keep me inspired to share more insightful market analysis with you!
SLP ON WAY TO NEW TREND INCREASEDepending on the recent trend and structure, SLP looks to be entering an important confirmation phase, where accumulation starts turning into expansion. This shift gives the token a solid chance to break out if momentum continues building. There is huge chance for 44%+ increase.
At this moment the most of tokens are into breakdowntrend, where the chance is 5% of tokens will increase even with the red trend.
#SLPUSDT Ready to go higher#SLP
The price is moving within a descending channel on the 1-hour timeframe and has reached the lower boundary. It is now poised for a bounce and is expected to retest this boundary.
The Relative Strength Index (RSI) indicates a downward trend, which is likely to continue given the overbought conditions.
There is a key support zone (in green) at 0.000658. The price has bounced off this zone several times, making it a strong support level.
The price is trending towards the 100-period moving average, which we are approaching. This trend supports an upward move.
Entry Price: 0.000710
First Target: 0.000719
Second Target: 0.000736
Third Target: 0.000755
You can stop at the first and second targets and close below them, or continue towards the third target. Stop Loss: At the resistance zone (in green).
Remember this simple rule: Money Management.
Any questions? Please leave a comment.
Thank you.
SLP first 4x is cooking now SLP has now gained enough strength to see a huge pump after years of constant dumping. The token kept hitting new ATL (All Time Low) every time, but I think that is enough. Soon this token can get its place back in the top 100 tokens. That means at least 5x from here.
Smooth Love Potion has been one of the hardest hit tokens in the crypto market. For years, the price dumped constantly and made new all time lows repeatedly. Most traders gave up on it.
But now, the chart is showing signs of a clear reversal. Volume is increasing. The price is holding above previous lows. The selling pressure seems exhausted.
I believe the worst is over for SLP. The token has enough strength now to start a huge pump. The first major target is reclaiming a spot in the top 100 cryptocurrencies by market cap. From the current price, that means at least a 5x increase.
✍🏼Author's word: Like & comment(your thoughts) if you found it helpful.🩷
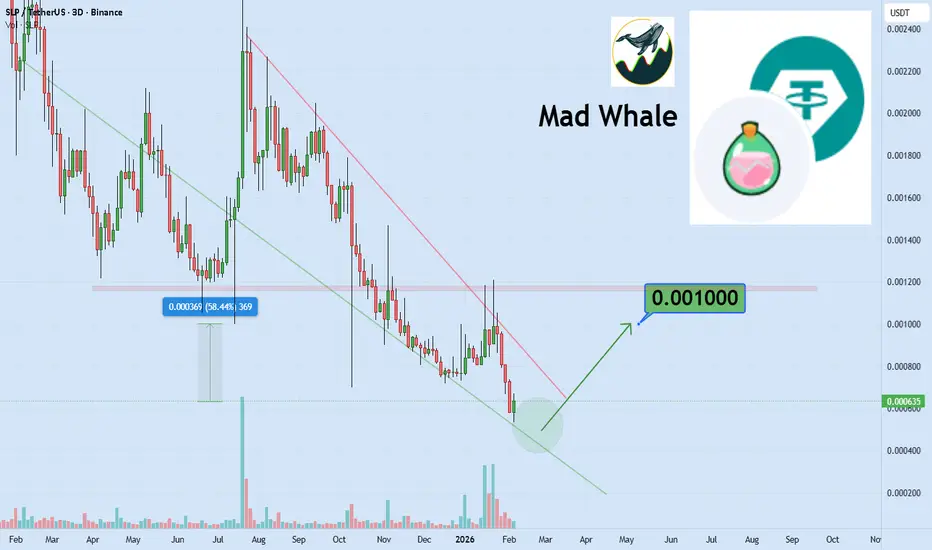
SLP, breakout scenario suggests 42%t rise to 0.0010Hi,
Smooth Love Potion looks ready for a strong move in the coming weeks. The rising trading volume and the new bullish trend suggest a possible 42% gain, with a price target of around $0.0010 .
Need a little love!
We pour love into every post your support keeps us inspired! Don’t be shy, we’d love to hear from you on comments. Big thanks
SLP the leader of next ALTseasonSmooth Love Potion (SLP) is currently trading near its All-Time Low (ATL) zone, and a notable technical development is taking place. Trading volume has increased significantly at these depressed price levels. In technical analysis, rising volume near a major support or ATL zone often indicates accumulation, as larger players begin to absorb supply.
This volume surge is particularly meaningful because it follows a period of extended downtrend and low interest. During the previous month alone, SLP has already recorded a gain of approximately +30% – a sign that buying pressure is gradually returning.
Given the combination of ATL proximity, rising volume, and recent positive price performance, there are strong indications that something significant is brewing. It appears that a larger move is being prepared. Once the accumulation phase completes, a move of 2x to 3x from current levels could materialize sooner than expected.
✍🏼Author's word: Like & comment(your thoughts) if you found it helpful.🩷
Smooth Love Potion (SLP) · Early vs late technical analysis &...Sometimes it is a bit hard to show the bullish potential on a chart because it is too early, I tend to show you charts before the bullish breakout and this obviously can result in the chart looking rather weak.
The reason for sharing the charts before the bullish move starts is to give you the opportunity to buy when prices are low.
There are several purposes for this sharing:
1) Learning technical analysis, you and me both.
2) Growing through the exchange. Mentally, emotionally and spiritually.
3) A trading opportunity. For investment purposes.
4) Also, to support the market in general. Many projects only I share, they don't get much exposure as the market is so big.
The charts trading at bottom prices might look awesome to me, but someone who isn't 24-7 a technical analyst can be filled with doubt easily at best. It requires lots of trust to take action on something you are not fully certain of. With time, as the market moves, you can see that I am right—easy follow and trust.
After years of reading, you know how it works and you can go straight to the opportunity and the exchange. If you are new... Thanks a lot for your continued support.
This introduction is to say that Smooth Love Potion (SLPUSDT) is already moving, here there is no weakness as those other trading pairs I keep showing you everyday. The bullish breakout is already happening, volume is really high and the RSI is moving toward super-strong. And this points to additional growth.
When I see charts like this one, it is good but I tend to ignore them in favor of those "before the action."
I hope you understand why I do it in this way.
I truly appreciate your time and energy... I know you are reading and taking care of business behind the scenes. All this is done for you, and it will be done for as long as you need.
Today, I am feeling a nice wave of bliss.
Namaste.
SLPUSDT the massive pump here will shock youSmooth Love Potion (SLP) is currently trading near its All-Time Low (ATL) zone. Historically, such deep retracement levels have often preceded significant reversals, especially when accompanied by accumulation patterns and bullish divergence on lower timeframes.
From a technical perspective, the price is showing early signs of a potential massive upside move. Once a minor recovery of approximately 2x occurs, the price will likely challenge a major descending resistance trendline (visible on the daily chart). A confirmed breakout above this red trendline—preferably with rising volume—would signal a shift in market structure from bearish to bullish.
Following this breakout, we could witness an accelerated bullish phase. In such a scenario, the initial target is set at a minimum of 7x from the current levels, with potential for further extensions depending on momentum and overall market sentiment.
Educational Note:
When an asset trades near its ATL, it doesn't guarantee an immediate reversal. Traders should wait for confirmation signals such as a break of a key trendline, higher lows, or bullish candlestick patterns. Risk management—especially position sizing and stop-loss placement below the ATL—is critical in such high-volatility setups.
Target: Minimum 7x from current price
Key Level to Watch: Red descending trendline (major resistance)
SLPUSDT Forming Falling WedgeSLPUSDT is forming a clear falling wedge pattern, a classic bullish reversal signal that often indicates an upcoming breakout. The price has been consolidating within a narrowing range, suggesting that selling pressure is weakening while buyers are beginning to regain control. With consistent volume confirming accumulation at lower levels, the setup hints at a potential bullish breakout soon. The projected move could lead to an impressive gain of around 140% to 150% once the price breaks above the wedge resistance.
This falling wedge pattern is typically seen at the end of downtrends or corrective phases, and it represents a potential shift in market sentiment from bearish to bullish. Traders closely watching SLPUSDT are noting the strengthening momentum as it nears a breakout zone. The good trading volume adds confidence to this pattern, showing that market participants are positioning early in anticipation of a reversal.
Investors’ growing interest in SLPUSDT reflects rising confidence in the project’s long-term fundamentals and current technical strength. If the breakout confirms with sustained volume, this could mark the start of a fresh bullish leg. Traders might find this a valuable setup for medium-term gains, especially as the wedge pattern completes and buying momentum accelerates.
✅ Show your support by hitting the like button and
✅ Leaving a comment below! (What is your opinion about this Coin?)
Your feedback and engagement keep me inspired to share more insightful market analysis with you!
SLP is now on Best entry for longSLP has experienced an extended period of low volatility and sideways price action, which often precedes significant directional moves. The token is currently trading near its all-time low (ATL) support zone, a level that historically attracts buyer interest.
Current Structure:
Market Phase: Extended consolidation near historical lows
Key Support: ATL zone (critical accumulation area)
Sentiment: Characterized by reduced participation and fatigue
Technical Significance:
Prolonged consolidation at major support levels often represents accumulation by informed participants. When an asset trades near ATL for an extended period, it can build energy for a substantial reversal once selling pressure exhausts.
Upside Potential:
Should a confirmed reversal materialize—characterized by a breakout above key resistance with volume—a measured move projection suggests potential upside in the range of 5x from current levels. This aligns with the depth of the prior decline and typical recovery patterns from major lows.
✍🏼Author's word: Like & comment(your thoughts) if you found it helpful.🩷
#SLP/USDT Ready to go higher#SLP
The price is moving within a descending channel on the hourly timeframe. It has reached the lower boundary and is heading towards a breakout, with a retest of the upper boundary expected.
The Relative Strength Index (RSI) is showing a downward trend, approaching the lower boundary, and an upward bounce is anticipated.
There is a key support zone in green at 0.000600. The price has bounced from this level several times and is expected to bounce again.
The RSI is showing a trend towards consolidation above the 100-period moving average, which we are approaching, supporting the upward move.
Entry Price: 0.000634
Target 1: 0.000655
Target 2: 0.000676
Target 3: 0.000700
Stop Loss: Below the green support zone.
Remember this simple thing: Money management.
For any questions, please leave a comment.
Thank you.