SANDISK appears to have completed its correction (12H)From the point where we placed the red arrow on the chart, SANDISK appears to have entered a corrective phase. Based on the current price structure, this correction is most likely unfolding as a Diametric pattern, with the market currently trading in wave F of that formation.
If this count is corre
SNDK / TetherUS PERPETUAL CONTRACT
No trades
No trades
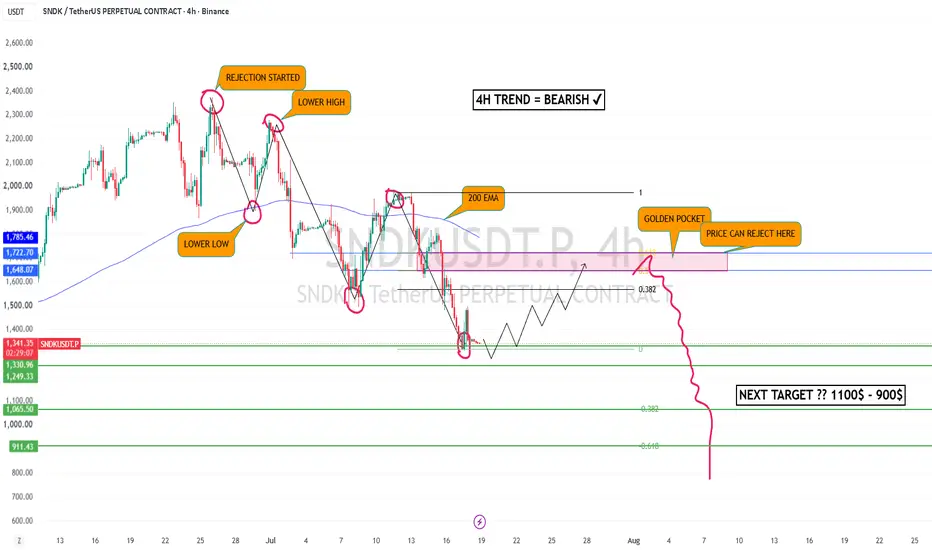
$SNDKUSD 4H Chart Update SNDK 4H Chart Update 📉
The 4H structure is still bearish.
We're continuing to see a pattern of Lower Highs and Lower Lows, which tells me sellers are still in control.
I've also marked the 200 EMA, which remains above the current price and continues to act as dynamic resistance.
Instead of chasi
See all ideas
Summarizing what the indicators are suggesting.
Oscillators
Neutral
SellBuy
Strong sellStrong buy
Strong sellSellNeutralBuyStrong buy
Oscillators
Neutral
SellBuy
Strong sellStrong buy
Strong sellSellNeutralBuyStrong buy
Summary
Neutral
SellBuy
Strong sellStrong buy
Strong sellSellNeutralBuyStrong buy
Summary
Neutral
SellBuy
Strong sellStrong buy
Strong sellSellNeutralBuyStrong buy
Summary
Neutral
SellBuy
Strong sellStrong buy
Strong sellSellNeutralBuyStrong buy
Moving Averages
Neutral
SellBuy
Strong sellStrong buy
Strong sellSellNeutralBuyStrong buy
Moving Averages
Neutral
SellBuy
Strong sellStrong buy
Strong sellSellNeutralBuyStrong buy