SNT Approaching Breakout ZoneStatus(SNT) is currently trading inside a well defined falling wedge. Price is compressing near the upper half of the wedge, showing reduced volatility as buyers and sellers wait for a clear direction. This type of structure often appears near the later stage of a corrective move.
The upper trendline of the falling wedge remains the key resistance to watch. A clean break and hold above this level would signal a potential shift in momentum, opening room for a recovery toward higher resistance zo
In-depth trading ideas
Status SNT price analysisWell... this is already starting to look like a "trend", not a coincidence, that while the crypto market is stuck in a "quagmire", they are starting to pour trading volumes into long-forgotten coins with a market cap of $50-100 million
We noticed the "wake-up" of #ARDR and #SNT, maybe you have noticed a similar logical chain, then write about it in the comments.
If you look at the OKX:SNTUSDT chart, we can assume that there is a free path for growth up to $0.06-0.065, with a "light rest" ar
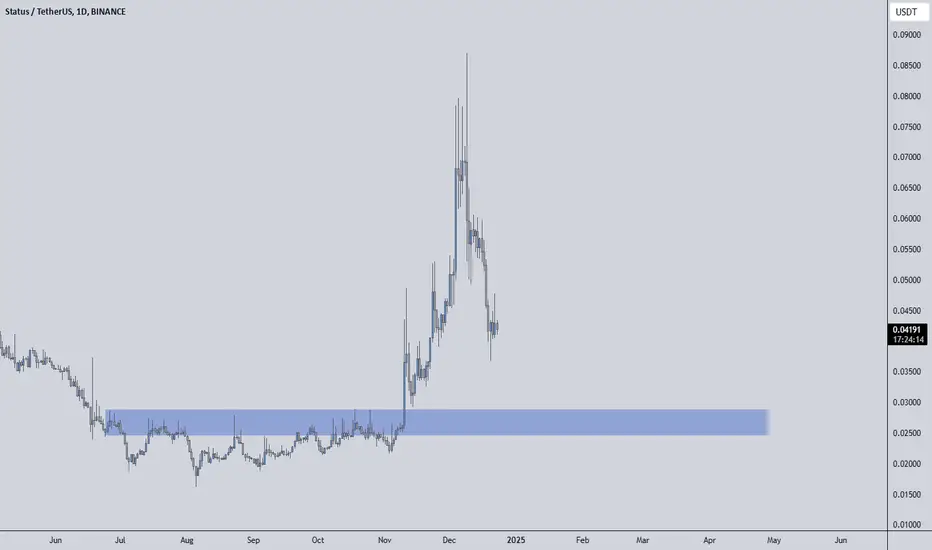
SNTUSDT Analysis: Avoid Getting Stuck in Mid-RangesI don’t want you to get lost in the mid-range areas . For SNTUSDT, I believe the blue box is a high-value demand zone . Given that overall market conditions are weak , I’ve identified a lower entry point that aligns with a safer and more strategic approach.
The blue box holds significance from multiple perspectives . I used heatmap , cumulative volume delta (CVD) , and volume footprint techniques to determine this precise demand region where buyers could potentially regain control.
SLong
SNT/USDT Breakout Opportunity!🚀 SNT/USDT Breakout Opportunity! 🚀
We’re eyeing a potential bullish move on SNT/USDT! After a solid downtrend, SNT has formed a promising reversal pattern with two key ENTRY POINTS:
🟢 First Entry Point: $0.03140
📈 Target Zone: A breakout could take us to the next resistance levels at $0.03501 and $0.04057!
🔹 Scenario A: SNT rebounds from the support and continues its bullish momentum toward the upper resistance zone. 🔹 Scenario B: If the breakout is strong, we may see a powerful upward trend
S
$SNT IS GOING DOWN 🚀 SNT Spot Trading Analysis 🚀
📈 Potential Setup Alert!
Today, we're closely watching SNT/USDT on a 15-minute chart. We've identified an upward trend channel, with an entry point at a pivotal support level.
After a recent pullback to this support, the price is at a potential bounce zone around $0.03979. If momentum holds, we could see a retracement up towards the upper channel line.
Here's the game plan:
Scenario A: If SNT bounces off the current level (B), we could target the upper resistan
SShort
Status (SNTUSDT) 3,000% Bullish Wave Is On!Only three months of consolidation is all it took after the most recent low for SNTUSDT (Status) to break bullish and start on a new 3,000% bullish wave.
This week so far has the highest volume since October 2023 and is also the biggest breakout candle since March 2020 —that is, the biggest bullish candle coming out of a major low. Needless to say, March 2020 marked the last bottom and the start of the 2021 bull-market.
This is going to be a wild ride.
Remember, there will be swings; up, down
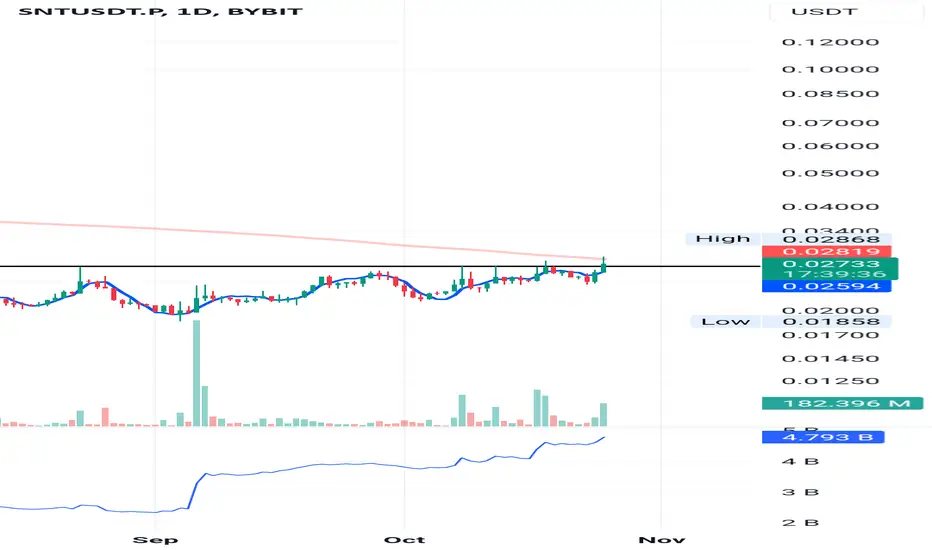
SNTUSDT.PGood morning, traders.
I'm looking at the SNT/USDT pair and noticing the price attempting to break above the 200 MA and the black line resistance. Volume is rising, which is a positive sign. However, we should wait for the daily close before taking any action.
See you later, and happy trading!
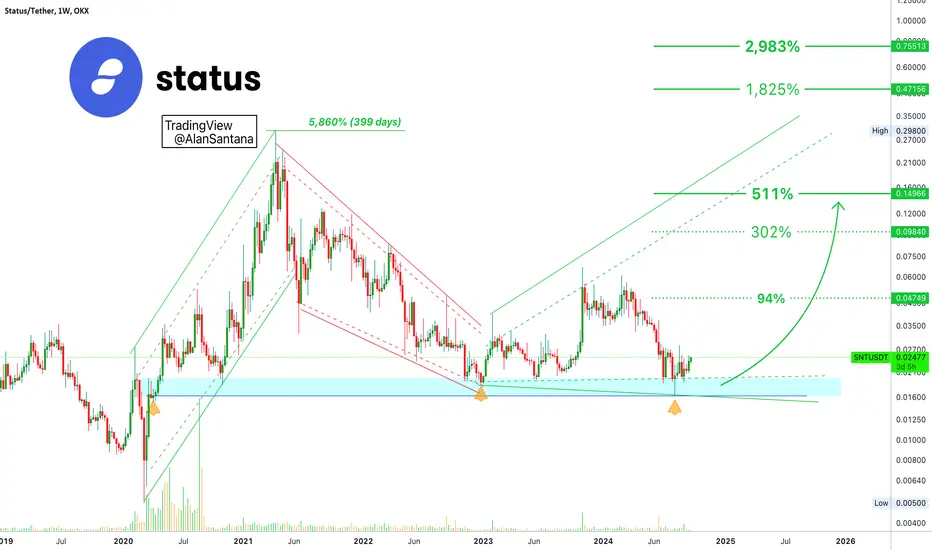
Status 2025: 2,983% New All-Time High Potential Revealed!Hello my dear supporter, I have a good one here for you and this is a pair that has been growing long-term. We know Status (SNT) from many years in the past and we are about to experience something great. The stage is set for a new bull-market in 2025 and we are early to catch this wave.
Back in 2020/2021, Status (SNTUSDT) grew 5,860% in 399 days. It is very interesting, the entire period, more than a year, it was sustained growth. The longest correction lasted two months and the rest was full
SNTUSDTWe can attempt to buy SNTUSDT from specified level as it makes HL , also 0.618 FIB level intact indicate that it moves upward.
SL , TP mention in chart
SLong
SNT will be pumped soonSNT seems to have entered a correction from where we wrote "start" on the chart. Now the G wave, which is the last diametric wave, has ended and seems to have entered the bullish wave.
By maintaining the green range, it can move towards the targets.
Closing a daily candle below the invalidation level will violate the analysis
For risk management, please don't forget stop loss and capital management
When we reach the first target, save some profit and then change the stop to entry
Comment if y
SLong
SNT buy setupGiven the bullish CH, we have a bullish view on SNT.
We have sevral liquidity pools above, which is expected to move from the demand range towards this pool.
Closing a daily candle below the invalidation level will invalidate this analysis.
Note that the financial market is risky, so:
Do not enter any position without confirmation and trigger.
Do not enter a position without setting a stop.
Do not enter a position without capital management.
When we reach the first TP, save some profit and tr
#SNT
#SNT
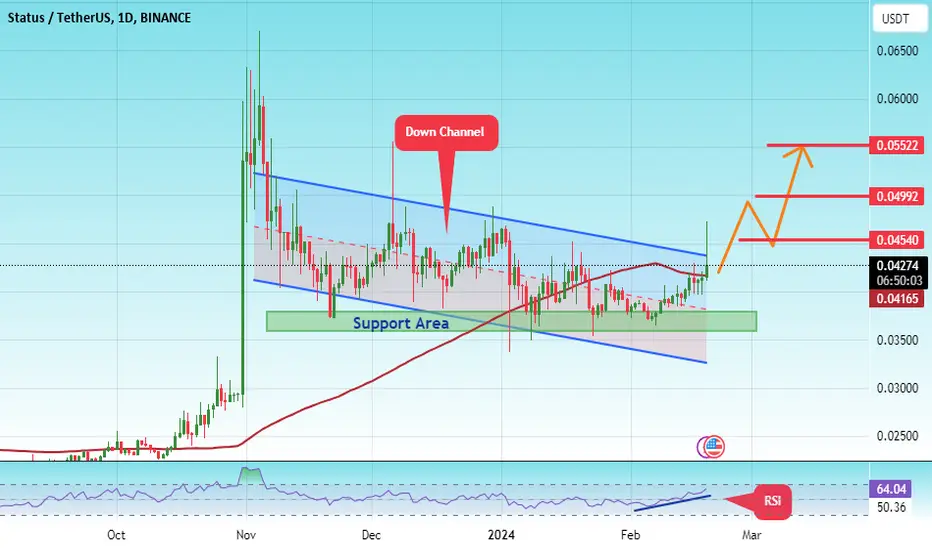
The descending channel was broken on a 1-day frame
After it rebounded from the main support area in green at the price of 0.03700
With stability above the moving average of 100
The price also took support from the channel break
We have support from the RSI indicator
Entry price is 0.04286
The first target is 0.04540
The second goal is 0.04992
The third goal is 0.05522
SLong
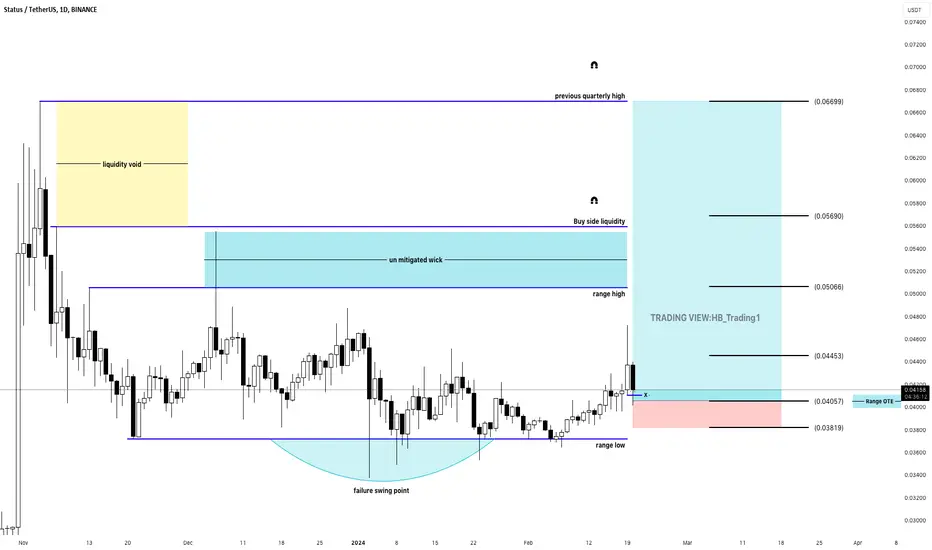
SNT/USDT📈SIGNAL
COIN : BINANCE:SNTUSDT
CEX. : #BINANCE - SPOT
➖
ENTRY : 0.04057
➖
TARGETS :
T1 : 0.04453
T2 : 0.05066
T3 : 0.05690
T4 : 0.06699
➖
STOP : 0.03819
➖
⚠️WARNING:
• I'm not a financial advisor.
• Do your own research (DYOR).
• And Don't forget risk management.
➖
💡For investors:
1- Enter the trade with 10% to 20% of your capital to reduce risk and save cash to enter other opportunities.
2- Sell (25% to 50%) on (T1) and don't move your stop-loss.
3- Sell 50% on (T2) and move your stop loss
SLong
SNT still is in the Uptrend channelSNT still is in the Uptrend channel and most likely will continue to go up after breaking above the resistance
🔵Entry Zone 0.04185 - 0.04295
🔴SL 0.03943
🟢TP1 0.04604
🟢TP2 0.05079
Risk Warning
Trading Forex, CFDs, Crypto, Futures, and Stocks involve a risk of loss. Please consider carefully if such trading is appropriate for you. Past performance is not indicative of future results.
If you liked our ideas, please support us with your likes 👍 and comments.
SLong
Snt/Usdt Looks Promising Here SNTUSDT
Timeframe: Daily
A breakout in SNT/USDT has been confirmed, with a retesting process currently underway. Market structure remains bullish. In the event of a successful retest, a 50-80% bullish move is anticipated. 📈🔍
Note: This is not financial advice. Do your own research
SLong
SNT Signals Green: Buy Now, Thank Me Later!"## SNT Coin: Short Fundamentals, Recent News, and Disclaimer
Unfortunately, I don't have enough information about SNT Coin to provide a comprehensive overview. However, I can help you gather information and provide some disclaimers.
**Short Fundamentals:**
* **Name:** SNT Coin
* **Symbol:** SNT (possibly)
* **Type:** I need more information to determine if it's a security token, utility token, or otherwise.
* **Platform:** I need more information to determine which blockchain it operates on.
SLong
SNT next scenario "LONG"DYOR
I m not afinancial advisor , i'ts just an analysis of NASDAQ:SNT
TPs are green
SL is red
Enries from now
Good luck
SLong
SNT/USDT bullish move from support? 👀🚀SNT Today Analysis💎 Paradisers, get ready for an intriguing opportunity with #SNTUSDT, which is currently exhibiting patterns that suggest a bullish continuation is on the horizon.
💎 #SNT has been consistently adhering to a descending trendline, and there's optimism about its potential for a bullish continuation from the support level at $0.01986. If #SNT manages to sustain momentum above this level, we could see a move towards challenging the significant resistance at $0.06287.
💎 In the dynamic and unpredictab
SLong
SNT 4HHello friends, I hope you are doing well. This is the SNT chart in the 4-hour time frame. It looks like it's in good shape, so you can buy by confirming the candle and the price slope near areas that should be declining.
Our optimal areas:
First zone: 0.03675_0.03603
Second region: 0.03328_0.03190
Third region: 0.02983_0.02792
S
SNT| There will be a continuation of the upward movement!Hello trader! Today I have a new idea for you. Like and subscribe to the channel, there is a lot of useful information there.✅
Previously, this coin had already given 1.5X, I think that after a short consolidation the coin will again continue its upward movement. Stop and take at your discretion, I showed clearly.
Deal plan:
Entry - 0.04471/0.04283$
Stop - $0.03988
Take - $0.05590
Guys, be aware of the risks, the coin may be too volatile at the moment.
SLong
SNT heating upvolume is up and buy print received. Keep stop loss just below that buy print.
Expected target 0.06 and up
SLong