SOLUSD Bearish Reversal SetupSOLUSD is approaching a major resistance zone around **118.65–120.00** after a strong upward move. The chart shows a potential rejection from resistance, with bearish targets marked at **114.25** and **107.25**. A confirmed rejection could lead to a pullback toward the lower support area.
**Targets:**
* **TP1: 114.25**
* **TP2: 107.25**
* **Resistance: 118.65–120.00**
In-depth trading ideas
SOLUSD Bearish Rejection — Targets 107.14 & 96.14
SOLUSD is testing a major **resistance zone around 117–119** after a strong bullish rally. The chart shows potential rejection from this area, with downside targets marked below. A confirmed rejection could bring price toward **107.14** first, followed by the key support zone around **96.14**.
🎯 **Target 1:** 107.14
🎯 **Target 2:** 96.14
🔴 **Resistance:** 117–119
🔵 **Support:** 94–96
*Educational chart analysis — not financial advice.*
SOL | MonthlyCOINBASE:SOLUSD — HIEQ Model
Quan-Analysis | Primary Uptrend ⓹ Underway📈
Cymatic Trend Flow
SOL is tracking steadily along the Trend E-line Δ of the Trend Ray Δχ, as projected.
From the current level ➤ $ 111 , a potential 76.66% 📈 advance remains projected into February 2027, progressing within the defined Trend Ray Δχ toward the HPQ Target ➤ $1 96.3 🎯.
The T rend- R esistance HIEQ-Structure ψ projects the ultimate ATH of the 1st Cycle at the defined HPQ Target ➤ $333.33 ⚓️ | March 2028 .
#StrategicAnalysis #FutureVision #MarketInfrastructure #QuantumEntanglement #TrendAnalysis #TimeSpaceMap #HIEQModel #TSMap
SOL Daily — Stage 2 or Back to the BaseSOL daily is not mid-range noise. It is a completed stage sequence sitting on the first real test of the Stage 2 breakout — the same map ETH printed on the daily.
The tape from the early-year high is a clean Weinstein / cycle map:
Stage 4 — persistent markdown off the ~$148–$156 area. Red/lower-low structure, declining channel intact, sellers in control through the June flush into the $61–$64 low.
Stage 1 — long basing after the decline. Volatility compressed. Price stopped making meaningful lower lows and spent months coiling between roughly $72 and $98, with repeated squeeze boxes doing the work. That coil is what made the later expansion tradeable.
Stage 2 — the vertical release out of the final August compression box. That is the change of character: the market stopped trading the base and started trading the advance. On the chart that is the same event marked as the rising-channel / “Stage 4 breakout” — the break of the old declining rails.
That is why this area matters. Stage 2 is not “already won.” Stage 2 is accepted only if price holds the breakout structure and continues to put the old base underneath it.
Same structure as ETH
ETH daily was the cleaner template first: Stage 4 markdown from the 2025 high, a long Stage 1 coil, then an impulsive Stage 2 release out of the last compression box. After that release ETH did not keep running in a straight line. It came back to test whether the old base had flipped to demand. The whole ETH idea was that one question: Stage 2 still in force, or back in the base.
SOL is running the same sequence, just at a different price.
The rhyme is the point. ETH’s decision zone was $2,420–$2,500 — the line between “the advance is accepted” and “this was only a breakout-then-return.” SOL’s equivalent line is $94–$98. If ETH taught anything on this cycle, it is that the first pullback after the Stage 2 lift-off is where the regime is confirmed or revoked. SOL is in that same bar of the tape.
That does not mean they have to print the same path day-for-day. It means the stage logic is identical: do not treat the green expansion as the trade. Treat the hold of the old ceiling as the trade.
What the chart is saying right now
Price has already done the hard part: it left the Stage 1 range with an impulsive daily expansion off the last purple squeeze (~$72–$78) and ran into the $110–$114 area. Since that release, SOL has been digesting under the recent spike high near $114 and oscillating around $102–$110, with the last print near $110.27.
This is the first real decision after the breakout — the same decision ETH faced after its release:
Continuation — daily closes hold the rising breakout channel and the top of the old base (~$94–$98). Pullbacks stay constructive and keep the June–September rising rails intact. That keeps SOL in Stage 2 and opens a measured continuation toward the next supply from the prior markdown ($118–$122 first, then the $133–$138 shelf, and the $148–$156 prior-high cluster if the channel remains intact).
Failure — daily acceptance back into the Stage 1 box. That would reclassify the expansion as a breakout-then-return, not a new advancing phase. In that case the market is still basing, not trending — the same reclassification that would have applied to ETH if it had given $2,420–$2,500 back.
The squeeze work is the reason the breakout was worth marking. Compression into the last purple box in August was the coiled spring. The large green expansion off that box was the release. After a release, the market almost always comes back to ask whether the new range is accepted. That test is happening now around $98–$110.
Levels I am using
Breakout / decision zone: $94–$98. This is the line between “Stage 2 still in force” and “back in the base.” It is SOL’s version of ETH’s $2,420–$2,500 shelf.
Near-term supply: $110–$118. Reclaim and hold above the recent $114 high is the next confirmation that the channel is expanding, not just digesting.
Stretch supply if the channel holds: $133–$138, then the $148–$156 shelf from the Stage 4 origin.
Invalidation for the Stage 2 read: a daily close back through the last compression shelf and into the heart of the Stage 1 range (acceptance below ~$78–$81, not just a wick). A loss of the rising channel plus acceptance under $94 is the first warning; $78 is the regime change.
Downside reference if the stage fails: the $72 squeeze floor, then the $61–$64 June low.
How I would trade the idea (not a signal)
This is a hold-the-structure long, not a chase-the-green-candle long. Same rule I used on ETH.
Prefer strength after a hold of the $94–$98 decision zone, or a higher-low that stays above the old squeeze shelf (~$75–$81).
Do not treat a dip back into the middle of Stage 1 as “the same trade.” That is a different regime.
If SOL loses the rising channel and accepts back inside the base, stand down. The thesis is the stage change, not a permanent bid on SOL.
Watch ETH and SOL together. If ETH keeps defending its Stage 2 shelf while SOL loses $94–$98, that is divergence, not confirmation. If both hold their old-base tops, the majors are telling the same story.
Why this is the chart to watch
ETH was technically cleaner first: markdown, base, compression, release — all readable on the daily without forcing a narrative. SOL has now printed the same four frames. The only question left on this timeframe is the one the market always asks after a Stage 2 lift-off, and the same question ETH is still answering:
Does the breakout become the new floor, or does it get given back?
I am long the Stage 2 structure while $94–$98 holds on a closing basis. I am not long the idea that SOL cannot return to the base. That is the whole point of marking the decision now, before the daily resolves it.
Not financial advice. Stages fail. Wait for the close, not the wick.
SOLUSD - Elliott Wave Analysis: Potential Wave iiSOL/USD (1H) – POSSIBILITY 1
Solana is currently completing its Elliott Wave corrective structure. After finishing the initial impulse wave down (Wave i), price is expected to rebound short-term to complete Wave ii (ABC corrective structure) before continuing its move down toward Wave iii.
📌 Key Technical Levels:Wave ii Retest Area (Fibonacci Zone):
0.382 – 0.764 ($115.40 – $118.21).
This acts as the potential reversal zone for Wave ii.
Wave iii Target Zone: $105.06 – $106.83 (Fibonacci Extension 1.38 – 1.618).
Current Price: ~$114.92
📊 Trading Scenario:Short-Term Rebound: Price could push up towards the $116.27 – $118.00 zone to finish Wave (C) of Wave ii.
Key Accumulation Area: The primary spot buy / accumulation zone sits around Wave iii ($105.06 – $106.83) or lower near Wave v support.
⚠️ Disclaimer: This analysis is for educational purposes only. Always practice proper risk management.
Sol has broken up from its bullflag. Target= $139.94The original smaller descending channel Sol broke up from ended up not being the full flag and the bigger more valid flag took another week ro 2 to develop but we can see now it has clearly broken upward from the real flag and is beginning to ascend towards the breakout target. * not financial advice*
Solana — From Golden Zone to New Highs?🟣 Solana has shown a strong recovery from the previous sideways structure, breaking upward and reclaiming important market territory.
After the recent pullback into the Golden Zone, buyers reacted and pushed price back above the Dynamic SR. The current structure suggests that another bullish expansion could be developing.
🏆 This is our first analysis of Solana.
📈 Bullish scenario
The bullish structure remains intact as long as price holds above the Golden Zone and the rising Dynamic SR.
If SOL continues to gain momentum and breaks above the nearby resistance around $114–$116, the next upside zone around $117–$119 could come into focus.
A stronger breakout from that area may open the path toward the higher zones around $126–$128 and potentially $133–$135.
Golden Zone reaction → resistance breakout → bullish expansion.
📉 Bearish scenario
The Golden Zone remains an important support area for the current recovery.
If price loses the Dynamic SR and breaks below the Golden Zone around $107.5–$109.5, the recent bullish momentum could weaken and trigger a deeper retracement.
A stronger breakdown may bring the lower demand area around $96–$98 back into focus.
Dynamic SR loss → Golden Zone breakdown → deeper retracement.
🎯 Outlook
SOL has recovered strongly from the lows and is now approaching an important decision point. The next breakout could determine whether the market continues toward the higher supply zones or returns for another pullback.
The bullish structure remains valid while the Golden Zone holds.
Break $114–$116 → upside continuation becomes possible.
Reclaim $117–$119 → higher zones come into focus.
Lose $107.5–$109.5 → bearish pressure increases.
Golden Zone reaction → resistance breakout → next expansion watch.
SOL/USD: Uptrend Holding Above EMA55, 119.99 Swing Is the GateSOL's sitting at 116.45 in the upper half of the volatility band, with EMA21 at 115.63 acting as immediate support and EMA55 at 112.02 as the trend backbone. Trend bias is up on the 4H — the last Break of Structure printed bullish at 114.32 twenty-three bars back, and neither the swing high at 119.99 nor the swing low at 107.40 has been touched since. Today's -0.5% drift is noise inside that structure, not a change of character.
Why it matters: price has been coiling under a clean, untouched swing high for twenty bars while EMA55 keeps rising underneath. That's the classic pre-break compression — the band upper sits at 118.81, right under the swing, so any push through 119.99 also clears the band edge in one move. Until then, the 115.63–116.50 pocket is where dip-buyers are defending the trend.
Trigger to watch: a 4H close above 119.99 with an ATR buffer (roughly 120.50) would confirm a fresh bullish BoS and open the upper leg. Losing EMA21 on a closing basis re-opens 112 as the next test.
Invalidation: a 4H close below 112.00 breaks the EMA55 trend backbone and puts the swing low at 107.40 back in play — idea's done there.
Targets: 119.99 — the swing high acting as the gate; 122.50 — first extension above the band once broken; 128.00 — round-number magnet and next structural cushion.
Setup: Watching for a 4H close above 119.99 to confirm a fresh bullish BoS through the swing high and band upper.
Invalidation: A 4H close below 112.00 loses the EMA55 backbone and invalidates the uptrend structure.
Targets: 119.99 — untouched swing high, the gate for continuation · 122.50 — first extension once the band upper is cleared · 128.00 — round-number magnet and next structural cushion
SOL/USD: Bullish BoS Above 114.32 Extends Path Toward 120SOL is trading at 116.18 after a fresh bullish BoS on the 4H just five bars ago, taking out the swing high at 114.32. Trend bias is up, EMA55 sits down at 107.98 as the backbone, and EMA21 at 112.65 has flipped to dynamic support. Price is currently poking above the upper volatility band at 115.94, so it's slightly overstretched — hence the -2.3% cooldown on the day.
That context matters because band-extended pushes right after a BoS almost always demand a retest. The market rarely runs cleanly from a break; it likes to come back and confirm. With the prior swing high broken and the last swing low at 107.40 still intact, the structural read is clean: higher high, higher low, buyers in control until proven otherwise.
The zone to watch is a pullback into 112.60-113.00, where EMA21 lines up with the broken swing acting as support. A reaction there keeps the trend structure alive. Alternatively, an aggressive continuation only triggers on a 4H close back above 116.00 after this cooldown finishes.
Invalidation is a 4H close below 107.40 — that would take out the last swing low and neutralise the uptrend read entirely.
Targets: 118.00 as the first cushion into round-number resistance, then 120.00 which lines up with the window high at 119.99. Beyond that, price would be trading in genuinely fresh air.
Setup: Pullback into EMA21 near 112.60-113.00 after fresh bullish BoS above 114.32, or 4H close reclaiming 116.00.
Invalidation: 4H close below the last swing low at 107.40 kills the setup.
Targets: 118.00 — round-number cushion just above current price · 120.00 — lines up with window high at 119.99 · 122.50 — extension target into fresh air above the range
SOL/USDT Bearish Breakdown — Target 95.71**
SOL is showing strong bearish momentum after breaking below the **102.00 support/BOS area**. Price has rejected higher levels and is now trading around **97.93**, confirming downside pressure.
**🎯 Target:** 95.71
**📉 Bias:** Bearish / Sell
**⏱️ Timeframe:** 1H
**⚠️ Key Resistance:** 102.00–105.00
A sustained move below the recent lows could open the way toward the **95.71 target**. Trade with proper risk management and wait for confirmation before entry.
SOL/USD Bearish Breakdown — Targets 100.14 & 98.00
SOL/USD is showing strong bearish momentum on the 1H chart after rejection from the **107.00 resistance zone**. Price has broken below the descending trendline and is currently trading around **101.46**, suggesting sellers remain in control.
📉 **Target 1:** 100.14
📉 **Target 2:** 98.00
🛑 **Resistance:** 107.00
🟢 **Major Support:** 97.30
As long as price remains below the key resistance and bearish structure holds, further downside toward the marked targets is possible.
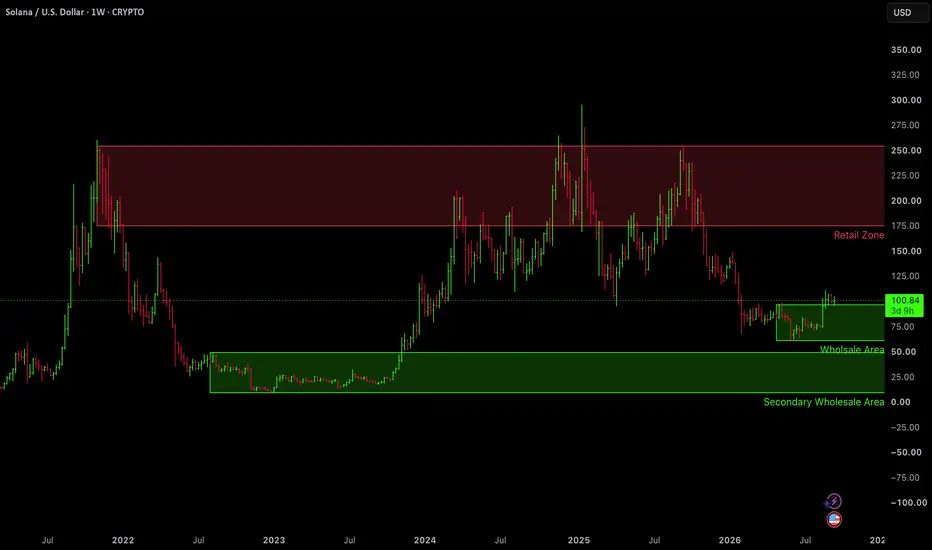
$SOL weekly — bullish trade ideaPrice defended the Wholesale Area and is reclaiming $100. That’s the dip, not the breakdown.
Thesis
2022–23 base is the Secondary Wholesale Area.
This year’s pullback into $65–$100 is the higher-timeframe discount.
The red Retail Zone ($175–$260) is where the last cycle dumped inventory. If wholesale holds, that’s the magnet.
Structure: higher-low off demand, bounce through $100, room into old supply.
Trade
Bias: Long
Entry: $96–$102 on holds / shallow retests of the wholesale top
Aggressive add: break-and-hold above $105–$110
Invalidation: weekly close back through the wholesale floor, ~$64–$68
Hard stop: below $64
Targets
$130–$145 (range mid / first supply)
$175 (bottom of Retail Zone)
$220–$250 (heart of Retail Zone)
From $100 with a stop under $64:
T1 ≈ 1R–1.3R
T2 ≈ 2R+
T3 ≈ 3R–4R
That’s the asymmetry.
What confirms
Weekly closes holding above $96–$100
Higher low if it retests $85–$92 and buyers show up
Acceptance above $110 opens the run into retail
What kills it
Lose $64 on a weekly close. Then you’re not buying wholesale anymore — you’re catching a falling knife into the secondary box.
Size it for crypto. SOL can do 4% days.
The idea is good; the path will not be clean.
Not financial advice.
SOL/USD: Band-Extended Push Into 104.82 Swing ResistanceSOL's ripped 3.87% into 105.57 and it's now sitting above the upper volatility band (103.63), with EMA21 at 100.84 and EMA55 at 100.92 clustered tight below. Trend bias reads Neutral on the 4H — the last confirmed event was actually a bearish BoS 15 bars back at 99.00, so this rally is happening INTO overhead structure rather than out of a fresh bullish break. That matters. Price is stretched well beyond the 1.5x ATR envelope while the swing high at 104.82 still hasn't been taken out on a close, and ATR is only 1.86 — this move is >2 ATR above EMA21, which typically doesn't hold without a pullback first.
What I'm watching: a clean 4H close above 104.82 with the band catching up would flip the read and open the door toward the 110.60 window high. Absent that, the more probable path is a drift back to the EMA21/55 shelf around 100.85–100.92 to reset before any real continuation attempt. Invalidation for the constructive read sits below 99.00 — that's the bearish BoS level, and losing it puts the 95.82 swing low back in play. Keep it simple: react to how price behaves at 104.82 and at the EMA cluster, don't chase the extension.
Setup: 4H close above 104.82 swing high with band catching up activates continuation; otherwise favour a pullback to the EMA21/55 shelf at 100.85–100.92 before any push higher.
Invalidation: A 4H close back below 99.00 (the prior bearish BoS level) voids the constructive setup and reopens 95.82.
Targets: 104.82 — swing-high resistance, the immediate line in the sand · 110.60 — window high, next real cushion above structure · 100.85 — EMA21 pullback magnet if the band extension unwinds
SOL | MonthlyCOINBASE:SOLUSD — HIEQ Model
QA-Monthly | Primary Uptrend ⓹ Underway 📈
Solana is quite stable, precisely at the Trend E-line Δ . COINBASE:SOLUSD remains one of the highly integrated Quan-Entangling Models I’ve designed across the crypto market and related crypto stocks.
Based on this HIEQ Model, SOL has been developing a Leading Diagonal formation in Cycle-degree Wave I since April 2020, as previously outlined.
Through Ray χ, a 92.6% 📈 advance is projected into February 2027, emerging within the defined Trend Ray Δχ—pointing toward the HPQ Target ➤ $196.3 🎯
The T ransition- R esistance QE-Structure ψ projects the ultimate ATH of the 1st Cycle at the HPQ Target ➤ $333 💫 | March 2028 .
#StrategicAnalysis #FutureVision #MarketInfrastructure #QuantumEntanglement #CymaticTrendflow #TrendAnalysis
SOL/USD: Bearish BoS at 99.00 Caps Bounce Below EMA55SOL's trading at 99.66 after a modest 1% bounce, but the STC picture is still firmly in the sellers' hands. Trend bias reads Downtrend, EMA55 sits overhead at 100.53, and just 9 bars ago price printed a bearish BoS through the 99.00 swing pivot. The bounce has only carried price into the upper half of the volatility band, with band upper at 102.03 acting as the next natural cap.
Why it matters: on the 4H, that fresh bearish BoS is the dominant structural event, and the last swing high at 104.82 is still open and untested. Sellers defended EMA55 on the last leg down — until price reclaims that line on a closing basis, every push higher is a supply test, not a trend change. The compressed 1.75 ATR means moves are tight; the band edges frame the next reaction zones cleanly.
Trigger to watch: a 4H close back above EMA55 at 100.53 with follow-through toward the band upper — that flips the near-term tone and puts the 104.82 swing high back in play. Failing that, a rejection in the 100.50-102.00 supply pocket keeps the bearish BoS alive and points price back toward the recent low.
Invalidation: a clean 4H close above 104.82 takes the bearish structure off the table entirely.
Targets: 96.77 — band lower and first magnet on a rejection. 95.82 — last swing low, the line that must hold. 102.03 — band upper on the reclaim scenario.
Setup: Watching reaction at EMA55 (100.53) after the fresh bearish BoS through 99.00 — reclaim reopens 104.82, rejection points back to 95.82.
Invalidation: A 4H close above the 104.82 swing high invalidates the bearish structure.
Targets: 96.77 — band lower, first magnet on rejection · 95.82 — last swing low, structural line in the sand · 102.03 — band upper on an EMA55 reclaim
SOL : WAVE 3 IMPULSIVE DOWN ?Solana is consolidating between $99–$102. Our 4H Elliott Wave analysis favors Possibility 1 as the primary scenario after a clean rejection at the $101.94–$102.82 supply zone (Fib 0.5–0.618).
📉 Key Levels:
• TP 1: $98.00
• Wave (3) Target: $89.75–$86.74
• Invalidation: $106.93
Holding shorts toward lower liquidity while prepping DCA buy limits in the deep discount zone ($89–$95).
Trade with a plan! ⚡
#Solana #SOL #CryptoAnalysis #TradingStrategy #ElliottWave #CryptoTrading #SpotSafeCapital
SOL/USD: Fresh Bullish BoS Above 119.99 Opens Path to 122.94SOL just printed a fresh bullish BoS on the 4H five bars ago, taking out the 119.99 swing high that had capped price for 26 bars. Trend bias is up, EMA55 sits at 113.79 as the backbone, and EMA21 at 117.99 is now the near-term pivot. Price at 120.65 is in the upper half of the volatility band (upper edge 121.44), so we're trending strong but not yet extended above the band.
Why it matters: the broken swing at 119.99 now flips to support, and the last swing low at 112.52 (11 bars ago, still open) marks the structural floor. With EMA21 rising into 118 and the band still expanding, the path of least resistance stays higher as long as buyers defend the broken level on any retest. A clean hold of 119.99 is what turns this from a single BoS into a continuation leg toward the window high.
The setup activates on a pullback that holds 119.99-118.00 (the broken swing into EMA21) and reclaims 121.00 on a 4H close. That's the trigger zone I'm watching.
Invalidation: a 4H close back below 117.99 EMA21 that then loses 117.00 — at that point the BoS is failing and the idea is done. A break of 113.79 EMA55 fully kills the structure.
Targets: 122.94 first, then 125.00, then 128.00 if momentum extends.
Setup: Pullback that holds 119.99-118.00 into EMA21 and reclaims 121.00 on a 4H close.
Invalidation: 4H close back under EMA21 at 117.99 that then loses 117.00.
Targets: 122.94 — window high, first test · 125.00 — round number and next natural magnet · 128.00 — extension if momentum carries through
SOL PERPETUAL TRADE BUY SETUP Long from $118SOL PERPETUAL TRADE
BUY SETUP
Long from $118
Currently $118
Targeting $121.40 or Above
(Trading plan IF SOL
go down to $115 will add more longs)
Follow the notes for updates
In the event of an early exit,
this analysis will be updated.
Its not a Financial advice
SOL | Week Chart | 2026** T.A explained **
A Range = two or more consecutive color candles.
There are two types of ranges - accumulation and distribution.
DISTRIBUTION RANGES DEFINED: BackSide (BS) Candle - First distribution candle in a distribution range. Expectation = strong reaction to price. long wicks reaching to or away from level.
FrontSide (FS) Candle - Last distribution candle in a distribution range. Expectation = reversal, create a trend in the opposite direction. Distribution candles are used as support.
ACCUMULATION RANGES DEFINED:
Inverse BS (Inv.BS) - First Accumulation candle in an accumulation range. Expectation. = strong reaction to price. long wicks reaching to or away from level.
Inverse FS (Inv.FS) - Last accumulation candle in an accumulation range. Expectation = reversal, create a trend in the opposite direction. Accumulation candles are used as resistance.
Horizontal Ray tool on BS & FS levels are default support levels when dashed lines, tested when dotted lines and resistance when solid lines.
Horizontal Ray tool on Inverse BS & Inverse FS levels default as resistance and shown with a dashed line, tested when 1x dotted line, and support when solid line.
The inverse is true for the Inv. BS Inv. FS levels, they are resistance as dashed lines, tested as dotted and support as solid lines.
Monthly timeframe is color pink
weekly grey
daily is red
4hr is orange
1hr is yellow
15min is blue
5min is green if they are shown.
strength favors the higher timeframe.
SOL PERPETUAL TRADE SELL SETUP Short from $91.50SOL PERPETUAL TRADE
SELL SETUP
Short from $91.50
Currently $91.50
Targeting $86.50 or Down
(Trading plan IF SOL go up to $99
will add more shorts)
Follow the notes for updates
In the event of an early exit,
this analysis will be updated.
Its not a Financial advice