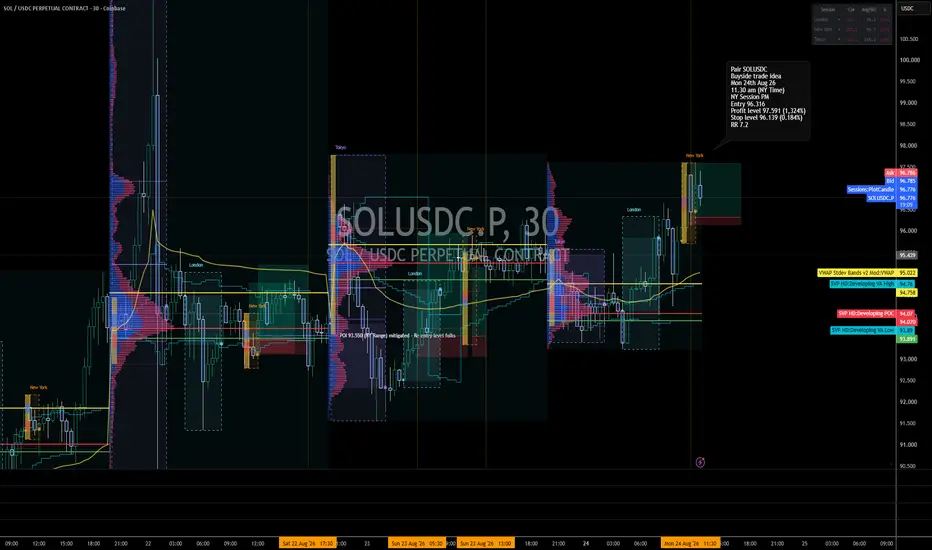
SOLUSDC.P HL [1D] SHORTSOLANAUSDC.P | It appears that Point of Control is still 88--94, it marks the start of the move up and each subsequent daily candle has extended from and drawn back to $94. imo the first sign of weakness occurred on Tues 25/08 .. the first daily red candle on the extension up..
A few different t
Compare with SOLANA / USDC
Long trade
📊 SOLUSDC — POC / VALUE-AREA READ
Monday 24 August 2026
Entry Time: 11:30 AM NY Time
Session: NY Session PM
Direction: 🟢 Buyside
Entry: 96.316
Target: 97.591 (+1.324%)
Stop: 96.139 (0.184%)
RR: 7.2R
POC / Value Map
From the chart:
Developing VA Low: ~93.89
Developing POC: ~94.07
Developing VA Hig
Long trade
📊 SOLUSDC — POC / VALUE-AREA READ
Saturday 22 August 2026
Entry Time: 12:10 PM NY Time
Session: NY Session PM
Direction: 🟢 Buyside
Entry: 93.443
Target: 95.205 (+1.886%)
Stop: 93.118 (0.348%)
RR: 5.42R
POC / Value Map
From the chart:
Developing VA Low: ~93.19
Developing POC: ~94.06
Developing VA
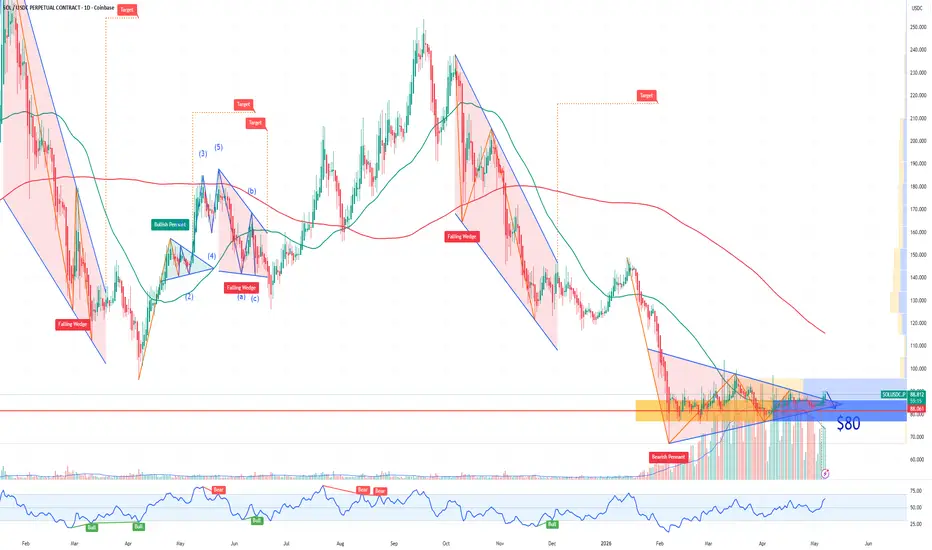
Solana fake out and confirmation bearishThis is not a financial advice!
Let me share with you a the fake out and continuous market bearish movement . As you can see we need confirmation on the 80 usd if it breaks down which m sure of price will decline to test HMA and SMA levels and the price is going to decline -50 usd through this year
SOL SOlana Potentail Price TargetIf you haven`t bough the dip on Solana:
$80 is a major psychological and technical support zone, remains a realistic near-term scenario for SOL Solana .
Bear case:
Critical technical support at risk: $80 has acted as a strong floor multiple times in 2026 (February–April). SOL is forming a short-
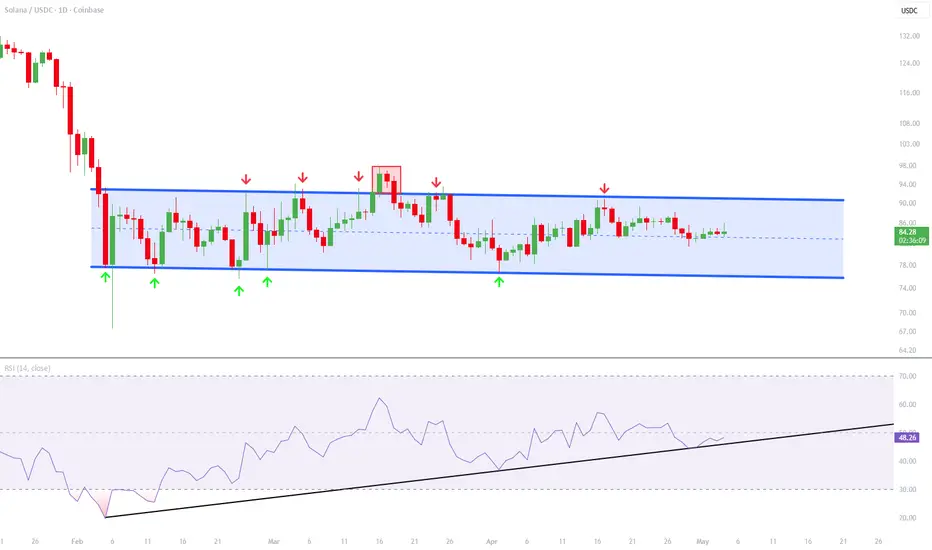
SOL - Trading Within Parallel Channel With the recent price action, Solana has remained highly correlated between the lows and highs of its channel, creating a very strong parallel structure.
The lows are around $76 with the primary daily candle body closes sitting around $78. This can be clearly seen on the daily line chart I posted a
$SOL/USDT is holding a critical moment here. Price is moving in$SOL/USDT is holding a critical moment here.
Price is moving inside a clear descending channel and is now retesting the key support zone around 80–82. This level is acting as the decision point.
As long as this support holds, the structure favors a bullish breakout. A push above the channel resist
SOL/USD – Possible Double Bottom FormingSeeing a potential double bottom forming around the $100 support zone. Both sell-offs were met with strong buying pressure, creating similar lows and suggesting demand at this level.
If price can break and hold above the $103–104 resistance (neckline), this could confirm the pattern and open the do
How to Identify Potential Direction BiasDirection Bias is critical to understanding the flow of the market current (Price action)
This guide explains how to use STIC Algo (Strategy 1 and Strategy 2). Both strategies work in a very similar way and rely on candle color, Change of Character (CHoCH), sentiment signals, and Fibonacci retracem
See all ideas
Summarizing what the indicators are suggesting.
Oscillators
Neutral
Oscillators
Neutral
Summary
Neutral
Summary
Neutral
Summary
Neutral
Moving Averages
Neutral
Moving Averages
Neutral
Displays a symbol's price movements over previous years to identify recurring trends.